Munich Personal RePEc Archive
Social norms on rent seeking and
preferences for redistribution
Sabatini, Fabio and Sarracino, Francesco and Yamamura, Eiji
Department of Economics and Law, Sapienza University of Rome,
Italy, Institut national de la statistique et des études économiques
du Grand-Duché du Luxembourg (STATEC), Department of
Economics, Seinan Gakuin University, Japan, Institute of Social and
Economic Research (ISER) Osaka University, Japan, Laboratory for
Comparative Social Research (LCSR), National Research University
Higher School of Economics, Russian Federation, GESIS
Leibniz-Institute for the Social Sciences, Cologne, Germany
7 July 2014
Social norms on rent seeking and preferences
for redistribution
Fabio Sabatini
1,
Francesco Sarracino
2and
Eiji Yamamura
3.
July 7, 2014
Abstract
Empirical studies have shown that preferences for redistribution are sig-nificantly correlated with expectations of future mobility and the belief that society offers equal opportunities. We add to previous research by inves-tigating the role of individual and social norms on rent seeking. We find that the individual propensity for stigmatizing rent seeking significantly and positively affects preferences for redistribution. On the other hand, living in an area where most citizens do not stigmatize rent seeking, makes men more favourable to redistribution, which may be seen as a social equalizer in an unfair society that does not offer equal opportunities to all. This effect does not hold for women, whose preference for redistribution is negatively associated to the regional tolerance of rent seeking.
JEL Codes:
Keywords: redistribution, welfare state, civic values, social norms, social capital.
1
Corresponding author. Department of Economics and Law, Sapienza University of Rome, via del Castro Laurenziano 9, 00161, Roma, Italy, and Laboratory for Compara-tive Social Research (LCSR), National Research University Higher School of Economics, Russia. E-mail: fabio.sabatini@uniroma1.it.
2
Institut national de la statistique et des ´etudes ´economiques du Grand-Duch´e du Luxembourg (STATEC), B.P. 304 L-2013 Luxembourg, Laboratory for Comparative Social Research (LCSR), National Research University Higher School of Economics, Russia, and GESIS Leibniz-Institute for the Social Sciences, Germany. Email: f.sarracino@gmail.com.
3
1
Introduction
In these times of economic crisis and public finance distress, the issue of welfare state legitimacy has become a central theme in the political and economic debate. Low economic growth, rising unemployment rates, and the diffusion of income insecurity have produced contradictory pressures on European welfare states. On the one hand, the financial viability of public social protection schemes has been increasingly questioned. On the other hand, the demand for social protection has dramatically risen. In Southern Europe, conflicting views on social solidarity and public finance adjustment have gained growing attention in electoral campaigns.
et al. (1998), and Moffitt (1999) have modeled altruism as a major driver of preferences for redistribution. For example, the wealthiest may become in-creasingly empathetic towards redistribution as their interaction with others in lower socio-economic conditions increases. Poorer people who frequently interact with the well-off may advocate redistribution through the tax sys-tem instead of developing feelings of envy or, worse, criminal behaviors such as theft or vandalism aimed at reducing rich people’s wealth. The hypoth-esis of a correlation between indicators of social interactions and individual attitudes towards redistribution has been empirically tested by Yamamura (2012), who found that, in Japan, people are more inclined to prefer income redistribution in areas where residents are more actively involved in com-munity activities. Due to lack of data, however, this study neither tested the effect of individual beliefs and sociability, nor controlled for endogeneity bias. In one of the papers most closely related to ours, (Algan et al., 2014) theoretically analyzed and empirically tested the roles of trust and civicness at the individual level. Based on European Social Survey (ESS) data they found that there is a strong positive relation between perceived civicness of compatriots and the demand for redistribution. Algan and colleagues also used data from the World Values Survey (WVS) to provide an empirical test of their theoretical prediction that more civic individuals want less redistri-bution, because they are aware of the linkage between government spending and taxation, and they are less inclined toward cheating on taxes.
We add to the literature by empirically analyzing how individual prefer-ences for redistribution are influenced by individual and social norms about rent seeking. Norms are intended here as beliefs about the right way to behave in a given context. In order to contain the bias generally induced in estimates by omitted variables in cross-country regressions, we focus on a notable case study, which has a particular interest for the study of re-distributive issues.
To analyze the role of norms, we use data from the 2004 wave of the Survey on Household Income and Wealth (SHIW) conducted by the Bank of Italy on a nationally and regionally representative sample of the Italian population. We differ from previous literature in three main ways. Together with Algan et al. (2014), we are the first to investigate the role of specific norms of conduct, after controlling for several phenomena addressed by pre-vious studies. Differently from Yamamura (2012) and Algan et al. (2014), we employ an instrumental variable specification of our empirical model to establish causality. To obtain an appropriate instrument at the community level, we match the SHIW dataset with historical data on crime provided by the Italian National Institute of Statistics (Istat). This type of study has never been conducted in Italy, which represents a valuable case study due to rising inequalities, the strong re-distributive features of the tax system and huge regional disparities.
The remainder of the paper is as follows. The next sections briefly de-scribe the Italian background and review the literature on preferences for redistribution. Section 2 describes our data and methods. In Sections 3 we present and discuss the results of the empirical analysis. The concluding section summarizes some lessons about the determinants of preferences for redistribution and briefly discusses the implications of our study for future research.
1.1
Inequalities and redistribution in Italy
Several reasons make Italy a relevant case study for the analysis of preferences for redistribution. Income inequality and poverty grew rapidly, from already comparatively high levels, during the 1990s. Despite a slight fall in the late 2000s, Italy’s inequality level is now steadily above the OECD average. The average income of the top 10% of Italians in 2008 was 10 times higher than that of the bottom 10%. This is up from a ratio of 8 to 1 in the mid 1980s. Wealth is distributed much more unequally than income: the top 10% hold some 42% of total net worth (OECD, 2008). In addition, the country has a long tradition of extremely low social and inter-generational mobility Felice (2012, 2013); Berloffa and Modena (2012).
health, education and social housing, on the other hand, reduce overall in-come inequality more than in most other OECD countries. The strongly re-distributive features of the tax system have contributed keeping fiscal pres-sure at a steadily high level, which have been claimed to be responsible for feelings of aversion towards redistribution and persistently higher tax evasion in the political debate.
Italian inequalities can also be viewed as a result of huge regional dis-parities. The poorer Southern regions in fact exhibit the higher levels of inequality (Brandolini, 1999). The North-South divide, however, also con-cerns crime rates (Felice, 2007), civic participation (Putnam et al., 1993), the individuals’ willingness to contribute to the common good (Bigoni et al., 2013), the quality of political institutions (Putnam et al., 2003), the quality of public services (Sabatini, 2008) and, most importantly, the local experience of independence across history (Felice, 2013)1. The features briefly
summa-rized above make Italy a suitable laboratory for empirically analyzing what causes support for re-distributive policies and the welfare state. However, this issue has never been analyzed in an Italian sample.
1.2
The demand for redistribution
The archetypal presumption in economics is that preferences for redistribu-tion are basically determined by self-interest. The most obvious explana-tory variable that might be empirically investigated to test this assumption is current income. A number of studies have documented that right wing views, which are generally associated with aversion towards redistribution, are positively correlated with high income (Brooks and Brady, 1999; Gel-man et al., 2007; Powdthavee and Oswald, 2014). From a theoretical point of view, Meltzer and Richard (1981) suggested in a seminal paper that, in democracies, high inequality should lead the politically powerful, i.e. voters at the median of the income distribution, to vote for higher levels of taxes and redistribution, which would partially offset rising inequality.
Self-interested preferences about redistribution, however, are also based on perceptions on social mobility and beliefs about the determinants of in-come and wealth. In his attempt to explain the fact that voters with identical incomes but different social origins vote differently, Piketty (1995) showed
1
through a learning model how individual mobility experience influences atti-tudes towards re-distributive politics. People believing that wealth depends on luck (e.g. family background), or on having the right connections in the right places, may be more favorable to redistribution. Those who believe that socio-economic status solely depends on talent and effort may be more reluctant to support redistribution. Piketty suggested that the difference be-tween voters may not be their differing interests but rather the information and ideas about policies that they have been exposed during their social life. B´enabou and Ok (2001) also modelled the role of the “prospect of upward mobility”, suggesting that individuals with income below the mean may op-pose re-distributive policies because they rationally expect to be above the mean in the future.
The hypotheses about social mobility and personal beliefs have been tested in a number of empirical works. Fong (2001) used a 1998 Gallup survey on fairness and opportunity in the U.S. to analyse the role of beliefs about self- and exogenous-determination in reported re-distributive policy preferences. Her results show that the possibility to get individual gains is not a significant predictor, even in high and low-income subsamples. In contrast, beliefs about self- and exogenous-determination are strong predic-tors of support for redistribution in the full, high-income, and low-income samples.
Using data from the General Social Survey (GSS), Alesina and La Ferrara (2005) found that support for redistribution not only depends on expected gain and losses from future redistribution, but also on individual beliefs on what determines one’s position in the social ladder. Ceteris paribus, people who believe that the American society offers equal opportunities are more averse to redistribution.
Other motivations, such as other-regarding preferences can help explain support for redistribution. Fong (2001) suggested that norms of reciprocity may also lead taxpayers to prefer redistribution: “Wealthy people may desire a society in which members who are well-off support those in need, provided that others would do the same for them if necessary.” (p. 226).
altruistic toward others in their own group. Drawing on Swedish longitudinal data, the authors found that any increase in immigration has a significant, negative effect on support for redistribution.
The role of culture has also been recently investigated. Analyzing data from the German Socio-Economic Panel (GSOEP), Alesina and Fuchs-Schuendeln (2007) found that, after the German reunification, East Germans are more in favour of redistribution than West Germans, even after controlling for eco-nomic incentives. This result received further support in Luttmer and Singhal (2011), who analyzed the preferences for redistribution of immigrants across 32 countries using European Social Survey data. The authors showed that inherited culture plays a crucial role: the average preference for redistribution in an immigrant’s country of birth is a strong predictor of her own preference for redistribution.
Despite the recent attention for other-regarding preferences in economics, the role of social norms has been so far quite neglected in empirical studies on support for redistribution, with a few remarkable exceptions. Three recent studies have shown that government spending for public social protection can be explained by the cross-country heterogeneity in trustworthiness that shapes the demand for redistribution. Bergh and Bjørnskov (2011) argued that the more the belief that most others can be trusted is spread among taxpayers, the higher is support for a large, universal welfare state. The authors used a variety of data sources to analyse the role of social trust in a sample of 77 countries. Based on instrumental variables estimates, they found that social trust is clearly associated with the size and scope of welfare state spending. This relationship might be due to the higher trustworthiness of bureaucrats and to lower levels of free riding, which prevent the increases in welfare costs that may be caused by tax evasion and rent seeking. This result is also supported in Bjørnskov and Svendsen (2013) through more sophisticated econometric techniques. However, countries with low trust and where governments are perceived as corrupt (e.g. Italy) can have welfare states as large as countries with high trust and high transparency of the government (e.g. Sweden).
as argued by Bergh and Bjørnskov (2011), there are reduced risks of fraud on taxes and benefits and officials are more efficient. However, individuals with weak civic values want more redistribution, because they plan (or at least they hope) to escape from taxes and to benefit from public transfers at the same time. As a consequence, the diffusion of values of civicness and cooperative attitudes may have two opposite effects on the demand for redistribution.
Social trust is often considered as a “cognitive” dimension of the broader concept of social capital, in opposition to its “structural” dimensions given by social networks and participation2. There are several reasons to argue
that social interactions, i.e. the “structural” component of social capital, may also influence individuals’ support for redistribution. First, friendly and cooperative interactions generate feelings of empathy and solidarity, which may stimulate other-regarding preferences for redistribution. Second, when the social environment is rich of participation opportunities, the likelihood to repeat interactions between any pair of agents in society increases, thereby increasing the cost of free riding and the importance of reputation. In a socially rich environment, the behavior of most others is then more easily foreseeable, and this may lead individuals to believe that most others can be trusted (Sabatini, 2008; Antoci et al., 2012, 2013). Third, social participation creates room for self-interested support for redistribution that are not directly related to economic incentives. Interpersonal interactions expose to social comparisons, which may be particularly hurtful for the poor. As sustained by Luttmer (2001), “The negative effect of a neighbor’s earnings on well-being is real and it is most likely caused by a psychological externality” (p. 990). The frequency of contacts with neighbouring people reinforces this effect (Stutzer, 2004). In addition, the wealthy may want a more re-distributive tax system in order not to become the object of feelings of envy and hate by their poorer fellow citizens. As suggested by Fong (2001) and Yamamura
2
(2012), redistribution may also be seen as a way to prevent criminal acts of theft and vandalism to the detriment of the wealthiest.
Yamamura (2012) used Japanese survey data to empirically test the role of social participation in individuals’ preferences for redistribution. He found that people are more likely to prefer income redistribution in areas where there are higher rates of community participation. The effect is stronger for individuals with a higher propensity for socialization. These findings, however, require further investigation to be generalized, as Japan is a very specific case study due to its cultural background and tradition of racially homogeneous society. In the conclusion to this study, the author stressed the need to test his findings in a Western country and to control for endogeneity bias.
In this paper we take over from Yamamura (2012) and test his hypotheses on Italy. After controlling for the role of community social interactions, we follow Bergh and Bjørnskov (2011) and Algan et al. (2014) and move our focus to norms of conducts, with a special attention to the role of individual and social attitudes toward rent seeking.
1.2.1 Main hypotheses
A social norm can be defined as a rule of conduct shared by a group, a community, or a society. It can be sustained both by sanctions and by emo-tions of guilt and shame, which lead its followers to forego selfish benefits in the name of the group’s welfare. We argue that social norms may have an important influence on agents’ preferences, especially when it comes to their opinions and behaviors related to the tax system. If the prevalent social norm imposes a stigma on rent seekers, then the individual is likely to perceive the majority of her fellow citizens as honest and trustworthy. Utility maximizing taxpayers may want to support redistribution even when they are unlikely to benefit from it for at least three reasons (in addition to other-regarding concerns for fairness and solidarity): there are reduced risks of free riding, redistribution may support efficient forms of social insurance, and it lowers the exposure to negative feelings and criminal behaviors by the poor.
Hypothesis 1: social norm imposing a stigma on rent seekers increases in-dividuals’ preference for redistribution.
situations. They may be inherited from the family, or shaped by everyday experience about the others’ behaviors and beliefs. Non-rent seekers may advocate for redistribution due to reciprocity concerns, and may feel more confident in the fairness and honesty of their fellow citizens and of bureau-crats. They may also have altruistic concerns and a preference for income equality.
Hypothesis 2: individual norm stigmatizing rent seeking raises individuals’ preference for redistribution.
2
Data and methods
To analyze the effect of individual and social norms on preferences for redis-tribution, we used a section of data drawn from the 2004 wave of the SHIW, which is conducted every two years by the Bank of Italy3. The sample
in-cludes about 8,000 households and it is representative of the Italian popula-tion at the napopula-tional and region level (Bank of Italy, 2010). The sample was drawn in two stages (municipalities and households), with the stratification of the primary sampling units (municipalities) by region and demographic size. Within each stratum, the municipalities in which interviews would be conducted were selected to include all those with a population of more than 40,000 inhabitants (self-representing municipalities), while the smaller towns were selected on the basis of probability proportional to size (Bank of Italy, 2004). The individual households to be interviewed were then selected ran-domly. In the 2004 wave of the survey, a special section on public spirit and taxation was included in the questionnaire, in which respondents were asked to give their opinions on the tax system.
We followed Yamamura (2012) and used as dependent variable in the empirical analysis the 5 points-score given by respondents to the following statement: “The more someone earns, the more (in percentage) he/she should contribute to Government spending”, with 1 meaning “not at all” and 5 meaning “very much”.
To assess the individual attitudes toward rent seeking, we use the 10 points-score used by respondents to assess whether “Keeping money you ob-tained by accident when it would be possible to return it to the rightful owner
3
(for example, if you found a wallet with the owner’s name and address, or if you were given too much change at the supermarket check-out)” is justi-fiable or not. With 1 meaning “Never justijusti-fiable” and 10 meaning “Always justifiable”. We also computed and included in regressions the average value of the scores at the region level, in order to measure the trustworthiness of the people with whom respondents are more likely to interact.
Following seminal studies in the field (e.g. Knack and Keefer, 1997; Guiso et al., 2003), we believe that these items well capture individuals’ attitudes toward rent seeking and free riding. Opinions about the justifiability of keeping an accidentally retrieved wallet are a particularly reliable indicator of the propensity for free riding, as this scenario only deals with moral concerns and it can hardly be influenced by respondents’ risk aversion because there is no chance of being caught in the act.
The relationship between preferences for redistribution and individual and social norms (ind normsi and soc normsi respectively) about rent
seek-ing was investigated through an ordered probit model with robust standard errors reporting marginal effects. If the dependent variable is ordered in K categories, then the model for social interactions is:
Yi =
1 if yi ≤ 0,
2 if 0 < yi ≤ c1,
3 if c1 < yi ≤ c2,
...
K if cK−1 < yi.
(1)
where 0< c1 < c2 < . . . < cK−1;Yi =α+β1·ind normsi+β2·soc normsi+
θ·Xi+ǫi, ǫi ∼N(0,1); the indexi stands for individuals; cK−1 are unknown
parameters to be estimated, and θ is a vector of parameters for the vector
of control variables Xi. VectorXi includes:
• A measure of income inequality, which was identified by previous litera-ture as a major responsible of individuals’ preference for redistribution (Meltzer and Richard, 1981). Our indicator is the Gini index computed at the region level using SHIW data for 2004;
• An indicator of regional social capital given by the number of people who did unpaid work for volunteering associations in 2003 for every 100 people living in the same area (Istat, 2005);
• An indicator of regional religious participation, given by the percentage of the population who went to a place of worship in 2003 (Istat, 2005);
• The total income earned by respondents in 2004, obtained as the sum of: 1) the product between the average monthly net earnings (includ-ing overtime) and the number of months worked; 2) Any additional monthly salary (e.g. 13th month salary or Christmas bonus, 14th month salary, etc.); 3) Bonuses or special payments; 4) Other com-pensations (e.g. productivity bonuses, commissions, etc.);
• Age, sex, civil status, and education (four categories);
• Indicators of the regional share of households adopting precaution mea-sures to protect their homes against theft and vandalism (Istat, 2004). These measures include the habit of leaving the light on when away from home (labelled as “lights on” in the tables), the habit of asking neighbors to look after one’s homes when away (“neighbors”), the adop-tion of a watch dog to guard against unwanted or unexpected people (“dogs”), the purchase of a home safety system connected with a private vigilance service (“security”), the ownership of weapons for personal defence (“weapons”), the subscription of an insurance against theft (“insurance”), and the installation of a burglar alarm system (“burglar alarm”). A summary of descriptive statistics is reported in Table 1. The coefficients from equation 1 indicate the sign and magnitude of partial correlations among variables. However, attitudes toward rent seeking might be endogenous to preferences for redistribution. Individual effects such as personal characteristics or exogenous shocks may in fact be correlated with both individual norms about rent seeking and support for redistribution.
13
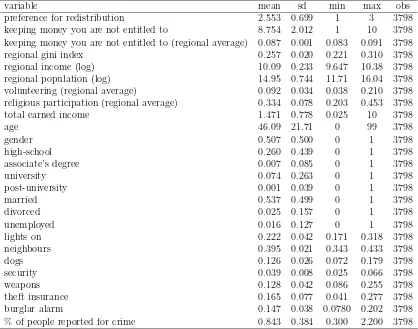
Table 1: Descriptive statistics.
variable mean sd min max obs
preference for redistribution 2.553 0.699 1 3 3798 keeping money you are not entitled to 8.754 2.012 1 10 3798 keeping money you are not entitled to (regional average) 0.087 0.001 0.083 0.091 3798 regional gini index 0.257 0.020 0.221 0.310 3798 regional income (log) 10.09 0.233 9.647 10.38 3798 regional population (log) 14.95 0.744 11.71 16.04 3798 volunteering (regional average) 0.092 0.034 0.038 0.210 3798 religious participation (regional average) 0.334 0.078 0.203 0.453 3798 total earned income 1.471 0.778 0.025 10 3798
age 46.09 21.71 0 99 3798
gender 0.507 0.500 0 1 3798
high-school 0.260 0.439 0 1 3798
associate’s degree 0.007 0.085 0 1 3798
university 0.074 0.263 0 1 3798
post-university 0.001 0.039 0 1 3798
married 0.537 0.499 0 1 3798
divorced 0.025 0.157 0 1 3798
unemployed 0.016 0.127 0 1 3798
lights on 0.222 0.042 0.171 0.318 3798
neighbours 0.395 0.021 0.343 0.433 3798
dogs 0.126 0.026 0.072 0.179 3798
security 0.039 0.008 0.025 0.066 3798
weapons 0.128 0.042 0.086 0.255 3798
theft insurance 0.165 0.077 0.041 0.277 3798
burglar alarm 0.147 0.038 0.0780 0.202 3798
To deal with these problems, we employed instrumental variables esti-mates using a two stage least squares (2SLS) model (Wooldridge, 2002) where, in the first stage, we instrumented our measures of the individual norms about rent seeking.
A reliable instrumental variable must meet at least two criteria. First, it must be theoretically justified and statistically correlated with the norms about rent seeking (“relevance” condition), after controlling for all other exogenous regressors. Second, it must be uncorrelated with the disturbance term of the equation determining individual preferences for redistribution (“orthogonality” condition).
We identified two econometrically convenient instruments in the crime rates registered in respondents’ area of residence. More specifically, we in-strument the individual stigma towards rent seeking with the rate of reported crimes for which a judicial procedure was started by the authorities, and with the rate of juvenile offenders who were reported for crimes for which a judicial procedure was started by the authorities in respondents’ area of residence.
Criminality may affect stigma towards rent seeking in a number of ways. People who live in an area were criminality is widely spread may consider keeping money obtained by accident (e.g. by retrieving a wallet on the floor) as a venial sin. On the other hand, the diffusion of criminality generally nurtures feelings of mistrust towards unknown others. So people may rea-sonably expect that the restitution of money obtained by accident would hardly be reciprocated, thus making the action of keeping it less despicable. In addition, higher crime rates also raise the likelihood that unknown others are delinquents, further reducing the incentive to return the money.
As for the orthogonality condition, it is reasonable to expect that, in areas with higher crime rates, citizens advocate for a stronger effort of public insti-tutions to fight criminality, which would question the validity of instruments. Public actions against crime, in fact, may require more public expenditure and eventually more redistribution. However, in the empirical analysis we controlled for a number of respondents’ actions to protect themselves against criminality, which capture citizens’ demand for safety – and the associated demand for redistribution – in a fairly precise way.
3
Results
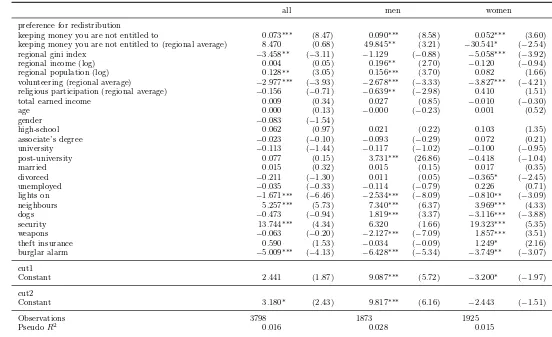
We first report, in Table 2, how the covariates correlate with the dependent variable. Preferences for redistribution are significantly and positively asso-ciated with respondents’ tolerance of rent seeking, as measured by the degree to which keeping money that was obtained by accident is considered justifi-able. This result is highly statistically significant for the whole sample (t = 8.83) and for both the subsamples of men (t = 8.51) and women (t = 4.12). For women, preference for redistribution shows a significant and negative association with the intensity of regional stigma towards rent seeking. This variable, however, is not statistically significant for men and for the whole sample.
Inconsistently with previous studies (e.g. Luttmer and Singhal, 2011), the economic variables – i.e. income, education, and work status – are not significantly correlated with preference for redistribution. This result may be explained by our ability to control for a number of economic and social characteristics of respondents’ area of residence, and, most importantly, for the diffusion of precaution measures against micro criminality. In particu-lar, regional social capital is significantly and negatively correlated with the dependent variable. In the sample of men, the regional level of religious participation also shows a significant and negative association with the de-pendent variable. Higher regional income inequality as measured by the Gini index, on the other hand, is associated with lower preference for redistribu-tion. This result is statistically significant for the whole sample and for the sample of women, but not for me, and requires further empirical investigation for a credible interpretation.
Table 2: Norms of rent seeking and preferences for redistribution. Ordered probit estimates.
all men women
preference for redistribution
keeping money you are not entitled to 0.073∗∗∗ (8.47) 0.090∗∗∗ (8.58) 0.052∗∗∗ (3.60)
keeping money you are not entitled to (regional average) 8.470 (0.68) 49.845∗∗ (3.21) −30.541∗ (
−2.54)
regional gini index −3.458∗∗ (−3.11) −1.129 (−0.88) −5.058∗∗∗ (−3.92)
regional income (log) 0.004 (0.05) 0.196∗∗ (2.70) −0.120 (−0.94)
regional population (log) 0.128∗∗ (3.05) 0.156∗∗∗ (3.70) 0.082 (1.66)
volunteering (regional average) −2.977∗∗∗ (−3.93) −2.678∗∗∗ (−3.33) −3.827∗∗∗ (−4.21)
religious participation (regional average) −0.156 (−0.71) −0.639∗∗ (−2.98) 0.410 (1.51)
total earned income 0.009 (0.34) 0.027 (0.85) −0.010 (−0.30)
age 0.000 (0.13) −0.000 (−0.23) 0.001 (0.52)
gender −0.083 (−1.54)
high-school 0.062 (0.97) 0.021 (0.22) 0.103 (1.35)
associate’s degree −0.023 (−0.10) −0.093 (−0.29) 0.072 (0.21)
university −0.113 (−1.44) −0.117 (−1.02) −0.100 (−0.95)
post-university 0.077 (0.15) 3.731∗∗∗ (26.86) −0.418 (−1.04)
married 0.015 (0.32) 0.015 (0.15) 0.017 (0.35)
divorced −0.211 (−1.30) 0.011 (0.05) −0.365∗ (−2.45)
unemployed −0.035 (−0.33) −0.114 (−0.79) 0.226 (0.71)
lights on −1.671∗∗∗ (−6.46) −2.534∗∗∗ (−8.09) −0.810∗∗ (−3.09)
neighbours 5.257∗∗∗ (5.73) 7.340∗∗∗ (6.37) 3.969∗∗∗ (4.33)
dogs −0.473 (−0.94) 1.819∗∗∗ (3.37) −3.116∗∗∗ (−3.88)
security 13.744∗∗∗ (4.34) 6.320 (1.66) 19.323∗∗∗ (5.35)
weapons −0.063 (−0.20) −2.127∗∗∗ (−7.09) 1.857∗∗∗ (3.51)
theft insurance 0.590 (1.53) −0.034 (−0.09) 1.249∗ (2.16)
burglar alarm −5.009∗∗∗ (−4.13) −6.428∗∗∗ (−5.34) −3.749∗∗ (−3.07)
cut1
Constant 2.441 (1.87) 9.087∗∗∗ (5.72) −3.200∗ (
−1.97)
cut2
Constant 3.180∗ (2.43) 9.817∗∗∗ (6.16) −2.443 (−1.51)
share of households owning a home safety system connected with a private vigilance service is positively related to individual preferences for redistribu-tion for men, women, and for the whole sample. The ownership of weapons for personal use is negatively correlated with men’s preference for redistribu-tion.
The positive association between the individual tolerance towards rent seeking and preference for redistribution is counter-intuitive and not ex-pected. Algan et al. (2014) suggested that rent seekers might be more airily favorable to redistribution as they also consider cheating on taxes as a feasi-ble option. The estimates presented in Tafeasi-ble 2, however, may be biased by omitted confounding factors, as explained in Section 2. For example, in areas historically affected by criminality and corruption, such as Italian Southern regions, people may feel rent seeking as the only possible way to effectively advance their interests. Redistribution entails higher levels of public expen-diture, which in turn may create higher opportunities for rent seeking. On the other hand, people who are less tolerant towards free riding may also feel more concerned about public finance adjustment and thus prefer less redistribution.
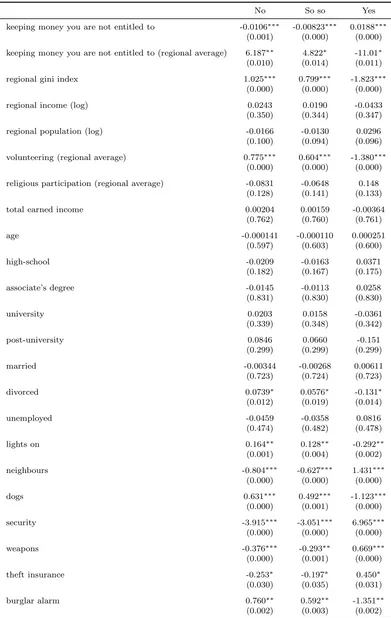
The main result of the ordered probit is challenged by the estimates obtained by instrumenting our main explanatory variable, which allow us to control for endogeneity bias. Coefficients are reported in Table 3 (where z-values are reported in brackets).
Individuals’ tolerance towards rent seeking is significantly (t= -4.58) and negatively correlated with preference for redistribution. Gender effects are presented in tables 4 and 5. The correlation seems to be stronger for women (t = -5.38) than for men (t = -1.84).
The regional level of tolerance is not statistically significant in the whole sample. However, interesting gender effects emerge when splitting the sam-ple: men who live in areas where free riding is more tolerated present a significantly higher preference for redistribution (t = 3.42). The opposite holds for women (t = -2.22).
18
Table 3: Norms of rent seeking and preferences for redistribution: marginal effects.
No So so Yes
keeping money you are not entitled to -0.0142∗∗∗ -0.0114∗∗∗ 0.0256∗∗∗
(0.000) (0.000) (0.000)
keeping money you are not entitled to (regional average) -1.660 -1.331 2.991
(0.500) (0.499) (0.499)
regional gini index 0.678∗∗ 0.544∗∗ -1.221∗∗
(0.002) (0.002) (0.002)
regional income (log) -0.000692 -0.000555 0.00125
(0.961) (0.961) (0.961)
regional population (log) -0.0251∗∗ -0.0201∗∗ 0.0452∗∗
(0.003) (0.002) (0.002)
volunteering (regional average) 0.583∗∗∗ 0.468∗∗∗ -1.051∗∗∗
(0.000) (0.000) (0.000)
religious participation (regional average) 0.0306 0.0245 -0.0551
(0.477) (0.471) (0.474)
total earned income -0.00179 -0.00144 0.00323
(0.735) (0.735) (0.735)
age -0.0000166 -0.0000133 0.0000299
(0.897) (0.897) (0.897)
gender 0.0162 0.0130 -0.0292
(0.123) (0.123) (0.122)
high-school -0.0121 -0.00967 0.0217
(0.331) (0.335) (0.333)
associate’s degree 0.00454 0.00364 -0.00818
(0.919) (0.919) (0.919)
university 0.0221 0.0177 -0.0399
(0.147) (0.155) (0.150)
post-university -0.0150 -0.0121 0.0271
(0.882) (0.882) (0.882)
married -0.00299 -0.00240 0.00538
(0.747) (0.748) (0.747)
divorced 0.0414 0.0332 -0.0746
(0.190) (0.196) (0.192)
unemployed 0.00678 0.00544 -0.0122
(0.741) (0.739) (0.740)
lights on 0.327∗∗∗ 0.263∗∗∗ -0.590∗∗∗
(0.000) (0.000) (0.000)
neighbours -1.030∗∗∗ -0.826∗∗∗ 1.857∗∗∗
(0.000) (0.000) (0.000)
dogs 0.0927 0.0744 -0.167
(0.344) (0.352) (0.347)
security -2.694∗∗∗ -2.160∗∗∗ 4.854∗∗∗
(0.000) (0.000) (0.000)
weapons 0.0123 0.00986 -0.0222
(0.844) (0.844) (0.844)
theft insurance -0.116 -0.0927 0.208
(0.123) (0.130) (0.126)
burglar alarm 0.982∗∗∗ 0.787∗∗∗ -1.769∗∗∗
depends on luck or having the right contacts in the right places. In this case, individuals may see redistribution by the public sector as the only possible way to reach decent standard of living in a society that does not offer equal opportunities to all or, as suggested by Algan et al. (2014), as a source of rent seeking opportunities.
This result may be interpreted as the legacy of a solid tradition of cor-ruption that has been plaguing the Italian public sector at least since the post-war period. Empirical studies on Italy suggest that a dramatic rise in corruption took place in the period between 1970 and 1993 (Marselli and Van-nini, 1997; Golden, 2000; Golden and Picci, 2005; Del Monte and Papagni, 2007; Felice, 2007)4.
The existence of a causal relationship between corruption and public ex-penditure has been repeatedly argued both in the academic and in the Ital-ian political debate (see for example Golden, 2000; Del Monte and Papagni, 2007). According to Golden (2000), the steep growth of government inter-vention in the economy that took place in the 1970s and the 1980s created new opportunities for corruption. On the other hand, public expenditure also rose due to the pressure of special interest groups on corrupted politi-cians. The interaction of these forces “produced a change toward a higher level of equilibrium of corruption” (Golden, 2000, p. 15). At the micro level, the vicious circle described by Golden probably exacerbated the feelings of mistrust towards public institutions and unknown others that, according to the literature, already were typical of the Italian society (see for example Putnam et al., 1993; Degli Antoni, 2006; Sabatini, 2009; Felice, 2013). In his seminal work on the moral basis of Italian backwardness, Banfield (1958) first introduced the concept of “amoral familism” to describe Southern Ital-ian households’ inability “to act together for their common good or, indeed, for any end transcending the immediate, material interest of the nuclear fam-ily” Banfield (1958, p.10). According to the author, social relationships in
4
20
Table 4: Norms of rent seeking and men’ preferences for redistribution: marginal effects.
No So so Yes
keeping money you are not entitled to -0.0106∗∗∗ -0.00823∗∗∗ 0.0188∗∗∗
(0.001) (0.000) (0.000)
keeping money you are not entitled to (regional average) 6.187∗∗ 4.822∗ -11.01∗
(0.010) (0.014) (0.011)
regional gini index 1.025∗∗∗ 0.799∗∗∗ -1.823∗∗∗
(0.000) (0.000) (0.000)
regional income (log) 0.0243 0.0190 -0.0433
(0.350) (0.344) (0.347)
regional population (log) -0.0166 -0.0130 0.0296
(0.100) (0.094) (0.096)
volunteering (regional average) 0.775∗∗∗ 0.604∗∗∗ -1.380∗∗∗
(0.000) (0.000) (0.000)
religious participation (regional average) -0.0831 -0.0648 0.148
(0.128) (0.141) (0.133)
total earned income 0.00204 0.00159 -0.00364
(0.762) (0.760) (0.761)
age -0.000141 -0.000110 0.000251
(0.597) (0.603) (0.600)
high-school -0.0209 -0.0163 0.0371
(0.182) (0.167) (0.175)
associate’s degree -0.0145 -0.0113 0.0258
(0.831) (0.830) (0.830)
university 0.0203 0.0158 -0.0361
(0.339) (0.348) (0.342)
post-university 0.0846 0.0660 -0.151
(0.299) (0.299) (0.299)
married -0.00344 -0.00268 0.00611
(0.723) (0.724) (0.723)
divorced 0.0739∗ 0.0576∗ -0.131∗
(0.012) (0.019) (0.014)
unemployed -0.0459 -0.0358 0.0816
(0.474) (0.482) (0.478)
lights on 0.164∗∗ 0.128∗∗ -0.292∗∗
(0.001) (0.004) (0.002)
neighbours -0.804∗∗∗ -0.627∗∗∗ 1.431∗∗∗
(0.000) (0.000) (0.000)
dogs 0.631∗∗∗ 0.492∗∗∗ -1.123∗∗∗
(0.000) (0.001) (0.000)
security -3.915∗∗∗ -3.051∗∗∗ 6.965∗∗∗
(0.000) (0.000) (0.000)
weapons -0.376∗∗∗ -0.293∗∗ 0.669∗∗∗
(0.000) (0.001) (0.000)
theft insurance -0.253∗ -0.197∗ 0.450∗
(0.030) (0.035) (0.031)
burglar alarm 0.760∗∗ 0.592∗∗ -1.351∗∗
the Italian Mezzogiorno were rooted in distrust, envy, and suspicion, to the point that fellow citizens generally would refuse to help each other except where one’s own particular material gain was at stake.
In this scenario, the rise in corruption and the country’s worsening eco-nomic situation, which resulted in the currency crisis that forced Italy out of the European Monetary System in 1992, may help explaining the positive correlation existing in our sample between preferences for redistribution and the regional level of people’s trustworthiness, as a result of two main factors. 1) The desire to improve equality in opportunities, to possibly counterbal-ance the effect of rent seeking and patronage in a society that is believed not to offer equal opportunities to all. 2) The strengthening of amoral familism, which leads individuals to see public expenditure as a source of rent seeking opportunities.
This result and its interpretation are in line with previous studies on the topic claiming that a lower confidence in self-determination is associated with a higher preference for redistribution (Piketty, 1995; Fong, 2001; Alesina and La Ferrara, 2005), and that, in a society characterized by low civic values, citizens may want to exploit the higher public expenditure connected with greater redistribution for their own rent seeking purposes, as suggested in Algan et al. (2014).
On the other hand, these effects seem not to hold for women, whose preference for redistribution decreases with the regional tolerance for rent seeking. This difference may be due to women’s greater concern for the rent seeking behaviours potentially connected with higher levels of public expenditure, which seems consistent with previous behavioral studies that found women to be more trustworthy and public-spirited than men. For example, as reported in Dollar et al. (2001), women have been found more likely to help others in need (Eagly and Crowley, 1986), to vote based on social issues (Goertzel, 1983), to score more highly on “integrity tests” (Ones and Viswesvaran, 1998), and to take stronger stances on ethical behaviour (Glover et al., 1997; Reiss and Mitra, 1998). Using a variety of independent data sources, Swamy et al. (2001) presented evidence that in hypothetical situations women are less likely to condone corruption, and that women managers are less involved in bribery.
inclined towards reciprocity. This result is consistent with previous claims about altruism as a major determinant of support for redistribution (Corneo and Gr¨uner, 2002; Dahlberg et al., 2012), and does not provide support to findings in Algan et al. (2014), according to which more civic individuals want less redistribution, probably because they are aware of the linkage be-tween government spending and taxation, and they are less inclined toward cheating on taxes. The size and significance of all the other covariates are confirmed in CMP estimates.
4
Conclusions
This paper shows that individual and social norms of tolerance of rent seek-ing are associated with preference for redistribution in a non-trivial way. Our findings challenge the mainstream assumption that individual attitudes about redistribution can satisfactorily be explained by the individual pecu-niary incentives involved. Preferences for redistribution are higher among citizens who report to be less tolerant towards rent seeking. These honest citizens would hardly consider exploiting redistribution to fraudulently gain personal advantages. Rather, their opinion about re-distributive issues seems to be linked to altruistic and moral concerns. On the other hand, living in an area where most citizens do not stigmatize rent seeking makes men more favorable to redistribution, that may be seen as a social equalizer in an unfair society that does not offer equal opportunities to all. This effect, however, does not hold for women, whose preference for redistribution is negatively associated to regional tolerance of rent seeking.
These results suffer from some weaknesses related to the unavailability of data. First, the cross-sectional nature of the analysis dictates caution in the interpretation of correlations as causal linkages. Second, we were not able to control for the local levels of social trust, which may play a role in shaping the relationship between citizens’ attitudes towards rent seeking and their vision of the re-distributive role of public policies. In addition, our proxies of preference for redistribution and attitudes towards rent seeking are definitely susceptible of improvement.
23
Table 5: Norms of rent seeking and women’ preferences for redistribution: marginal effects.
No So so Yes
keeping money you are not entitled to -0.0167∗∗∗ -0.0138∗∗∗ 0.0305∗∗∗
(0.000) (0.000) (0.000)
keeping money you are not entitled to (regional average) -9.287∗∗ -7.649∗∗ 16.94∗∗
(0.001) (0.002) (0.001)
regional gini index 0.210 0.173 -0.384
(0.380) (0.379) (0.379)
regional income (log) -0.0366∗∗ -0.0301∗∗ 0.0667∗∗
(0.006) (0.009) (0.007)
regional population (log) -0.0291∗∗∗ -0.0240∗∗∗ 0.0532∗∗∗
(0.000) (0.000) (0.000)
volunteering (regional average) 0.499∗∗∗ 0.411∗∗ -0.910∗∗∗
(0.001) (0.001) (0.001)
religious participation (regional average) 0.119∗∗ 0.0981∗∗ -0.217∗∗
(0.003) (0.003) (0.003)
total earned income -0.00497 -0.00409 0.00906
(0.402) (0.380) (0.392)
age 0.0000814 0.0000671 -0.000148
(0.818) (0.819) (0.818)
high-school -0.00400 -0.00329 0.00730
(0.827) (0.827) (0.827)
associate’s degree 0.0172 0.0142 -0.0314
(0.776) (0.774) (0.775)
university 0.0218 0.0180 -0.0398
(0.304) (0.306) (0.305)
post-university -0.695∗∗∗ -0.573∗∗∗ 1.268∗∗∗
(0.000) (0.000) (0.000)
married -0.00288 -0.00237 0.00526
(0.883) (0.883) (0.883)
divorced -0.00213 -0.00175 0.00388
(0.960) (0.960) (0.960)
unemployed 0.0213 0.0175 -0.0388
(0.430) (0.427) (0.429)
lights on 0.472∗∗∗ 0.389∗∗∗ -0.861∗∗∗
(0.000) (0.000) (0.000)
neighbours -1.368∗∗∗ -1.126∗∗∗ 2.494∗∗∗
(0.000) (0.000) (0.000)
dogs -0.339∗∗∗ -0.279∗∗∗ 0.618∗∗∗
(0.001) (0.001) (0.001)
security -1.177 -0.970 2.147
(0.100) (0.097) (0.098)
weapons 0.396∗∗∗ 0.326∗∗∗ -0.723∗∗∗
(0.000) (0.000) (0.000)
theft insurance 0.00637 0.00525 -0.0116
(0.926) (0.926) (0.926)
burglar alarm 1.198∗∗∗ 0.986∗∗∗ -2.184∗∗∗
References
Alesina, A. and Fuchs-Schuendeln, N. (2007). Good bye Lenin (or not?): The effect of Communism on people’s preferences. American Economic
Review, 97:1507–1528.
Alesina, A. and La Ferrara, E. (2005). Preferences for redistribution in the land of opportunities. Journal of Public Economics, 89:897– 931.
Algan, Y., Cahuc, P., and Sangnier, M. (2014). Trust and the welfare state: The twin peaks curve. Aix Marseille School of Economics Working paper, (WP2014-Nr24).
Antoci, A., Sabatini, F., and Sodini, M. (2012). The solaria syndrome: Social capital in a growing hyper-technological economy. Journal of Economic Behavior & Organization, 81(3):802–814.
Antoci, A., Sabatini, F., and Sodini, M. (2013). Economic growth, technolog-ical progress and social capital: the inverted u hypothesis.Metroeconomica, 64(3):401–431.
Banfield, E. C. (1958). The moral basis of a backward society. Free Press, New York.
Bank of Italy (2004). Supplement to the statistical bulletin. Rome. Bank of Italy (2010). Survey on household income and wealth. Rome. Becchetti, L., Pelloni, A., and Rossetti, F. (2008). Relational goods,
socia-bility and happiness. Kyklos, 61(3):343 – 363.
Bergh, A. and Bjørnskov, C. (2011). Historical levels of trust predict the current size of the welfare state. Kyklos, 64(1):1–19.
Bergh, A. and Bjørnskov, C. (2014). Trust, welfare states and income equal-ity: Sorting out the causality. European Journal of Political Economy. Berloffa, G. and Modena, F. (2012). Economic well-being in Italy: The role
Bigoni, M., Bortolotti, S., Casari, M., Gambetta, D., and Pancotto, F. (2013). Cooperation hidden frontiers: the behavioral foundations of the italian north-south divide. Universit`a di Bologna, Quaderni, (Working Paper DSE N. 882.).
Bjørnskov, C. and Svendsen, G. (2013). Does social trust determine the size of the welfare state? evidence using historical identification. Public Choice, (157):269–286.
Brandolini, A. (1999). The distribution of personal income in Post-War Italy: Source description, data quality, and the time pattern of income inequality.
Giornale degli Economisti, 58(2):183–239.
Brooks, C. and Brady, D. (1999). Income, economic voting, and long-term political change in the US, 1952–1996. Social Forces, 77(4):1339–1374. B´enabou, R. and Ok, E. A. (2001). Social mobility and the demand for
redistribution. Quarterly Journal of Economics, 116(2):447–487.
Corneo, G. and Gr¨uner, H. P. (2002). (2002). individual preferences for political redistribution. Journal of Public Economics, (83):83–107.
Dahlberg, M., Edmark, K., and Lundqvist, H. (2012). Ethnic diversity and preferences for redistribution. Journal of Political Economy, 120(1):41–76. Degli Antoni, G. (2006). Capitale sociale e crescita economica: una verifica empirica a livello regionale e provinciale. Rivista italiana degli economisti, (3):363–394.
Degli Antoni, G. and Sacconi, L. (2011). Modeling cognitive social capital and corporate social responsibility as preconditions for sustainable net-works of relations. In Sacconi, L. and Degli Antoni, G., editors, Social Capital, Corporate Social Responsibility, Economic Behavior and
Perfor-mance. Palgrave MacMillan.
Del Monte, A. and Papagni, E. (2007). The determinants of corruption in italy: Regional panel data analysis. European Journal of Political Econ-omy, 23(2):379–396.
Eagly, A. H. and Crowley, M. (1986). Gender and helping behavior: A meta-analytic review of the social psychological literature. Psychological bulletin, 100(3):283.
Felice, E. (2007). Divari regionali e intervento pubblico (1871-2001). Per una rilettura dello sviluppo in Italia. Il Mulino, Bologna.
Felice, E. (2012). Regional convergence in Italy, 1891–2001: testing human and social capital. Cliometrica, 6(3):267–306.
Felice, E. (2013). Perch´e il Sud `e rimasto indietro. Il Mulino, Bologna. Fong, C. (2001). Social preferences, self-interest, and the demand for
redis-tribution. Journal of Public Economics, 82:225–246.
Gelman, A. E., Shor, B., Bafumi, J., and Park, D. K. (2007). Rich state, poor state, red state, blue state: What’s the matter with connecticut?
Quarterly Journal of Political Science, 2(4):345–367.
Glover, S. H., Bumpus, M. A., Logan, J. E., and Ciesla, J. R. (1997). Re-examining the influence of individual values on ethical decision making. In
From the Universities to the Marketplace: The Business Ethics Journey,
pages 109–119. Springer.
Goertzel, T. G. (1983). That gender gap: Sex, family income, and political opinions in th early 1980’s. Journal of Political and Military Sociology, (11):209–22.
Golden, M. (2000). Political patronage, bureaucracy and corruption in post-war italy. UCLA.
Golden, M. A. and Picci, L. (2005). Proposal for a new measure of corruption, illustrated with italian data. Economics & Politics, 17(1):37–75.
Guiso, L., Sapienza, P., and Zingales, L. (2003). People’s opium? Religion and economic attitudes. Journal of monetary economics, 50(1):225–282. Istat (2004). La sicurezza dei cittadini. Reati, vittime, percezione della
si-curezza e sistemi di protezione. ISTAT Publishing, Rome.
Knack, S. and Keefer, P. (1997). Does social capital have an economic pay-off? a cross-country investigation. The Quarterly Journal of Economics, 112(4):1251–1288.
Kumlin, S. and Rothstein, S. (2005). Making and breaking social capi-tal the impact of welfare-state institutions. Comparative political studies, 38(4):339–365.
Luttmer, E. (2001). Group loyalty and the taste for redistribution. Journal of Political Economy, 109(3):500–528.
Luttmer, E. and Singhal, M. (2011). Culture, context, and the taste for redistribution. American Economic Journal: Economic Policy, (3):157– 179.
Marselli, R. and Vannini, M. (1997). Estimating a crime equation in the presence of organized crime: evidence from Italy. International Review of
Law and Economics, 17(1):89–113.
Meltzer, A. H. and Richard, S. F. (1981). A rational theory of the size of government. Journal of Political Economy, 89(5):914–927.
Moffitt, R., Ribar, D., and Wilhelm, M. (1998). The decline of welfare ben-efits in the US: the role of wage inequality. Journal of Public Economics, 68(3):421–452.
Moffitt, R. A. (1999). Explaining welfare reform: Public choice and the labor market. International Tax and Public Finance, 6(3):289–315.
OECD (2008). Growing Unequal? Income distribution and poverty in OECD
countries. OECD Publishing, Paris.
OECD (2011). Divided we stand. Why inequality keeps rising. OECD Pub-lishing, Paris.
Ones, D. S. and Viswesvaran, C. (1998). Gender, age, and race differences on overt integrity tests: Results across four large-scale job applicant datasets.
Journal of Applied Psychology, 83(1):35.
Piketty, T. (1995). Social mobility and redistributive politics. Quarterly
Powdthavee, N. and Oswald, A. J. (2014). Does money make people right-wing and inegalitarian? a longitudinal study of lottery winners. IZA Discussion Paper, (7934).
Putnam, R., Leonardi, L., and Nanetti, R. (1993). Making democracy work:
civic traditions in modern Italy. Princeton University Press, Princeton,
New Jersey.
Reiss, M. C. and Mitra, K. (1998). The effects of individual difference factors on the acceptability of ethical and unethical workplace behaviors. Journal of Business Ethics, 17(14):1581–1593.
Rothstein, B. (2002). Sweden. social capital in the social democratic state. the swedish model and civil society. In Putnam, R. D., editor,Democracies in Flux. Political Culture as a Condition for Democracy. Oxford University press, Oxford.
Sabatini, F. (2008). Social capital and the quality of economic development.
Kyklos, 61(3):466–499.
Sabatini, F. (2009). Social capital as social networks: a new framework for measurement and an empirical analysis of its determinants and conse-quences. Journal of Socio-Economics, 38(3):429–442.
Sabatini, F. and Sarracino, F. (2014). Will facebook save or destroy social capital?an empirical investigation into the effect of online interactions on trust and networks. GESIS Working Paper, (2014/30).
Stutzer, A. (2004). The role of income aspirations in individual happiness.
Journal of Economic Behavior and Organization, 54(1):89–109.
Swamy, A., Knack, S., Lee, Y., and Azfar, O. (2001). Gender and corruption.
Journal of Development Economics, 64(1):25–55.
Uphoff, N. (1999). Understanding social capital: Learning from the analysis and experience of participation. In Dasgupta, P. and Serageldin, I., editors,
Social Capital: A Multifaceted Perspective. The World Bank, Washington,
D.C.
Yamamura, E. (2011). The role of social trust in reducing long-term truancy and forming human capital in japan. Economics of Education Review, 30(2):380–389.
Yamamura, E. (2012). Social capital, household income, and preferences for income redistribution. European Journal of Political Economy, 28(4):498– 511.