http://www.scirp.org/journal/jcc
ISSN Online: 2327-5227 ISSN Print: 2327-5219
BigEar: Ubiquitous Wireless Low-Budget
Speech Capturing Interface
Stefano Gorla, Sara Comai, Andrea Masciadri, Fabio Salice
Department of Electronics, Information and Bioengineering of the Politecnico di Milano, Como, Italy
Abstract
This article presents BigEar, a wireless low-cost speech capturing interface that aims to realize unobtrusive and transparent context-aware vocal interaction for home automation. The speech recognition process implemented in BigEar system considers noise sources including possible holes in the reconstructed audio stream and tries to overcome them by means of inexactness toleration mechanisms to improve intelligibility of the reconstructed signal. Key contri-bution of this work is the use of extremely low cost devices to realize a mod-ular flexible and real-time wireless sensor network. On-field implementation and experiments show that the proposed solution can perform real-time speech reconstruction, while listening tests confirm the intelligibility of the recon-structed signal.
Keywords
Wireless Sensor Networks, Speech Capture, Degraded Speech Recognition, Ubiquitous Systems, Low Cost Architectures
1. Introduction
The ageing of world’s population will raise the demand and challenges of elderly care in coming years. Based on a study of the US census, the number of people aged over 65 will increase by 101 percent between 2000 and 2030, at a rate of 2.3 percent each year; during that same period, the number of family members who can provide support for them will increase by only 25 percent, at a rate of 0.8 percent each year. Several approaches have been devised to deal with the needs of older people proactively.
Assistive domotics represents a relatively recent effort in this direction addressing the needs of people with disability, older persons, and people with little or no technical affinity, and offers new levels of safety, security and comfort, and thereby the chance to prolong their safe staying at home.
How to cite this paper: Gorla, S., Comai, S., Masciadri, A. and Salice, F. (2017) BigEar: Ubiquitous Wireless Low-Budget Speech Capturing Interface. Journal of Computer and Communications, 5, 60-83.
https://doi.org/10.4236/jcc.2017.54005
Received: January 26, 2017 Accepted: March 11, 2017 Published: March 14, 2017
Copyright © 2017 by authors and Scientific Research Publishing Inc. This work is licensed under the Creative Commons Attribution International License (CC BY 4.0).
http://creativecommons.org/licenses/by/4.0/
61 The BRIDGe1 (Behaviour dRift compensation for autonomous InDependent
livinG) project [1], carried out at Politecnico di Milano-Polo di Como, aims to build strong connections between a person living independently at home and his/her social environment (family, caregivers, social services) by implementing a system that provides focused interventions according to the user’s needs.
BRIDGe addresses the needs of people with mild cognitive or physical impair- ments and, more generally, fragile people whose weakness threatens their auto- nomy, health or other important aspects of their life. Fragile people need mutual reassurance: they typically want to be independent and autonomous, but they also know that often somebody else must be present to help them.
BRIDGe’s core is a wireless sensor-actuator network that supports house con- trol and user behavior detection through a rich and flexible communication sys- tem between the person and his/her social environment, aiming at reassuring both the family and the user. BRIDGe is based on a modular architecture that can be easily configured to satisfy the single user needs, including: house control e.g., lighting and shutter control; home appliance monitoring for user activity recognition and energy consumption measurements purposes; presence detection, i.e. identifying the presence of people in specific areas of the house; indoor localization along with status (moving, sitting, falling, and so on); event- and status-based information transmission to inform caregivers promptly about specific events, such as when a fall is detected.
Target of this work is to model, realize and implement a distributed audio acqui- sition system called BigEar (uBiquitous wIreless low-budGet spEech cApturing inteRface) to support vocal interaction between the user and the assistive envi- ronment, for example, to vocally control some parts of a dwelling like lights, doors, etc. BigEar has been built according to the following Wireless Sensor Net- work [2] requirements:
The adopted technology (hardware and software) has to consider the econo- mical possibilities of people.
The absence of power and/or signal cables is a strong requirement in order to lower costs for house adaptation. Moreover, wireless systems can ensure a higher degree of flexibility and configurability than wired systems.
The key for pervasiveness is distributed computing [3], an interaction model in which the devices concur in building a result whose information content is more than the sum of single contributions. Moreover, sensors are completely independent and an eventual failure will not completely compromise the result of the sensor network collaboration.
The system should be implemented using a modular approach in order to be scalable and quickly configurable to match the environment characteristics and the user’s needs.
Speech recognition should be immediate, so speed of processing is a crucial requirement in order to give the user an immediate feedback; assistive domotic interaction has to be as fast as possible.
The proposed system consists of different modules that take into account the acquisition environment with its acoustic characteristics and the behavior of the sensor-network model. Such modules have been simulated to investigate the archiecture capabilities of the system. Then, a Reconstruction Algorithm recon- structing the audio signal starting from the audio packets received by the micro- phones has been developed.
This work is organized as follows: after a brief analysis of existent solutions in literature (Section 2), in Section 3 the architecture of BigEar system is described, focusing on the characterization of the context of use, on the features of the pro- totyping board, and on the communication protocol among the components of the system. Section 4 describes the speech acquisition model that has been simu- lated to define the working parameters before the realization of the system and the real-world implementation. Section 5 explains operating principles of the Big- Ear Reconstruction Algorithm, focusing on crucial aspects such as energy com- pensation, time-delay analysis and streams superposition. The audio data cap- tured by means of the real-world prototype have been compared with the ones generated by the simulated model, and results of this comparison are discussed in Section 6. Speed of processing and the quality of the reconstructed speech sig- nal are evaluated in Section 7. Finally, in Section 8 final remarks conclude the paper and look out over the future works.
2. Related Work
Different solutions have been proposed in the literature exploiting audio in smart homes, briefly described in the following subsections.
2.1. Sweet-Home Project
The Sweet-Home project [4] aims at designing a smart home system based on audio technology focusing on three main goals: to provide assistance via natural man-machineinteraction (voice and tactile command), to ease social e-inclusion, and to provide security reassurance by detecting situations of distress. The targeted smart environments are multi-room homes with one or more microphones per room set near the ceiling.
To show the results of the project, a smarthome was set up. It is a thirty square meters suite flat including a bathroom, a kitchen, a bedroom and a study; in order to acquire audio signals, seven microphones were set in the ceiling. All the microphones were connected to a dedicated PC embedding an 8-channel input audio card.
2.2. Wireless Sensor Networks for Voice Capture in
Ubiquitous Home Environments
The authors in Palafox and García-Macias [5] present a voice capture applica- tion using a wireless sensor network (WSN). The WSN nodes (each node is a MicaZ mote with a high sensitivity microphone) are grouped in clusters with a special node (cluster-head) coordinating the cluster activities in order to avoid to capture and transmit the same voice command by two or more nodes; the authors consider the command duplication unacceptable. Each cluster-head collects audio data from their cluster nodes and relays it to a base station. Each node con- tinuously senses audio signals at 2 kHz sampling frequency; if the sensed signal intensity exceeds a predetermined threshold, the node sends a notification to the cluster-head. The cluster-head selects a node to capture the command; the selected node enters into 8 kHz sampling frequency, captures three seconds of audio (with 8 bit resolution) and transfers the audio data to the cluster-head node which, in turn, relays it to the base station where a computer processes speech recog- nition tasks. The authors implement two capturing techniques: capture-and- send without coordination (consisting of human voice detection, three seconds of audio recording and transmission of the data packet to the cluster-head) and coordinate (consisting of human voice detection, node selection by the cluster- head, three seconds of audio recording and transmission of the data packet to the cluster-head). The main limit of this solution, beside having a quite high cost, is the sampling of three seconds instead of having a continuous voice detection and reconstruction. Our solution improves such limitation.
2.3. Exploiting WSN for Audio Surveillance Applications:
The VoWSN Approach
The work in Alesii etal.[6] focuses on the analysis of fundamental issues about the transmission of the voice using a wireless sensor network (WSN). The paper is based on the MicaZ wireless sensor nodes. The prototype of the system has been developed through the use of the CrossBow MicaZ-TinyOS_v1.5. and a PC has been used for listening and the analysis of recorded data. The work focuses on audio surveillance systems (i.e. continuous or event-driven audio monitoring tailored to voice signals that have to be archived and/or postprocessed) and on multi-point sampling to make proper signals (or noises) cancellations. BigEar nodes are based on Wixel prototyping boards, that allow to reduce significantly costs with respect of the solution implemented from the authors, that is based on MicaZ motes[7] [8].
2.4. Differentiating Emergency Voice Traffic in Indoor
Wireless Activity Monitoring Network
acoustic sensor was located close to the bed of the older person, to transmit short voice commands (e.g. need help, open the door etc.) for emergency attendance. The paper aims at experimenting a network which treats the voice data as emer- gency traffic and tries to achieve a certain Quality of Service. The system is only simulated considering the voice and activity data into two different Quality of Ser- vice classes: class 1 for voice and class 2 for activity data. The voice data segment (55 bytes) is periodically sent in every 3.57 ms and each voice command is repre- sented by 800 data segment while 55 byte activity data segment is periodically sent in every 2.7 s; they assume each captured voice command is digitized with a sampling rate of fs 8 KHz= and bit depth of 8-bit. The authors consider only a single voice source for detecting the user command; compared to this approach we use a set of microphones, which are contemporaneously active. In this way, BigEar solution implements a wireless unobtrusive network that takes advantage of the simultaneous multi-sensor acquisition to reconstruct the speech signal regardless of the position of the source with respect to the sensors.
2.5. The Research and Design on Time Division
Duplex (TDD) Voice WSN
Rong-lin etal.[10] present an architecture (including hardware architecture of voice node, routing node and gateway node) for Voice Wireless Sensor Net- works (VoWSN). The main goal of this paper is the quality of the transmitted voice; such an objective justifies both costs and the energy consumption of the presented hardware solution. The voice node includes a voice circuit (with signal amplifier, filtering, acquisition, quantization, encoding and decoding, A/D and D/A conversion), a digital signal processing circuit (with real-time voice digital signal processing including ADPCM encoding to reduce data rate), and a ZigBee module; the routing node includes only the ZigBee wireless communication module, while the gateway nodes includes the ZigBee communication module, the CDMA module, and an ARM processing circuit. The authors implement the time division duplex (TDD) method to achieve duplex voice communications; in particular, they use the same frequency but different time slots for data sending and receiving.
2.6. Blind Alignment of Asynchronously Recorded Signals
for Distributed Microphone Array
Moreover, it requires high bandwidth in order to transmit data between nodes. BigEar solution focuses on vocal signals and minimizes bandwidth requirements. As it will be discussed in following sections, our approach ensures a proper align- ment of audio streams generated by different sensors.
2.7. BigEar Approach
The approach proposed in this work tries to improve the current state of the art by providing a faster and flexible access to the transmission channel that allows a more widespread acquisition, based on a low cost solution. Among non functional requirements we have considered that house adaptation should be avoided to ensure high degree of modularity and configurability. Moreover, closed systems and dedicated hardware have been considered as second-best choices not only for their licensing costs, but mainly to keep high levels of flexibility.
3. BigEar Architecture
Figure 1 illustrates the architecture of the BigEar system. It is composed of a network of audiosensors that distributively capture audio in a room. The speech is sent to a mainreceiver (BigEar Receiver), acting as an interface that converts speech packets received via radio channel into serial data to be sent to the Base Station. The Base Station contains the application logic to handle speech packets. Since the audio sensors perform a space-time sampling of the audio inside a room, the application logic tries to reconstruct a good-quality speech stream starting from packets that arrive to the base station with different timestamps and with different physical characteristics. Indeed, each sensor samples the audio signal that reaches the microphone after undergoing variations due to the phy- sical model of the environment: different delays and amplitudes that depend on the position of the person with respect to the sensors, and reflections diffusions due to the geometry of the room and materials of the walls and furniture.
Granularity of space-time sampling is influenced by:
[image:6.595.211.540.536.711.2]• Number of audio sensors w.r.t the dimensions of the room: the bigger is the
number of sensors spread in the room, the finer is the granularity of space sampling.
• Audio sensor internal characteristics and constraints: each sensor needs time in order to sample data (depending on ADC type), store them into buffers and send them to the main receiver.
• Network communication protocol characteristics and constraints: the num- ber of packets sent to the main receiver is affected by the number of collisions that may happen on the channel and also by the protocols themselves (hand- shaking, request-response timings, timeslot allocations).
3.1. BigEar Audio Sensors
The leaf nodes of the architecture are represented by the audio sensors, that are built using Wixel Programmable USB Wireless Modules, general-purpose boards featuring a 2.4 GHz radio and USB port. The Wixel is designed around the CC2511F32 System-on-Chip (SoC) from Texas Instruments, which has an integrated radio transceiver, 32 KB of flash memory, 4 KB of RAM, and a full- speed USB interface.
Wixel’s ADC is connected to a simple signal acquisition and conditioning stage that captures audio signals. ADC resolution represents an important de- sign choice: the higher is the resolution, the lower is the quantization error. On the one hand, low resolutions allow high sampling frequency and so a higher temporal resolution with the drawback of a lower number of quantization levels; on the other hand, high resolutions reduce quantization error granularity. This is an important key factor in signal post-processing.
3.2. BigEar Receiver
The only task of the BigEar Receiver is to act as a Radio-to-USB interface (and vice versa) between BigEar Audio Sensors and the Base Station. It mainly re- ceives radio packets from the sensors, transforms them into hexadecimal nibbles and sends them to the Base Station via the USB port. When the Base Station needs to send commands to the sensors (or to reply to protocol messages), Big- Ear Receiver receives hexadecimal nibbles through the USB port, converts them into bytes and sends them using the built-in radio module. Like BigEar Audio Sensors, also the BigEar Receiver is based on a Wixel Programmable Module.
CC2511F32 SoC has been programmed in order to handle up to 256 different radio channels [12]. All the sensors share the same channel used by the BigEar Receiver; if the network architecture requires channels separation (e.g., to reduce the number of collisions), a second BigEar Receiver connected to another USB port of the Base Station is needed.
3.3. Base Station
Base Station and the wireless audio sensors.
The Base Station receives radio packets containing each one a set of bufferized audio samples tagged with a timestamp and the sensor ID; for each sensor, audio samples are arranged according to their timestamp. In this way, for each sensor a coherent but incomplete stream is obtained: indeed, audio samples are in the right time position with respect to the sensor timestamp, but there is no guarantee that the transmission time is less than, or at most equal to, the sampling time.
Once the samples have been sorted by their timestamps, the application performs a time delaying-or-advance of the audio streams coming from the sen- sors in order to remove the delays caused by the different distances between the mouth of the user and the sensors. Therefore, in-phase audio contributions are obtained; they can be summed each other in order to produce a seamless stream. During the alignment process the different energy contribution of the sensors are considered: the closer is the sensor to the user, the bigger will be the signal amplitude and vice versa.
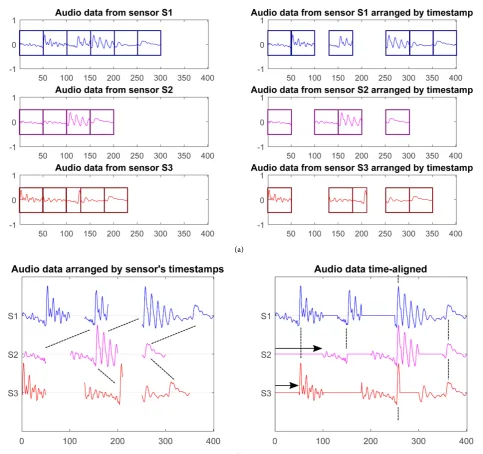
Figure 2 summarizes the Speech Reconstruction Logic carried out by the Base Station: in the left plot in Figure 2(a), audio packets can be seen as received from the Base Station. Then, the Base Station exploits timestamp information carried by each audio packet to arrange audio samples onto the sensor’s timeline (right plot in Figure 2(a)). Figure 2(b) illustrates the operating principles of cross-correlation analysis that allows the Base Station to obtain the in-phase contributions that will be superposed to generate a unique, coherent and inte- lligible speech signal.
3.4. Network Protocols
Network protocols have a big impact on the efficiency of the whole system: colli- sions, granularity of the network of sensors and presence of protocol messages can affect the number of audio packets transmitted and received successfully.
In general, when the granularity of the network increases, also the likelihood of collisions grows. At the same time, the number of service messages to imple- ment synchronization mechanisms have to be increased in order to reduce the number of collisions. This can be done at the expense of the channel availability and software complexity.
The simplest protocol that can be adopted in this scenario is ALOHA [13]. Our application has been tested using the pure ALOHA protocol (without acknowledge) in order to exploit and examine system capabilities with the sim- plest communication protocol.
4. Speech Acquisition Model and Implementation
(a)
(b)
Figure 2. Base station reconstruction logic. (a) Audio packets arranged w.r.t. their timestamp; (b) Audio packets are aligned exploiting cross-correlation between signals.
block performs the reconstruction of the speech signal.
While the first three blocks concerning the behavior of the sensor-receiver network have been simulated, the Speech Reconstruction block has been imple- mented and its prototype will be described and discussed in Section 5.
4.1. Audio Model
[image:9.595.58.542.66.520.2]Figure 3. Architecture model.
the acoustics characteristics of the room and on the position of the sensor with respect to the source.
In order to create an audio model of the typical use case, we made some assumptions about the typical environment where the system may work. The room is modeled as a parallelepiped represented by a three-dimensional space bounded by six surfaces (four walls, ceiling and floor). Each room surface has its own absorption and scattering (diffusion) coefficients. Sound scattering due to furniture and other objects in the room can be approximated by higher levels of overall room diffuseness. Audio modeling is performed by means of MCRoom- Sim multichannel acoustics MATLAB simulator [14].
4.2. Sensor Network Model
This module recreates a realistic simulation of the behavior of the network where each sensor samples audio signals, buffers them into packets of a specific size and sends them according to a network communication logic. The module is internally split in two parts: the RadioTransmissionmodel, that implements the communication protocol including possible interactions between a receiver and the transmitters or between transmitters, and the N-buffer model, that carries out the internal buffer mechanism of each transmitter.
The Sensor Network module receives in input the audio streams generated by the audio simulator described in Section 4.1, and provides as output the packets of audio sampled and transmitted by each sensor.
tween 0 and a maximum value Tmax Delay.
The model also checks for collisions. Given the time instant t( )i j, in which the th
j transmitter starts to transmit the ith packet, and called tbusy the du-
ration of the transmission, all the transmissions started in the interval ( )i j, busy, ( )i j, busy
t t t t
− +
, where tbusy are marked as colliding.
[image:11.595.209.536.632.714.2]N-Buffer model This block implements the buffering system internal to each transmitter. In a real world, data are continuously sampled and buffered by each transmitter in order to be ready to send them when needed; during the simu- lation, instead, the time instants in which transmission occurs are known, but we need to model the buffering structures to know which data are ready for being transmitted. This block produces in output the audio samples packed as if they were coming from real transmitters. The structure of each packet is described in Figure 4: each packet contains the ID of the transmitter, the timestamp of the first sample of the packet and a number of samples that correspond to the frame size of each buffer. Only the timestamp of the first sample is sent, since the timestamps of other samples can be inferred by adding τ =i i Fs, where i is
the (0-based) index of th
i sample in the packet and Fs is the sampling
frequency.
Multiple buffering allows the sensor to work simultaneously on read and write sides: a periodical interrupt routine acquires the signal and stores samples into the writeframe, while the main loop can read from the readframe for the trans- mission.
4.3. Real-World Implementation
The three modules described so far compose the virtual model that has been used in order to define the working parameters before the realization of the proto- types. In the real world, the system is composed of a set of audio sensors that perform a space-time sampling of a room. Before sampling, the audio signal con- verted by each microphone capsule has to be amplified and biased in order to match to ADC characteristics. Each audio sensor samples the signal and packs data into frames in order to send them to the receiver. The multi-buffer internal structure of each transmitter allows an efficient application logic where the sampling stage is managed by means of a timer-handled interrupt routine, and the network logic is handled by the main loop of the applications. Network struc- ture can be layered onto several radio channels in order to reduce the number of collisions. A separate BigEar Receiver is needed for each radio channel.
Once the packets arrive to the BigEar receiver, they are converted into he- xadecimal nibbles and serially sent to the Base Station by means of the USB port. The Base Station, in its experimental form, is composed of a pipelined appli- cation that listens to each BigEar Receiver connected to the USB ports of the ma- chine, receives audio packets and stores them into an ordered sequence of files that are processed by means of a MATLAB script that reconstructs the audio da- ta using the reconstruction principles described in Section 5.
5. Speech Reconstruction
This section illustrates how audio packets are processed in order to produce the best speech signal in terms of intelligibility.
Starting point of the Speech Reconstruction is constituted by the audio packets received by the Base Station from each audio sensor. Due to sound pro- pagation laws, the closer is the sensor to the source, the higher will be the power of captured audio signal; so, in order to preserve energy of the reconstructed signal, audio packets are unbiased and normalized. Then, audio samples are arranged using timestamp information contained in each packet (as already illu- strated in Figure 4).
Delays introduced by the different distances between the source and the audio sensors (the closer is the sensor to the source, the lower will be the time of arri- val of pressure wave to the microphone) are compensated in the streams align- ment stage using cross-correlation analysis.
When the signals have been properly aligned they can be superposed with se- veral summing or replacing methods in order to preserve the signal energy and not to introduce energy variations due to the different number of contributions that are summed at the same time.
The flowchart in Figure 5 illustrates the operation performed by the Speech Reconstruction module; they are described in the next subsections.
5.1. Energy Compensation
Audio packets have to be processed in terms of energy compensation to prevent distortions. In particular, the following steps are performed:
• Bias removal, in order to eliminate possible incorrect polarization of the input stage.
• Normalization of input signals, to remove the amplitude attenuation due to the different distances between the speech source and the sensors.
5.1.1. Bias Removal
Figure 5. Flowchart of the signal reconstruction block.
speech signal, as illustrated in Figure 6.
( ) ( ) ( ) ( ) ( )
,
, , , ,
1
, N
i j
i j i j i j i j
k
a
a a a a
N
=
= − = −
∑
(1)where N is the number of sensors.
5.1.2. Normalization
Figure 6. The image shows the effect of the acquisition of the same signal by means of different sensors, each one characterized by a different DC bias.
( ) ( )
( )
(
)
, ,
, 1
1, . max
i j i j
k j k N
a
a j N
a
≤ ≤
= ∀ ∈ (2)
5.2. Audio Packets Arrangement
The second step of Speech Reconstruction is the arrangement of audio packets. Audio samples are extracted from each packet and get ready for processing using two matrices: and , where each element a( )i j, ∈ represents the
th
i
sample transmitted by the th
j sensor and the corresponding element p( )i j, ∈ represents the position of the audio sample in the stream expressed in discrete- time units:
( )i j, s
(
( )i j, min( )j)
where min( )j minj j( )
( )i j, .p F t t t t
=
= ⋅ − = (3)
Using position information, audio samples are correctly spaced on the sen- sor’s timeline. For each sensor j:1< ≤j N, a vector yj of samples is created:
( )
( )
, ( ), .j i j i j
y p =a (4)
The elements in yj where no audio samples are present are 0-filled.
5.3. Streams Alignment
reduce the delay due to the distance of the speech source with respect to the position of the sensors. The alignment is obtained by using the cross-correlation function [15]. In order to apply it efficiently, the audio streams are processed according to their informative contribution: they are sorted by their normalized power in descending order to allow the cross-correlation algorithm to work in the best condition.
Cross-correlation is a measure of similarity of two series as a function of the lag of the one relative to the other. For two generic discrete functions f m
[ ]
and g m
[ ]
, cross-correlation measure is defined as:[ ]
(
)
[ ]
*[ ] [
]
,
fg
m
R n f g n f m g m n
+∞
=−∞
=
∑
+ (5)where *
f denotes the complex conjugate of f . The equation essentially slides
the g function along the x-axis, and calculates the integral of their product at
each position. When the functions match, the value of
(
f g)
is maximized.Thus, applying cross-correlation to the streams yi and yj generated by two
different sensors i and j means to find the delay n (expressed in number
of samples) that should be applied to yj to obtain the best in-phase super-
position with yi.
Envelopes Cross-Correlation
A drawback of Cross-correlation function is the inability in discriminating be- tween the true signal and noise or holes.
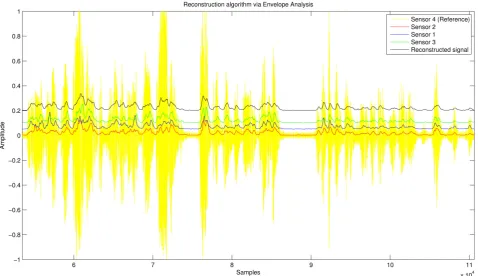
Cross-correlation function operates on signals that, for their origin, are noisy and holey. If holes and noise are negligible, cross-correlation gives expected results; if sequence of zeros (holes) are much bigger than the signal itself, or if the signal is subject to particular types of noises such as impulse trains, the Cross-correlation function would produce wrong results. To overcome this pro- blem, instead of applying Cross-correlation function directly on noisy or holey signals, it has been applied to the positiveenvelopes of the signals themselves. A positive envelope is a particular representation of a signal that evidences the shape of the signal. Figure 7 illustrates the result of the alignment step of the envelopes. On the image, for the sake of readability, envelopes of the streams coming from different sensor have been shifted along y-axis. It can be noted that peaks and valley of the signals are globally aligned. This alignment technique offers higher robustness with highly noisy or highly depleted streams, although the effort for a better alignment could be frustrated from the lower intelligibility of the speech signal.
5.4. Streams Superposition
Figure 7. Cross-correlation analysis and alignment on signal’s envelopes.
5.4.1. Weighted Sum of Contributions
Contribution coming from different sensors are summed and scaled to prevent amplitude artifacts. Given y( )i j, the
th
i sample of the audio stream coming
from th
j sensor and w i
( )
the number of sensors that contribute to the ithsample, the th
i sample of the resulting stream ysum is given by:
( )
1( )
( )
,sum .
N i j j
y
y i
w i
=
=
∑
(6)Weighted Sum is needed for energy preservation and for avoiding harmonic distortions due to the summation of contributions. Figure 8 illustrates an example of distortion caused by the sum of multiple contributions without weighting.
5.4.2. Holes Replacement
Weighted Sum of Contribution presents some drawbacks: it does not take into account the big differences in the spectrum of signals and in the environment contributions between sensors located in different places. Each BigEar Audio Sensor is subject to an environment contribution that depends on:
• The distance between the sensors and the speech source; • The position of the sensors in the environment.
Figure 8. Harmonic distortion due to unweighted sum of contributions.
For this reason, an alternative superposition policy has been tested: instead of performing a weighted sum of each contribution, only the holes in the most powerful audio stream are filled with contributions coming from other sensors. This method reduces the number of summation artifacts, provided that the re- ference signal (the one on which the holes will be replaced with samples coming from other sensors) has the higher number of valid samples, otherwise there is the risk that replacingartifacts will become prominent with respect to summing artifacts. A comparison metric between Weighted Sum and Holes Replacement will be discussed in Section 7.2.
6. BigEar Simulation and Model Validation
Once the system has been implemented and the prototype realized, some metrics have been defined to compare the data captured by means of the BigEar pro- totype and the data obtained by means of the BigEar simulated model described in Section 4.
This Section focuses on the quality of reconstructed signal analyzing amount of overlapping data between the stream generated by each sensor, while Section 7 illustrates system capabilities in terms of speed of processing and outlines qua- litative aspects of the reconstructed speech.
6.1. Metrics Definition
reconstructed signal. Moreover, the BigEar Reconstruction algorithm conver- gence is influenced by the amount of information that can be overlapped for the Cross-correlation alignment. The following metrics are therefore defined:
(
)
No of samples
_ where Length of the stream in samples .
Fill ratio N
N
⋅
= =
Referring to the reconstructed signal, it represents the amount of samples with respect to the total length of the stream. The more the value is close to 1, the more the reconstructed signal is complete.
Normalized number of 0 sequences
NoH = −ed
Average size of 0 sequences.
SoH= −ed
Since reconstructed signal is given by the superposition of audio packets sampled by different sensors at random time instants, it can be affected by se- quences of emptysamples. In conjunction with NoH , SoH characterizes the
distribution of empty samples (holes) into the reconstructed signal. In case of constant Fill_ratio, SoH and SoH allow to compare whether empty
samples are gathered into few big blocks or are diffused into many small blocks. Average number of contributor per sample.
Sf =
Sf gives a measure of the contribution of each single transmitter to the
construction of the final speech signal. Sf ∈
(
0,NTX]
where NTX is the num-ber of transmitters. The higher Sf, the higher the overlapping of the streams
obtained by the different transmitters.
6.2. Simulation Setup
Simulations have been performed using the BigEar Simulator described in Sec- tion 4 in a MATLAB 2015b environment [16] using McRoomSim v. 2.14 [14] and varying some parameters in order to study system behavior under different con- figurations. The parameters that have been changed are: the number of sensors, their positions in the room, the radio channel configuration (how many trans- mitters communicating on the same radio channel), and the maximum delay be- tween adjacent transmission of the same transmitter.
From these simulations, Statistic data and Metrics have been calculated according to Section 6.1. These data will be compared with real data obtained from On-field setup (Subsection 6.3) and discussed in Section 6.4.
6.3. On-Field Setup
Near-field Tests During Near-field tests, the consistence between the simulated model and the real world has been probed. In this setup, BigEar Audio Capture boards were placed side by side on a plane surface, and the speaker has been asked to talk at a distance of about 0.6 m far from the microphones. Then data have been captured using different configurations:
the same channel (e.g. AAB means two transmitters on radio channel A and one transmitter on radio channel B):
-One transmitter: A. -Two transmitters: AA-AB. -Three transmitters: AAA-AAB.
-Four transmitters: AAAA-AAAB-AABB.
• Maximum delay between adjacent transmissions from the same transmitter
(Tmax Delay parameter): 1-3-7-15-31-63 ms.
Far-field Tests During Far-field tests, the focus has shifted on the Reconstruc- tion Algorithm. This is a test stage close to real situation since BigEar Audio Cap- ture boards have been fixed to poles 1.60 m high from ground level and have been placed in a medium-size room. The talker has been asked to speak from an asym- metric position to examine the signal power differences between the different streams.
Figure 9 shows the obtained plots; black asterisks mark real values obtained from the prototypes, while lines indicate the simulated ones. By varying the
max Delay
T parameter and the number of transmitters, the obtained curves are
asymptotic. Differences are notable when Tmax Delay∈
{
1, 3, 7}
, i.e., when the ave-rage distance between adjacent transmissions of the same transmitter are com- parable with the duration of a frame of samples
( _ _ _ 20 1 = 3.31 ms
6040 Hz
samples per frame sampling⋅ period= × ).
This difference is due to the modular structure of the BigEar Simulator: the N-buffer Internal model (Section 4.2) does not communicate to its predecessor - the Radio Transmission model (Section 4.2)-any information about the buffer status. In the real world, if the buffer is empty, no transmission happens; instead, the Radio Model makes no considerations on the buffer status, with the result that virtual transmitters that have no data to transmit also contribute to the sa- turation of the audio channel and then to the valid packet loss.
Looking at Fill_ratio, it can be observed that in most cases the real
_
Fill ratio is slightly higher than the simulated Fill_ratio. The motivation is
due to the fact that the model adopts Tbusy = 1 ms as duration of the transmission,
while for the prototype the measured duration of a transmission is 0.937 ms. In general, the increase of the number of transmitters leads to an increment of the overlap between sampled data, while the increase of the used radio channel leads to the reduction of the collisions between packets traveling on the same channel. By comparing Figure 9(a) with Figure 9(b) it can be observed that doubling the number of transmitters and working on 2 channels instead of 1, a big increment in Fill_ratio and in Sf (support factor) are obtained, thus
improving the quality of signal (in term of size of holes) and the support factor, i.e. the quantity of overlapped samples between the streams.
7. Experimental Results and Evaluation
(a)
[image:20.595.61.537.68.372.2](b)
Figure 9. Metrics of thereconstructed signal plotted as a function of Tmax Delay parameter. (a) Test case: 2 transmitters on the same
channel (AA); (b) Test case: 4 transmitters on the two channels (AABB).
system and the accuracy of the speech recognition process.
7.1. Speed of Processing Evaluation
System reactivity can be considered as the system’s ability to interact with the user in real-time, i.e. to perform an action as soon as possible. Due to the modular archi- tecture of the system, the reactivity can be analyzed from different points of view.
Clock Tests During the implementation of the hardware part of the BigEar prototype, the timer stability have been verified since one of the crucial points of the application is that every BigEar Audio Capture board samples the analog sig- nal at the right sampling frequency Fs. Moreover, it is important to observe that
the N-Buffer mechanism works perfectly in order to avoid corrupted data that could generate unattended behaviors in the reconstruction step. All the tests con- firmed the clock stability.
Speed of Speech Reconstruction Algorithm The speed of the Speech Recon- struction Algorithm can be expressed as the ratio of the length of the considered audio segment ∆Trec over the duration of the elaboration process ∆Telab. This
metric, called Realtime Performance Ratio (RPR), is defined as:
(
)
rec
elab elab
1 length of reconstructed signal
RPR T Fs .
T T
⋅ ∆
= =
This measure depends on the number of transmitters, since with a higher number of transmitters, there is also a higher data flow. So the metric can be used as a global trade-off parameter: RPR>1 states that the whole system is able to buffer, send and process data faster than sampling. For each test case discussed in Section 10, RPR has been measured. For all the tests RPR1, i.e. the processing speed of the BigEar Reconstruction Algorithm is faster than the sampling speed.
7.2. Reconstruction Quality Metric
During Far field tests, the speech signal was reconstructed using both Weighted Sum method (Section 5.4.1) and Holes Replacement method. Listening tests have denoted big differences in reconstructed speech signal depending on the superposition policy adopted. As explained in Section 5.4.2, the higher the dis- tances between BigEar Audio Capture boards, the higher the differences in the audio signals due to different environment reflections and diffusions. These di- fferences cause discontinuity artifacts in the reconstructed signal at the positions where different contributions are superposed in the attempt to fill the holes in the reconstructed signal (described in Section 5).
In order to examine how superposition methods could affect the presence of artifacts, Potential Artifact Ratio metric counts the number of positions where artifacts could be generated and normalizes it with respect to the length of the signal, obtaining thus a comparable metric.
1 edges , TX N k ws k A N = =
∑
where edgesk = ⋅2 NoHk and NoHk =no of holes in the stream producedby⋅
th
k sensor.
(
)
1
edges edges
,
TX h k
N k k hr k A N < = − =
∑
where th
edgesh kk edges in the k
< = stream covered by samples of previous
streams.
Since number of potential artifacts is dependent on the chosen superposition policy, two different calculation methods are needed: Aws is the metric used for
Weighted Sum reconstruction and Ahr is the one used for Holes Replacement
method.
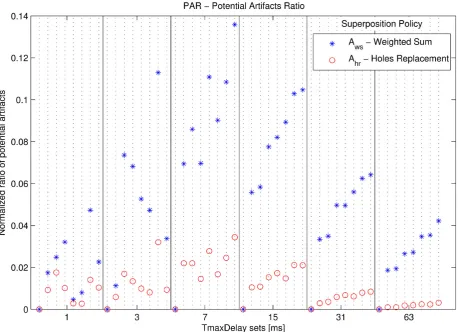
Figure 10 shows that for each TmaxDelay set, Weighted Sum method (whose Artifact Ratio is denoted with Aws) is more prone to artifacts creation than
Holes Replacement method. Moreover, as expected, Potential Artifacts Ratio grows with the number of transmitters that compose the system, in particular when multiple transmitters operate on multiple channel: since there is high overlapping between audio packets, Weighted Sum has more data to superpose.
Figure 10. Potential Artifacts Ratio plotted for different test cases, divided by TmaxDelay sets.
8. Conclusions and Future Works
In this paper, we have presented an application based on a distributed wireless sensor network that performs a space-timeaudiosampling of an environment. It is based on the low cost technology, i.e. on Wixel Prototyping boards, whose cost is around 20 $ each one; cost for speech acquisition circuit is under 10 $ per board2.
82
removing sensors from the sensor network.
Results show that the BigEar Reconstructor algorithm can perform real-time speech reconstruction, and listening tests confirm the intelligibility of the recon- structed signal.
As future work, we plan to improve the BigEar Reconstruction Algorithm to properly feed GSR by filtering only vocal commands. Some experiments have shown that the differential information of power and delay of the signals acquired by the sensors can be used to make a coarse-grain localization of the source. Further studies will lead to a significant increase in localization accuracy to asso- ciate each keyword to a spatial information. In order to neutralize effects of su- perposition artifacts, filtering or far-field speech processing methods can be integrated into the BigEar Reconstructor algorithm; moreover, periodical training stages can be adopted for identifying physical and spectral characteristics of the ambient noise. Finally, the Network Interaction Model could be extended to other network protocols than pure ALOHA family in order to explore how Re- constructed Signal Metrics are influenced by different Network Interactions. In particular, different Network Protocols might help in reducing superposition artifacts; furthermore, Network Protocol could include synchronization me- chanisms to prevent sensor clock drift.
References
[1] Mangano, S., Saidinejad, H., Veronese, F., Comai, S., Matteucci, M. and Salice, F. (2015) Bridge: Mutual Reassurance for Autonomous and Independent Living.IEEE IntelligentSystems, 30, 31-38. https://doi.org/10.1109/MIS.2015.58
[2] Akyildiz, I.F., Su, W., Sankarasubramaniam, Y. and Cayirci, E. (2002) Wireless Sen- sor Networks: A Survey. ComputerNetworks, 38, 393-422.
[3] Coulouris, G., Dollimore, J., Kindberg, T. and Blair, G. (2011) Distributed Systems: Concepts and Design. 5th Edition, Pearson Education, London.
[4] Lecouteux, B., Vacher, M. and Portet, F. (2011) Distant Speech Recognition in a Smart Home: Comparison of Several Multisource ASRs in Realistic Conditions. In-terspeech 2011, International Speech Communication Association, Florence, Au-gust 2011, 2273-2276. https://hal.archives-ouvertes.fr/hal-00642306
[5] Palafox, L.E. and Garcia-Macias, J.A. (2009) Wireless Sensor Networks for Voice Capture in Ubiquitous Home Environments. 4th International Symposium on WirelessPervasiveComputing, Melbourne, 11-13 February 2009, 1-5.
https://doi.org/10.1109/iswpc.2009.4800614
[6] Alesii, R., Gargano, G., Graziosi, F., Pomante, L. and Rinaldi, C. (2009) WSN-Based Audio Surveillance Systems. In:Mastorakis, N., Mladenov, V. and Kontargyri, V.T., Eds., ProceedingsoftheEuropeanComputingConference, Springer US, 675-681.
https://doi.org/10.1007/978-0-387-84814-3_67
[7] Ciuca, D., Pomante, L. and Rinaldi, C. (2012) A Speech Indicator for the VoWSN Approach. 5th InternationalSymposium onCommunicationsControl andSignal Processing, Rome, 2-4 May 2012, 1-4. https://doi.org/10.1109/isccsp.2012.6217759
[8] Pomante, L. and Santic, M. (2016) Methodologies, Tools and Technologies for Lo-cation-Aware AAL. IEEE 2ndInternationalForumonResearch andTechnologies forSocietyandIndustryLeveragingaBetterTomorrow (RTSI), Bologna, 7-9
tember 2016, 1-4. https://doi.org/10.1109/RTSI.2016.7740566
[9] Demir, A.K., Turkes, O. and Baydere, S. (2014) Differentiating Emergency Voice Traffic in Indoor Wireless Activity Monitoring Network. IEEE 10thInternational ConferenceonWirelessandMobileComputing, NetworkingandCommunications
(WiMob), Larnaca, 8-10 October 2014, 598-603.
https://doi.org/10.1109/wimob.2014.6962231
[10] Hu, R.-L., Yin, J.-R., Gu, X.-J., Gu, X.-P. and Chen, L.-Q. (2010) The Research and Design on TDD Voice WSN. 2010 InternationalConferenceonMultimedia Tech-nology (ICMT), Ningbo, 29-31 October 2010, 1-4.
https://doi.org/10.1109/icmult.2010.5629848
[11] Ono, N., Kohno, H., Ito, N. and Sagayama, S. (2009) Blind Alignment of Asynchro- nously Recorded Signals for Distributed Microphone Array. IEEE Workshop on ApplicationsofSignalProcessingtoAudioandAcoustics, New Paltz, 18-21 Octo-ber 2009, 161-164. https://doi.org/10.1109/aspaa.2009.5346505
[12] Pololu Corp. (2015) Wixel SDK Documentation. http://pololu.github.io/wixel-sdk/ [13] Abramson, N. (1970) The Aloha System: Another Alternative for Computer Com-munications. ProceedingsoftheFall JointComputerConference, Houston, 17-19 November 1970, 281-285. https://doi.org/10.1145/1478462.1478502
[14] Wabnitz, A., Epain, N., Jin, C. and van Schaik, A. (2010) Room Acoustics Simula-tion for Multichannel Microphone Arrays. ProceedingsoftheInternational Sympo-siumonRoomAcoustics, Melbourne, 29-31 August 2010, 1-6.
[15] Rhudy, M., Bucci, B., Vipperman, J., Allanach, J. and Abraham, B. (2009) Micro-phone Array Analysis Methods Using Cross-Correlations. ASME 2009 International MechanicalEngineeringCongressandExposition, Lake Buena Vista, Florida, 13-19 November 2009, 281-288. https://doi.org/10.1115/imece2009-10798
[16] MATLAB, Version 8.6.0 (2015) Natick, Massachusetts: The MathWorks Inc., 2015.
Submit or recommend next manuscript to SCIRP and we will provide best service for you:
Accepting pre-submission inquiries through Email, Facebook, LinkedIn, Twitter, etc. A wide selection of journals (inclusive of 9 subjects, more than 200 journals)
Providing 24-hour high-quality service User-friendly online submission system Fair and swift peer-review system
Efficient typesetting and proofreading procedure
Display of the result of downloads and visits, as well as the number of cited articles Maximum dissemination of your research work
Submit your manuscript at: http://papersubmission.scirp.org/