http://www.scirp.org/journal/jpee ISSN Online: 2327-5901
ISSN Print: 2327-588X
Design and Analysis of a Dual Rotor Turbine
with a Shroud Using Flow Simulations
Peter E. Jenkins, Abdalfadel Younis, Yuxuan Chen
Mechanical Engineering Department, University of Colorado, Denver, USA
Abstract
This paper describes the flow simulation of a dual rotor, three-bladed wind turbine module with a shroud to determine its performance. The parameters that were evaluated are the effects of adding a second rotor, wind speed, dis-tance between the two rotors, the size of the front rotor and the shroud. The results were obtained by using the Solid Works 2015 flow simulation program. Also, the benefits and cost issues for wind generating systems are illustrated.
Keywords
Wind Turbine, Dual Rotor Turbine, Three-Bladed Wind Turbine, Flow Simulation, Shroud
1. Introduction
Wind energy is a form of solar energy which delivers uneven heat to various parts of the Earth’s surface and causes an imbalance in the pressure distribution in the atmosphere. Due to the horizontal pressure gradient, wind is generated from the horizontal movement of the air. In certain applications, wind energy can be utilized and developed as an important energy source.
The first windmill, which was the vertical axis system developed in Persia about 500-900 A.D, was used for tasks of grain grinding and water-pumping. Vertical-axis windmills were also used in China, which is often claimed as their birthplace [1]. In the 1950s, with the discovery of oil in the Middle East that was used to generate modern mechanical and electrical power, the development of wind turbine development began to slow down. Twenty years ago, due to the “oil crisis”, there was an energy shortage problem. The instability and limited nature of conventional fossil energy supply led to the development of clean, re-newable energy and the emergence of wind power.
Energy technology has significantly improved for over the past decades.
Iron-How to cite this paper: Jenkins, P.E., Younis, A. and Chen, Y.X. (2017) Design and Analysis of a Dual Rotor Turbine with a Shroud Using Flow Simulations. Journal of Power and Energy Engineering, 5, 25-40.
https://doi.org/10.4236/jpee.2017.54004
Received: February 1, 2017 Accepted: April 27, 2017 Published: April 30, 2017
Copyright © 2017 by authors and Scientific Research Publishing Inc. This work is licensed under the Creative Commons Attribution International License (CC BY 4.0).
http://creativecommons.org/licenses/by/4.0/
ically, there are still over 1.1 billion people who live without access to electricity.
Figure 1 shows that most people who have limited electricity are living in Africa,
Asian, and South America. Also, around 2.8 billion people have to use wood, candles, or other biomass to fulfill the basic needs of nutrition, cooking, heating, and lighting [2]. Obviously, using biomass will produce a large increase in air pollution, which causes about 4.3 million deaths each year. Even though the en-vironmental awareness has been growing for about a century, enen-vironmental pollution is still a problem, such as the global warming, haze, and acid rain. However, there is one clean, renewable form of energy that uses virtually no wa-ter and pumps billions of dollars into our economy every year—that is wind energy. Since 2008, the U.S. wind industry has generated more than $100 billion in private investment [3]; as a result, it is necessary to continue to develop ad-vanced wind turbine technology to supply this growing market.
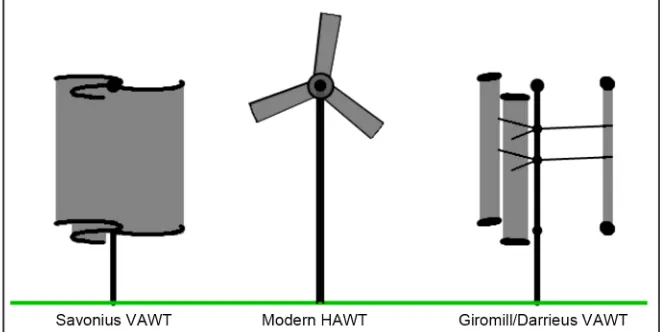
Wind turbines convert the kinetic energy of the wind into mechanical power, which can then be converted into electricity by a generator. With the advance-ment of technology, several types of wind turbines have been created. Both ho-rizontal and vertical axis turbines can be used for power generation. The three primary types are horizontal-axis wind turbines (HAWT), Savonius vertical-axis wind turbines (Savonius VAWT) and Darrieus VAWT turbines, as shown in
Figure 2.
2. Evaluation Process
In this paper, four variables—wind speed, distance between two rotors, scale of the first rotor and a shroud, are evaluated for a three-bladed, dual rotor wind turbine. By using a flow simulation program, the effect of these variables on the flow velocity, pressure, and output power of the wind turbine were evaluated.
Four different wind speeds—10, 20, 30, 40 m/s, were used in the simulation module. The spacing between the rotors was 1.5 m, 3 m and 4 m. Also, the smaller rotors added to the model, as shown in Figure 3, were 60% and 80%
Figure 2. Types of wind turbine [3].
Figure 3. Dual-rotor wind turbine in Solid Works 2015.
smaller than the larger rotor, respectively. To evaluate the models in the simula-tion, three variables were kept constant and one variable was changed. For ex-ample, for the smaller front rotor flow velocities, which are the wind flow veloci-ties on the front of the second, larger blade, were evaluated with wind speeds of 10, 20, 30, 40 m/s. The front rotor was 60% smaller than the rear one and no shroud on the dual-rotor wind turbine was installed. Then the effects of the dis-tances of 1.5, 3, 4 m between two rotors were evaluated. The flow simulation, using Solid Works 2015, was used to evaluate the different models.
[image:3.595.266.479.273.505.2]phase, problems can be addressed early, reducing the cost and avoiding rework. All the parts—blade, tower, nacelle, smaller rotor and shroud—can be built in Solid Works 2015 and combined as the SLDASM which was used in this evalua-tion (Figure 3).
The model of the dual rotor wind turbine was designed based on a Vestas V90-3MW wind turbine (Table 1). A smaller rotor was installed in front of the conventional wind turbine to simulate a dual rotor wind turbine.
The local wind speed can be accelerated by capturing and concentrating the wind through some mechanism, such as a shroud. Installing a shroud was the method used in this evaluation. When a shroud was chosen, the most important factor considered was that the shroud have a long diffuser and brim to create vortexes to reduce the pressure downstream of the rotor to cause more flow into the rotor [4]. When the entering flow increased, the velocity of the wind speed across the wind turbine increased, resulting in an increase of output power
(Figure 4).
However, increasing the lengths of the diffuser and brim could adversely af-fect the durability of the shrouded wind turbine because of the increases of weight and stresses [5]. To determine the diameter of the shroud (Dr), the fol-lowing formula was used:
1.47 t
[image:4.595.210.540.406.718.2]L = D
Table 1. Design detail of V90-3MW wind turbine by Vestas.
Back rotor Nacelle Tower Hub
Rotor
diameter (m) 90.1771 Height (m) 4 Height (m) 105 diameter (m) Maximum 3.6
Swept area
(m2) 6387 Length (m) 9.65 Maximum width (m) 4.2
Length of
blade (m) 43.2885 Width (m) 8.85 Length (m) 4.4
2
t
L L=
(
0.02)
r r
D=D + D
The next step, after finishing building all the parts of dual rotor wind turbine in Solid Works 2015, was to operate the flow simulation with the following steps: define computational domain, choose the goals, run the active project, insert flow trajectories, and show the results. In order to convert the flow velocities and pressures into numbers, the trajectories of the flows were obtained. The gra-dients of the velocities and pressures were shown in different colors, so that dif-ferent levels of velocities and pressures were distinguished. For instance, when using the smaller rotor with 60% reduction with an applied wind speed of 10 m/s, there are two types of images—detailed and overview—as shown in Figure 5 and Figure 6. In Figure 5, the gradients of the velocities are shown in different colors in contrast with the numbers on the left side. Further, the trend of the ve-locity around the dual rotor wind turbine with a shroud on it can be described as shown in Figure 6. Also, by reading the data shown in the flow simulations, the magnitudes of the velocity and pressure in front and back of the smaller rotor, and front and back of the bigger rotor were obtained.
3. Evaluation Results and Analysis
3.1. The Front Velocity of the Large Rotor
One of the most important data obtained was the front flow velocity of the larger rotor (Vf2) which was an important factor in determining the output wind pow-er.
3.1.1. Front Velocity Affected by Wind Speed, Diameter and Rotor Separation Distance (With Shroud)
[image:5.595.209.539.523.718.2]When changing the distance between the smaller and bigger rotors, the front flow velocity of the bigger rotor changed. The scale of the smaller rotor was also
Figure 6. Flow simulation overview.
a factor that had an effect on the outcome. In this evaluation, wind speeds of 10, 20, 30, 40 m/s were applied to the dual rotor wind turbine, and the scale of the smaller rotor to the bigger rotor was changed from 60% up to 80%. Then, the distance between rotors was changed from 1.5 m, 3 m and 4 m. Using flow simu- lation, all the front flow velocities of the bigger rotor were determined (Table 2). According to Table 1, Figure 7 and Figure 8, the front flow velocity increased when the wind speed increased. However, the impact of the distance between rotors was not significant. Also, the scale of the rotors had a positive effect. When the scale of the front rotor was decreased, more air flow was allowed to enter the larger rotor which resulted in more output power.
3.1.2. Front Velocity Affected by Wind Speed, Diameter and Separation Distance (without Shroud)
The shroud was the most important factor that affected the velocity and pressure of the air flow across the wind turbine. In this evaluation, (Vx) speeds of 10, 20, 30, and 40 m/s were used as before, and the spacing between the rotors was changed from 1.5 m up to 4 m. The flow simulations were repeated for each spacing and the results were recorded. In order to show the results more clearly, the results from the flow simulation were converted to numbers, as shown below
(Table 3, Figure 9 and Figure 10).
Even though the diameter of the smaller rotor was changed from 60% to 80%, the distance between rotors had a small impact on the flow velocity. However, when the wind speed increased, the flow velocity acting on the rear rotor in-creased when the smaller rotor was reduced in size.
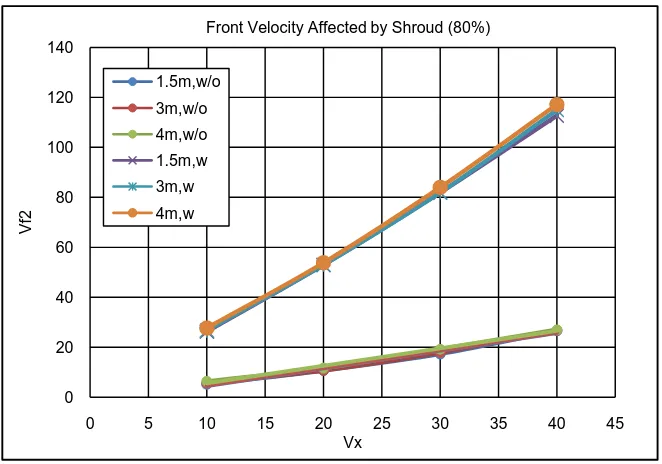
3.1.3. Front Velocity Affected by Shroud
Table 2. Front velocity affected by wind speed, diameter and rotor separation distance (without shroud).
60% 80%
[image:7.595.208.538.488.706.2]1.5 m 3 m 4 m 1.5 m 3 m 4 m Vx Vf2 Vf2 Vf2 Vx Vf2 Vf2 Vf2 10 6.57 6.8 7.042 10 5.194 5.531 6.27 20 12.94 13.375 13.968 20 10.602 10.728 11.583 30 20.237 21.428 21.985 30 17.276 17.857 19.221 40 27.463 29.201 30.07 40 26.604 26.665 27.01
Figure 7. Larger rotor front velocity affected by different scales of smaller rotor (60%), without Shroud.
Figure 8. Bigger rotor front velocity affected by different scales of small rotor (80%), with Shroud.
0 5 10 15 20 25 30 35
0 5 10 15 20 25 30 35 40 45
V
f2
Vx
60%, Bigger Rotor Front Velocity, w/o Shroud
1.5m
3m
4m
0 5 10 15 20 25 30
0 5 10 15 20 25 30 35 40 45
V
f2
Vx
80%, Bigger Rotor Front Velocity, w/o Shroud
1.5m
3m
Table 3. Front velocity affected by wind speed, diameter, and rotor separation distance (With Shroud).
[image:8.595.210.538.489.718.2]0.6, Larger rotor front velocity 0.8, Larger rotor front velocity 1.5 m 3 m 4 m 1.5 m 3 m 4 m Vx Vf2 Vf2 Vf2 Vx Vf2 Vf2 Vf2 10 26.971 27.172 27.797 10 26.201 26.636 27.627 20 53.973 55.012 55.717 20 52.872 52.965 53.775 30 81.072 83.593 85.134 30 81.812 81.96 83.951 40 114.464 116.895 117.057 40 112.672 114.934 117.106
Figure 9. Larger rotor front velocity affected by different scale of small rotor (60%).
Figure 10. Larger rotor front velocity affected by different scale of small rotor (80%). 0
20 40 60 80 100 120 140
0 5 10 15 20 25 30 35 40 45
V
f2
Vx
60%, Larger Rotor Front Velocity
1.5m
3m
4m
0 20 40 60 80 100 120 140
0 5 10 15 20 25 30 35 40 45
V
f2
Vx
0.8 Diameter, Larger Rotor Front Velocity
1.5m
3m
Figure 11. Front velocity affected by shroud (60%).
Figure 12. Front velocity affected by shroud (80%).
rotor separation distance from 1.5 m to 4 m for both reductions, and for a re-duced front rotor of 60% and 80% of the bigger rotor.
According to both Figure 11 and Figure 12, a significant influence resulted using the shroud. The front velocity was increased from around 30 m/s to 120 m/s when the wind speeds were applied from 10 m/s to 40 m/s for the module with a shroud on it. The velocity gradient was around 90 m/s, which is much larger than that for the module without a shroud. Therefore, adding a shroud on the wind turbine generates much more flow energy then changing the distance between rotors [6].
0 20 40 60 80 100 120 140
0 5 10 15 20 25 30 35 40 45
V
f2
Vx
Front Velocity Affected by Shroud (60%)
3m,w/o
4m,w/o
1.5m,w
3m,w
1.5m,w/o
4m,w
0 20 40 60 80 100 120 140
0 5 10 15 20 25 30 35 40 45
V
f2
Vx
Front Velocity Affected by Shroud (80%)
1.5m,w/o
3m,w/o
4m,w/o
1.5m,w
3m,w
[image:9.595.208.539.333.565.2]3.2. Pressure
This section describes how the pressure of the air changes when flowing over the blades of the wind turbine. During the simulation, the front pressure and back pressures were measured at the same position on the front and back point on the blade. The values obtained were through the same line in the flow simulation from the middle of the front rotor blade. Also, by adding the shroud, a signifi-cant influence on the pressure was noticed.
Pressure for Dual Rotor without Shroud
As shown in Table 4 and Table 5, when the flow velocity increased, the pressure for both types wind turbines—60% and 80%—increased, which implies that the size of smaller rotor has no major effect on the pressure. Moreover, when the smaller rotor was used, and the distance from the smaller rotor to larger rotor was changed, there was little change in pressure. In other words, the pressure in the front and back of the blades for both front rotor and back rotor were more affected by the flow velocity instead of the size of the small rotor and the dis-tance between the rotors.
3.3. Wind Power
[image:10.595.209.539.434.567.2]A German physicist, Albert Betz, concluded in 1919 that a wind turbine could not convert more than 16/27 (59.3%) of the kinetic energy of the wind into me-chanical energy. Up to this day, this is known as the Betz Limit or Betz’ Law. The
Table 4. Front pressure (60%).
Smaller Rotor 1.5 m Bigger Rotor 1.5 m Smaller Rotor 3 m Bigger Rotor 3 m Smaller Rotor 4 m Bigger Rotor 4 m Vx (m/s) Pf1 Pf2 Pf1 Pf2 Pf1 Pf2
10 101,359.17 101,330.28 101,343.96 101,325.86 101,343.54 101,328.22 20 101,416.18 101,312.38 101,392.51 101,314.99 101,386.26 101,323.35 30 101,598.6 101,314.45 101,475.28 101,244.28 101,574.95 101,372.22 40 101,809.32 101,449.87 101,638.88 101,158.38 101,774.29 101,410.3
Table 5. Front pressure (80%).
Smaller Rotor 1.5 m Bigger Rotor 1.5 m Smaller Rotor 3 m Bigger Rotor 3 m Smaller Rotor 4 m Bigger Rotor 4 m Vx (m/s) Pf1 101,314.28 Pf1 Pf2 Pf1 Pf2
[image:10.595.207.541.603.733.2]theoretical maximum power efficiency of any design of a wind turbine is 0.59 (i.e. no more than 59% of the energy carried by the wind can be extracted by a wind turbine) [7]. Using the Betz Limit, there is a maximum Power Coefficient, Cp, which is the ratio of power extracted by the turbine to the total contained in
the wind resource:
p T W
C =P P
Then the wind turbine power output is:
3
1 2
T
P = ρAv
The Betz Limit is the maximum value of Cp and equals 16/27.
However, there is an alternative way to estimate the annual energy output when a wind turbine system is analyzed. This method is based on the Weibull or Rayleigh distribution method using an average wind speed of V (m/s) at the wind turbine hub’s height and a capacity factor (CF). The capacity factor can be determined as:
×
Actual energy delivered CF =
Rated power 8760
R
P × ×
Annual energy (kWh/yr) = (KW) 8760 (h/yr) CF
R
P
Actual energy delicered 8760 (h/yr) Average power
CF = =
Rated power Also
2
0.087 PR
V D
= −
CF (For Rayleigh’s distribution).
Then, in this case, the power obtained from the wind speed which acts on the front of the rotor is obtained:
3
6 1
2
w air back rotor
P ρ A V
π
= × × × ×
As shown in the Table 6 and Figure 13 up to Figure 18, the distance between rotors does not change the output power. The power only increases around 200 kW when the distance is changed from 1.5 m to 4 m. On the other hand, the shroud has a significant effect on the output power. For instance, using a rotor separation distance of 1.5 m and wind speed of 40 m/s, the power difference was around 43,000 kW when using a shroud, which was a significant increase
(Figure 13 to Figure 18). Therefore, even though the shroud might add to the
overall cost of the wind turbine system, it will provide a significant increase in output power.
EES Programing
Figure 13. Power affected by shroud (Small Rotor 60%).
Figure 14. Power produced without shroud (Small Rotor 60%).
Figure 15. Power produced with shroud (Small Rotor 60%). 0 5000 10000 15000 20000 25000 30000 35000 40000 45000 50000
0 5 10 15 20 25 30 35 40 45
P ow er0. 6 [KW ] Vx [m/s] Power0.6,1.5,w/o Power0.6,1.5,w Power0.6,3,w/o Power0.6,3,w Power0.6,4,w/o Power0.6,4,w Power0.6,1.5,w/o Power0.6,1.5,w Power0.6,3,w/o Power0.6,3,w Power0.6,4,w/o Power0.6,4,w 0 100 200 300 400 500 600 700 800 900
0 5 10 15 20 25 30 35 40 45
P ow er 0. 6 [KW ] Vx [m/s] Power0.6,1.5,w/o Power0.6,3,w/o Power0.6,4,w/o Power0.6,1.5,w/o Power0.6,3,w/o Power0.6,4,w/o 0 10000 20000 30000 40000 50000
0 5 10 15 20 25 30 35 40 45
Figure 16. Power affected by shroud (Small Rotor 80%).
Figure 17. Power produced without shroud (Small Rotor 80%).
Figure 18. Power produced with shroud (Small Rotor 80%). 0 5000 10000 15000 20000 25000 30000 35000 40000 45000 50000
0 5 10 15 20 25 30 35 40 45
P ow er 0. 8 [KW ] Vx [m/s] Power0.8,1.5,w/o Power0.8,1.5,w Power0.8,3,w/o Power0.8,3,w Power0.8,4,w/o Power0.8,4,w Power0.8,1.5,w/o Power0.8,1.5,w Power0.8,3,w/o Power0.8,3,w Power0.8,4,w/o Power0.8,4,w 0 100 200 300 400 500 600
0 5 10 15 20 25 30 35 40 45
P ow er0. 8 [KW ] Vx [m/s] Power0.8,1.5,w/o Power0.8,3,w/o Power0.8,4,w/o Power0.8,1.5,w/o Power0.8,3,w/o Power0.8,4,w/o 0 10000 20000 30000 40000 50000
0 5 10 15 20 25 30 35 40 45
Table 6. Power produced.
Vx P0.6, 1.5, w/o P0.6, 3, w/o P0.6, 4, w/o P0.8, 1.5, w/o P0.8, 3, w/o P0.8, 4, w/o
10 8.191 9.082 10.08657 4.0467 4.88678 7.11899
20 62.573 69.1 78.7113 34.43155 35.64943 44.89943
30 239.351 283.949 307.06 149.12141 164.29727 205.23242
40 598.991 717.993 785.97228 545.34982 546.65896 569.80216
Vx P0.6, 1.5, w P0.6, 3, w P0.6, 4, w P0.8, 1.5, w P0.8, 3, w P0.8, 4, w
10 566.27244 577.39974 617.74583 517.89958 544.19901 607.20256
20 4479.3672 4743.04174 4921.33273 4204.19412 4220.34981 4444.09427
30 14,951.2859 16,302.7281 17,328.6575 15,321.8640 15,361.9888 16,502.1560
40 42,368.4845 44,435.8220 44,364.3645 38,806.4561 41,509.0158 43,570.5874
function varying the velocity to determine the output power. The following EES code was used to evaluate wind turbine output power and the results are shown
in Table 6.
“ALL FOR BIGGER ROTOR, W/O SHROUD” r = 0.0901771
A = pi*(r^2) v_x = v
“Without Shroud, Compare for distance between two blades” “External (w/o shroud), Bigger rotor, 0.6”
rho_0.6_1.5_ext = density(Air, T=25, P=P_0.6_1.5_ext)
Power_0.6_1.5_ext = (6/pi)*(1/2)*rho_0.6_1.5_ext*A*(v_0.6_1.5_ext^3)
rho_0.6_3_ext = density(Air, T=25, P=P_0.6_3_ext)
Power_0.6_3_ext = (6/pi)*(1/2)*rho_0.6_3_ext*A*(v_0.6_3_ext^3)
rho_0.6_4_ext = density(Air, T=25, P=P_0.6_4_ext)
Power_0.6_4_ext = (6/pi)*(1/2)*rho_0.6_4_ext*A*(v_0.6_4_ext^3)
“External (w/o shroud), Bigger rotor, 0.8”
rho_0.8_1.5_ext = density(Air, T=25, P=P_0.8_1.5_ext)
Power_0.8_1.5_ext = (6/pi)*(1/2)*rho_0.8_1.5_ext*A*(v_0.8_1.5_ext^3)
rho_0.8_3_ext = density(Air, T=25, P=P_0.8_3_ext)
Power_0.8_3_ext = (6/pi)*(1/2)*rho_0.8_3_ext*A*(v_0.8_3_ext^3)
rho_0.8_4_ext = density(Air, T=25, P=P_0.8_4_ext)
“Add a shroud on the bigger rotor” “Internal (with shroud), Bigger rotor, 0.6”
rho_0.6_1.5_in = density(Air, T=25, P=P_0.6_1.5_in)
Power_0.6_1.5_in = (6/pi)*(1/2)*rho_0.6_1.5_in*A*(v_0.6_1.5_in^3)
rho_0.6_3_in = density(Air, T=25, P=P_0.6_3_in)
Power_0.6_3_in = (6/pi)*(1/2)*rho_0.6_3_in*A*(v_0.6_3_in^3)
rho_0.6_4_in = density(Air, T=25, P=P_0.6_4_in)
Power_0.6_4_in = (6/pi)*(1/2)*rho_0.6_4_in*A*(v_0.6_4_in^3)
“Internal (with shroud), Bigger rotor, 0.8”
rho_0.8_1.5_in = density(Air, T=25, P=P_0.8_1.5_in)
Power_0.8_1.5_in = (6/pi)*(1/2)*rho_0.8_1.5_in*A*(v_0.8_1.5_in^3)
rho_0.8_3_in = density(Air, T=25, P=P_0.8_3_in)
Power_0.8_3_in = (6/pi)*(1/2)*rho_0.8_3_in*A*(v_0.8_3_in^3)
rho_0.8_4_in = density(Air, T=25, P=P_0.8_4_in)
Power_0.8_4_in = (6/pi)*(1/2)*rho_0.8_4_in*A*(v_0.8_4_in^3)
4. Conclusion
The usage of wind power has been one of the fastest growing technologies in the world [8]. Improving the efficiency and generating more wind power becomes more important as the cost of conventional fuels increases. In this research, there are four results. First, using longer blades for the back rotor increases the flow velocity on the blades. Secondly, when the wind velocity is increased, the blade flow velocity and power increased with the dual rotor configuration. Next, the distance between the front rotor and back rotor and the flow velocity on the back blade are directly proportional since more flow is allowed to reach the rear rotor with a reduced smaller blade. And lastly, the shroud has the most signifi-cant effect on the flow velocity and power as the shroud causes an increase in the air flow to the rotor. Even though the cost of wind power has decreased dramat-ically in the past 10 years, the technology requires a higher initial investment than fossil-fueled generator [9]. Therefore, adding the shroud to the wind tur-bine provides a significant improvement to the cost effectiveness and operation of a wind turbine system and will provide a lower levelized cost of energy— lower cents/kWh.
References
[1] Darrel, D.M. (2014) Illustrated History of Wind Power Development. Littleton, Colorado. http://ww.telosnet.com/wind/early.html
[2] (2016) The World Bank, Energy.
[3] Wind 101: The Basics of Wind Energy. N.p., n.d.
http://www.awea.org/wind-energy-101
[4] Flannery, K., Holligan, M. and Soares, J. (2014) Shrouded Small Wind Turbines. [5] Jenkins, P.E. and Younis, A. (2016) Flow Simulation to Determine the Effects of
Shrouds on the Performance of Wind Turbines. Denver, Colorado.
[6] Schilling, D.R. (2013) Wind Lens: Fluid Dynamics Concentrated Wind Energy. http://www.industrytap.com/wind-lens-fluid-dynamics-concentrated-wind-energy/ 523
[7] Wind Turbine Power Calculations RWE Npower Renewables. N.p., n.d.
[8] Santhyajith, M. and Philip, G.S. (2011) Advances in Wind Energy Conversion Technology. Sprint, New York. https://doi.org/10.1007/978-3-540-88258-9 [9] Wind Energy Basics. N.p., n.d. http://windeis.anl.gov/guide/basics/
Submit or recommend next manuscript to SCIRP and we will provide best service for you:
Accepting pre-submission inquiries through Email, Facebook, LinkedIn, Twitter, etc. A wide selection of journals (inclusive of 9 subjects, more than 200 journals)
Providing 24-hour high-quality service User-friendly online submission system Fair and swift peer-review system
Efficient typesetting and proofreading procedure
Display of the result of downloads and visits, as well as the number of cited articles Maximum dissemination of your research work
![Figure 1. Global energy deficit [2].](https://thumb-us.123doks.com/thumbv2/123dok_us/7764317.714137/2.595.209.538.523.715/figure-global-energy-deficit.webp)