Multivariate Analysis of Wheat Flour Dough Sugars,
Gas Production, and Dough Development at Different
Fermentation Times
Georgiana Gabriela Codină
1*, Silvia MironeaSa
1*, daniela V. VoiCa
2*and Costel MironeaSa
3*1Faculty of Food engineering and 3Faculty of Mechanical engineering, Mechatronics and
Management, Stefan cel Mare University, Suceava, romania; 2Faculty of Biotechnical Systems engineering, University Politehnica of Bucharest, Bucharest, romania
Abstract
Codină G.G., Mironeasa S., Voica D.V., Mironeasa C. (2013): Multivariate analysis of wheat flour dough sugars, gas production, and dough development at different fermentation times.Czech J. Food Sci., 31: 222–229.
A Principal Component Analysis method based on multivariate analysis was used to evaluate the correlation between the fermentable sugar content of dough and its behaviour during fermentation at different fermentation times of 60, 120, and 180 minutes. The concentration of fermentable sugars during dough fermentation (sucrose, glucose, maltose, and fructose) was determined using a High Performance Liquid Chromatography device. Also, the Chopin Rheofermentometer device was used for the analysis of gas production and dough development at the fermentation times mentioned above. From the aspect of the correlations established between the parameters obtained by the two devices, very good correla-tions were obtained. For example, the gas production showed a positive correlation with glucose content after 60 min of fermentation (r = 0.846) and a negative correlation with fructose content after 120 min of fermentation time (r = –0.993).
Keywords: rheofermentometer; yeast; fermentable sugars; Principal Component Analysis; HPLC
The main yeast substrates in wheat flour dough are fructose, glucose, sucrose, and maltose (Sahlstrom
et al. 2004). The content of these fermentable sugars is continuously modified throughout the technological process due to both their amylolytic production and yeast consumption during the fermentation process. Initially, the sugars consumed by yeast are the flour specific carbohydrates such as glucose, fructose, and sucrose and towards the end maltose which results from amylolysis during the technological process.
Various methods have been developed for meas-uring the content of these fermentable sugars in wheat flour, i.e. chemical, colorimetric, enzymatic, and chromatographic methods (McCleary et al.
2006). Chromatographic methods are the most
efficient ones because they are capable of deter-mining individual sugars from wheat flour and not only the total sugar or sucrose content, with little emphasis on the other individual sugars. Among the most frequently used chromatographic methods to measure the sugar content of wheat flour are the following ones: thin layer chromatography (Shieh
et al. 1973; Henry & Saini 1989), ion-exchange chromatography (Abou-Guendia & D’Appolonia 1972), gas-liquid chromatography (Li et al. 1985) and high-performance liquid chromatography (Po-tus et al. 1994; Langemeier & Rogers 1995; Sahlstrom et al. 2004; Codină & Voica 2010; Tseng et al. 2010). Out of the above-mentioned chromatographic methods, high-performance liquid
chromatography (HPLC) has become the preferred method to quantify simple sugars from cereal prod-ucts due to the accuracy and precision of performed determinations (Codină & Voica 2010).
The evolution of the sugar content of wheat flour and dough during fermentation is extremely im-portant in the bakery technological process and is determined in technological terms by the wheat flour dough gas production assessed by volumet-ric methods that measure the released gas (CO2) volume and manometer methods that measure the gas production under pressure (Shuey 1975; Rubenthales et al. 1980; Sahlstrom et al. 2004). The most frequently used methods to assess wheat flour gas production are the volumetric meth-ods using Fermentograph SJA (Nassjo, Sweden) and Rheofermentometer (Chopin, Villeneuve-La-Garenne, France) device (Švec & Hrušková 2004). The rheofermentometer is one of the most modern devices used for the assessment of wheat flour tech-nological quality (Czuchajowska & Pomeranz 1993) and records the variations in a yeast rate of fermentation as a function of time (for example, CO2 released per minute). It measures the devel-opment of dough during fermentation measured by a height sensor and gas development measured by a pressure sensor (Ktenioudaki et al. 2011).
The aim of this paper is to establish a series of correlations using the Principal Component Analy-sis (PCA) between the dough fermentable sugar content variation during the fermentation process by meansof a HPLC device and wheat flour dough gas production using a Chopin Rheofermento- meter and also a series of correlations between the quantity of gas production and the dough height increase at different fermentation times. To our knowledge, no report has yet stressed a series of correlations using a PCA method between the parameters measured by these two devices.
MATERIAL AND METHODS
Material. Wheat (2008 harvest) was milled on an experimental Buhler mill from S.C. Vel Pitar S.A. (Valcea, Romania). Flour quality tests which were conducted according to Romanian or international standard methods (ICC No. 104/1, 106/2, 105/2, 107/1, and SR 90:2007) indicated the following quality parameters: ash content 0.47%, wet gluten content 26.50%, protein content 11.40%, falling number 404 s, gluten deformation index 6.00 mm.
The concentrations of soluble mono- and disaccha-rides in flour are (in decreasing order) as follows: sucrose (2.16 mg/g), maltose (0.57 mg/g), fructose (0.53 mg/g), and glucose (0.45 mg/g). These values are in agreement with those reported by others (Abou-Guendia & D’Appolonia 1972; Potus
et al. 1994; Sahlstrom et al. 2004).
In this study four different commercial forms of bakery yeast Saccharomyces cerevisiae type provided by S.C. Rompak S.A Romania were used. Fructose, glucose, sucrose, and maltose (Merck KGaA, Darmstadt, Germany) were used without further purification.
Mixing conditions. The dough recipe comprised flour, water (accord. WA, %), 3% yeast (% flour basis), and 1.5% salt (% flour basis). The dough was kneaded for 15 min and afterwards, it was fermented for 180 min at a temperature of 30°C and 80% relative humidity. Analyses were performed before the insertion in the proofing device and after the following time periods: 60, 120, and 180 min of fermentation.
Sugar extraction. At the beginning, 10 g of the dough sample were boiled for 20 min in 100 ml of 60% ethanol. The sample was centrifuged for 15 min at a speed of 4000 rotations/min after the cooling phase. Afterwards, the supernatant was concentrated at the vacuum pump, and then it was filtered using What-man 42 paper. Before the injection into the HPLC system, the filtered material was passed through a filtering membrane of 0.22 μm. Chromatographic determinations were done in a HPLC system equipped with Alltec refractive index detector. The working parameters of this system are the following ones: column – waters with aminopropyl-bonded phase – C18, 250 mm × 4.6 mm, 4 μm particle diameter; eluent – acetonitrile:water solution (with 0.125% w/v of sodium chloride added to minimise the in-terference from NaCl) = 75:25; flow rate 1 ml/min; temperature 30°C; injected volume 20 μl. The re-tention times in the column of the sugars were as follows: fructose – 5 min, glucose – 5.8 min, sucrose – 8.2 min, maltose – 9.8 minutes. Sugar concentration was calculated based on peak area measurements.
Statistical analysis. All determinations were performed at least in triplicate. The values of the parameters are expressed as the mean ± standard deviation at confidence interval of 95%. All data were analysed with the Statistical Package for the Social Science, Version 16.0 (SPSS Inc., Chicago, USA).
To verify the relation between variables, the following method of interpreting the Pearson correlation coefficients was used (Kotrlik & Williams 2003): very strong association for a correlation of 0.7 or higher; substantial associa-tion for a correlaassocia-tion of 0.5 or higher; moderate association for a correlation of 0.3 or higher; low association for a correlation of 0.1 or higher.
A multivariate exploratory technique, Principal Component Analysis (PCA) was performed to highlight the correlations between fermentable sugars during the dough fermentationand its be-haviour (gas production, dough height) at different fermentation times. This statistical multivariate analysis was used to observe similarities between fermentable sugars during the dough fermentation and its behaviour, reducing the dimension to two PCs, while keeping most of the original informa-tion found in the data. Only PCs with eigenvalues larger than one were retained for further analyses.
RESULTS AND DISCUSSION
Variation of the concentration of fermentable sugars during dough fermentation
The amount of fermentable sugars during the dough fermentation process using the bakery yeast
Saccharomyces cerevisiae type is shown in Table 1. Sucrose, which is present in wheat flour, has not been identified in the dough after kneading, for none of the analysed samples, which is in agree-ment with the results of Potus et al. (1994) and Langemeier and Rogers (1995). This fact can be explained by the presence of the invertase en-zymein the yeast, which is a very active one that has rapidly broken down sucrose to glucose and fructose (Sahlstrom et al. 2004; Verstrepen et al. 2004) in the yeast cell periplasmic space in the very first minutes of kneading. That is why at the beginning of the kneading process from the content of flour fermentable sugars only glucose, fructose, and maltose resulting by starch hydrolysis are only present in the wheat flour dough (Sahlstrom et al.
2004). At the beginning of the fermentation process
higher levels of glucose, fructose, and maltose were detected than those detected in the wheat flour.
During the dough fermentation process, their content increases especially in the first 60 min of fermentation because amylase, a starch which degrades enzymes in flour, is constantly generat-ing new glucose and maltose. The fermentation of glucose and fructose occurs within the first 60 min to 120 min and the fermentation of fructose and maltose within the 120 to 180 minutes. Maltose fermentation is low until glucose and fructose are exhausted, according to Table 1. Maltose begins to ferment rapidly at 120 min of fermentation time.
Variation in gas production and dough height measurement during dough fermentation
The amount of gas production and dough height in the course of dough fermentation using the bakery yeast Saccharomyces cerevisiae type are shown in Table 2.
[image:3.595.305.532.115.303.2]Gas production in wheat flour dough occurs after such a fermentation rate that indicates a minimum is reached at some time. This minimum corresponds to the moment of the exhaustion of fermentable sugars like glucose and fructose present in the dough which will force the bakery yeast to begin to utilise maltose (Codină & Voica 2010). Dough has a gas retention ability and therefore an increase in volume and height is limited. At first, the entire quantity of gas production is retained by the dough and its height increases rapidly. As Table 1. Variation in the concentration of fermentable sugars during dough fermentation
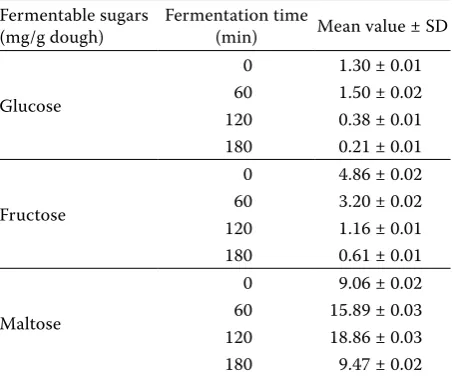
Fermentable sugars
(mg/g dough) Fermentation time (min) Mean value ± SD
Glucose
0 1.30 ± 0.01 60 1.50 ± 0.02 120 0.38 ± 0.01 180 0.21 ± 0.01
Fructose
0 4.86 ± 0.02 60 3.20 ± 0.02 120 1.16 ± 0.01 180 0.61 ± 0.01
Maltose
0 9.06 ± 0.02 60 15.89 ± 0.03 120 18.86 ± 0.03 180 9.47 ± 0.02
the fermentation process continues, the increase of dough height becomes slower until it reaches a maximum and the dough does not increase in height any longer. Even though the gas production continues in wheat flour dough during fermenta-tion, only a part of the gas is retained, while the other part is lost. Due to the increase of pore vol-ume resulting from the retention of gases and their pressure in pores, the pore walls are broken and a part of the gases previously retained is released. As a result, dough height decreases.
Correlation between sugar type and gas production measurement, dough height
during dough fermentation
At the beginning of the fermentation time (until 60 min) the volume of gas production increases significantly due to the fact that in the first stage of fermentation, the fermentable sugars from the flour (glucose, fructose) content are used by the yeast leading to a gradual increase in CO2 produc-tion. As a result, very high positive correlations were obtained between the gas production volume
[image:4.595.65.290.116.186.2]within 60 min of fermentation (V_60)and glucose (G_60) (r = 0.846) and fructose present at this moment (F_60) (r = 0.616) in wheat flour dough. The graphical representation of the value of gas production (V) in relation to the level of glucose (G), fructose (F), and fermentation time (T) is shown in Figures 1 and 2, respectively. These graphs show that the concentration of glucose and fructose decreases during fermentation from 60 min to 180 min, the dough gas production (V) increases up to 120 min of fermentation, and later on it decreases to 180 min of fermentation, reaching the gas production ap-proximately equal to that of 60 min of fermentation. After 60 min of fermentation time, the increase in gas production is slowed down due to the exhaus-tion of flour sugar content by the bakery yeast and it becomes dependent on the fermentation rate of the dough maltose content (Langemeier & Rogers 1995), which will induce an increase of gas produc-tion. As a result, after 120 min of fermentation time we obtained a low correlation (r = 0.128) between the gas production (V_120) and the maltose concen-tration at that moment (M_120). We also obtained a moderate association (r = 0.383) between the gas production (V_120) and the glucose concentration (G_120) liberated from starch by amylases. The low values of correlation coefficients registered at 120 min of fermentation time are due to the flour used as raw material which shows a low α-amylase activity (Nechita 2008) which does not allow malt-ose accumulation from flour starch in the environ-ment leading to a delay in its metabolisation by the yeast cells. An indirect correlation (r = –0.993) was obtained between the gas production (V_120) at Table 2. The variation in gas production and dough height
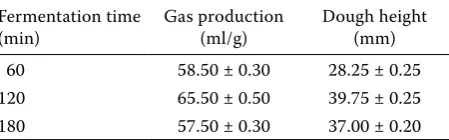
during dough fermentation (mean value ± SD)
Fermentation time
(min) Gas production (ml/g) Dough height (mm) 60 58.50 ± 0.30 28.25 ± 0.25 120 65.50 ± 0.50 39.75 ± 0.25 180 57.50 ± 0.30 37.00 ± 0.20
Figure 1. Variation of gas production (V) with glucose (G) and fermentation time (T): (a) spatial representation, (b) rep-resentation by contours curves
V (ml/g)
G (mg/g) T (min)
T (min)
G (mg/g)
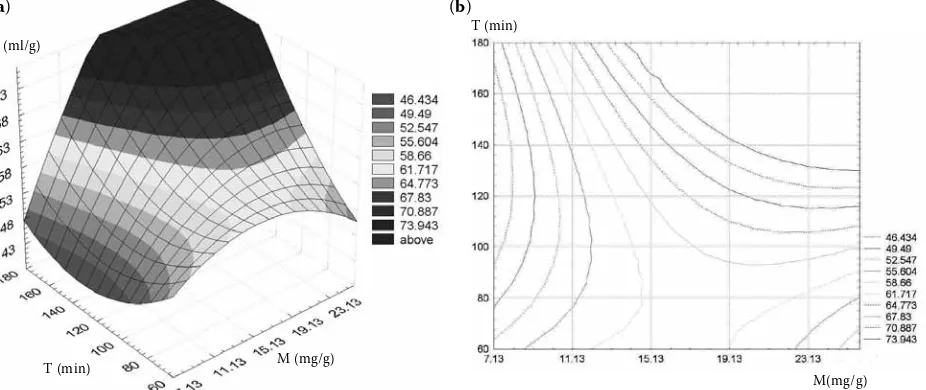
120 min of fermentation time and the fructose concentration (F_120) at that time because of fructose exhaustion from the dough system. Af-ter approximately 180 min of fermentation time, gas production (V_180) depends mostly on the amount of maltose (M_180) that was present in the dough at that moment. A good correlation (r = 0.822) was obtained between the gas production at 180 min (V_180) and the maltose content at that time (M_180), showing a relatively deter-minist relation. The graphical representation of the value of gas production (V) in relation to the level of maltose (M) and fermentation time (T) is shown in Figure 3. The variation of gas production depending on the fermentation time and maltose
concentration shows a maximum value at 120 min of fermentation.
As a result of gas retention in wheat dough, the dough volume increases its development that takes place in three directions: x, y and z.Along the x and y axes, dough development is limited by the fermentation vessel walls. The development along the z-axis depends on the
quantity
of gas retention in wheat dough, which, in turn, depends on the flour quality the dough was made of, con-stant from the quality aspect in this case for all the yeast used as raw material and the quantity of gas produced in the dough. [image:5.595.69.538.81.278.2]As far as this study is concerned, we can say that for flour of constant quality, the increase in Figure 2. Variation of gas production (V) with fructose (F) and fermentation time (T): (a) spatial representation, (b) rep-resentation by contours curves
Figure 3. Variation of gas production (V) with maltose (M) and fermentation time (T): (a) spatial representation, (b) representation by contours curves
(a) (b)
V (ml/g)
M (mg/g) T (min)
V (ml/g)
F (mg/g) T (min)
(a) (b)
T (min)
M(mg/g) T (min)
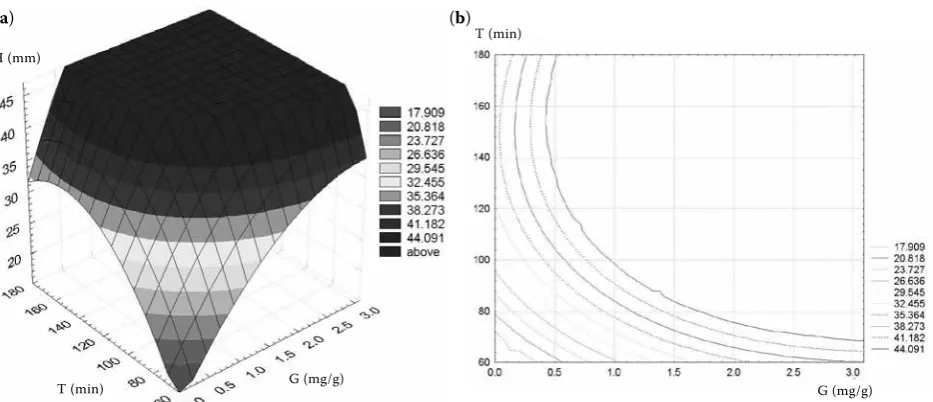
[image:5.595.69.532.531.726.2]dough height is a measure of the amount of gas produced and therefore of the yeast fermentation capacity induced mainly by the amount of dough carbohydrates. Therefore, a very good correlation was obtained between the gas produced at 60 min of fermentation time (V_60) and dough height (H_60) (r = 0.980) and between the gas production at 120 min of fermentation (V_120) and dough height (H_120) (r = 0.942) at that moment. The graphical representation of the value of dough height (H) in relation to the level of glucose (G), fructose (F), and fermentation time (T) is shown in Figures 4 and 5, respectively. Depending on the maltose concentration and fermentation time, Figure 6 shows the variation of dough height. The dough height (H) shows the same trend as in the
case of gas production, with the distinction that at 180 min of fermentation, the decrease of dough height is much smaller than that of gas production. A low negative correlation was obtained between the volume of gas production at 180 min of fermenta-tion (V_180) and dough height (H_180) (r = –0.264) due to the gradual loss of gas retained in the dough, especially at the end of the dough fermentation process. At the same time, the values of correlation coefficients between the quantity of dough sugars and dough height at 60 and 120 min of fermentation follow the same trend as that between gas produc-tion and the quantity of sugars in wheat flour dough. The correlations between the results of dough sucrose types during fermentation and the quantity of gas production, and the dough height at different
Figure 5. Variation of dough height (H) with fructose (F) and fermentation time (T): (a) spatial representation, (b) repre-sentation by contours curves
Figure 4. Variation of dough height (H) with glucose (G) and fermentation time (T): (a) spatial representation, (b) repre-sentation by contours curves
H (mm)
G (mg/g) T (min)
V (ml/g)
G (mg/g) T (min)
T (min)
M (mg/g) T (min)
G (mg/g)
(a) (b)
[image:6.595.63.534.540.725.2]Figure 6. Variation of dough height (H) with maltose (M) and fermentation time (T): (a) spatial representation, (b) repre-sentation by contours curves
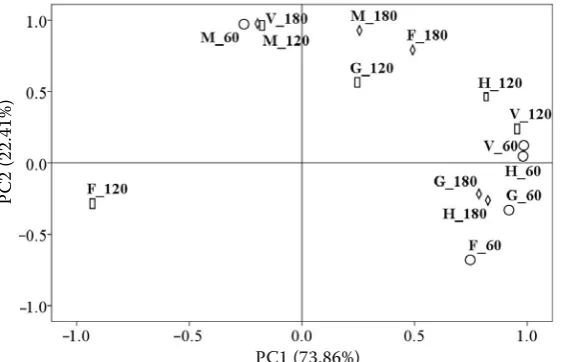
Figure 7. PC1 and PC2 score for the ferment-able sugars types (F – fructose, M – maltose, G – glucose) during the fermentation, the gas production volume (V) and the dough height (H) at different fermentation times, respectively: to – 60 min, □ – 120 min, ◊ – 180 min of fermentation
fermentation times are represented in Figure 7. The first two principal components explain 96.27% of the total variance (PC1 = 73.86% and PC2 = 22.14%).
In regard to the principal component PC1, we can notice a very good correlation between the glucose parameter (G_60) and dough volume (V_60) and dough height (H_60) at 60 min of fermentation. The position of these variables in relation to the first principal component shows that there is a very good correlation between them, which reflects the highest correlation coefficients, r = 0.846 and r = 0.918, respectively.
As to the second principal component PC2, we can notice the opposition between the fructose parameter at 120 min of fermentation (F_120) and the dough volume at that moment (V_120), as well as the opposition between the maltose parameter at 180 min of fermentation (M_180) and the dough
volume at that moment (V_180). Regarding the second principal component PC2, the parameters F_120 and M_120 are placed on the left of the graph, which shows that they contribute to the evaluation of dough behaviour at 120 min of fermentation time to a larger extent compared to the glucose parameter (G_120) at that moment. Using PCA, negative correlations were obtained between F_120 and V_120 (r = –0.993), H_120 (r = –0.972) on the one hand and positive correlations between M_180 and V_180 (r = 0.822) on the other hand.
CONCLUSIONS
The Principal Component Analysis of the data set shows a high association between some sugar types determined using an HPLC system and the
H (mm)
M (mg/g)
T (min)
(a) (b)
T (min)
M (mg/g)
PC1 (73.86%)
[image:7.595.65.347.574.755.2]fermentation behaviour of the wheat flour dough at 60 and 120 min of fermentation time. The cor-relation established by PCA method between the parameters determined with the two devices high-lighted the high positive correlation between the glucose parameter at 60 min of fermentation time (G_60) and gas production (V_60) (r = 0.846), and/ or dough height (H_60) at this fermentation time (r = 0.918). Also, the fructose parameter at 120 min of fermentation time (F_120) was negatively cor-related with gas production (V_120) (r = –0.993) and dough height (H_120) (r = –0.972) at that time.
References
Abou-Guendia M., D’Appolonia B.L. (1972): Changes in carbohydrate components during wheat maturation. I. Changes in free sugars. Cereal Chemistry, 49: 664–676. CHOPIN (1995): Chopin Tribune No. 2 Research Applica-tion. [Online] Available at http://www.fracop.pl/dane/ web_articles_files/790/chopin-tribune-no-02-english.pdf Codină G.G., Voica D.V. (2010): The influence of different forms of backery yeast Saccharomyces cerevisie type strain on the concentration of individual sugars and their utili-zationduring fermentation. Romanian Biotechnological Letters, 14: 5417–5422.
Czuchajowska Z., Pomeranz Y. (1993): Gas formation and gas retention. I. The system and methodology. Cereal Foods World, 38: 499–503.
Henry R.J., Saini H.S. (1989): Characterization of cereal sug-ars and oligosaccharides. Cereal Chemistry, 66: 362–365. ICC (2010): Standard Methods of the International Association for Cereal Chemistry, 104/1, 105/2, 106/2, 107/1. Interna-tional Association for Cereal Science and Technology, Vienna. Kotrlik J.W., Williams H.A. (2003): The incorporation
of effect size in information technology, learning, and performance research. Information Technology, Learning and Performance Journal, 21:1–7.
Ktenioudaki A., Butler F., Gallagher E. (2011): Dough characteristics of Irish wheat varieties II. Aeration profile and baking quality. LWT-Food Science and Technology, 44: 602–610.
Langemeier J.M., Rogers D.E. (1995): Rapid method for sugar analysis of doughs and baked products. Cereal Chemistry, 72: 349–351.
Li B.W., Schuhmann P.J., Wolf W.R. (1985): Chroma-tographic determinations of sugar and starch in a diet composite reference material. Journal of Agricultural and Food Chemistry, 33: 531–536.
McCleary B.V., Charnock S.J., Rossiter P.C., O’Shea M.F., Power A.M., Lloyd R.M. (2006): Measurement of carbohydrates in grain, feed and food. Journal of the Science of Food and Agriculture, 86: 1648–1661. Nechita V. (2008): Correction of flours with alpha-amilase
deficit taking into account dough’s damage. Food and Environment Safety, 7: 8–10.
Potus J., Poiffait A., Drapron R. (1994): Influence of dough-making conditions on the concentration of indi-vidual sugars and their utilization fermentation. Cereal Chemistry, 71: 505–508.
Rubenthales G.L., Finney P.L., Demaray D.E., Finney K.F. (1980): Gasograph: design, construction, and repro-ductibility of a sensity 12-channel gas recording instru-ment. Cereal Chemistry, 57: 212–216.
Sahlstrom S., Park W., Shelton D.R. (2004): Factors influencing yeast fermentation and the effect of LMW sugars and yeast fermentation on hearth bread quality. Cereal Chemistry, 81: 328–335.
Shieh K.K., Donnelly J., Scallet B.L. (1973): Reaction of oligosaccharides. IV. Fermentability by yeasts. Cereal Chemistry, 50: 169–175.
Shuey W.C. (1975): Practical instruments for rheological measurements of wheat products. Cereal Chemistry, 52: 42–81.
SR 90 (2007): Wheat flour. Analysis method. Romanian Standards Association (ASRO), Bucharest.
Švec I., Hrušková M. (2004): Wheat flour fermentation study. Czech Journal of Food Sciences, 22: 17–23. Tseng Y.H., Yang J.H., Li R.H., Mau J.L. (2010):
Qual-ity of bread supplemented with silver ear. Journal Food Quality, 33: 59–71.
Verstrepen K.J., Iserentant D., Malcorps P., Derde-linckx G., Van Dijck P., Winderickx J., Pretorius I.S., Thevelein J.M., Delvaux F.R. (2004): Glucose and sucrose: hazardous fast-food for industrial yeast?Trends in Biotechnology, 22: 531–537.
Received for publication May 22, 2012 Accepted after corrections October 23, 2012
Corresponding author: