Effect of Difference in Young’s Moduli between Surface-Layer
and Substrate on Fatigue Strength
Tatsuro Morita
1, Yusuke Iwasaki
2and Kazuhiro Kawasaki
31
Department of Mechanical & System Engineering, Kyoto Institute of Technology, Kyoto 606-8585, Japan 2MC Division, Yamaha Motor Co., Ltd., Shizuoka 438-8501, Japan
3Technical Department, Neturen Co., Ltd., Kanagawa 254-0013, Japan
The effects of a surface-layer whose Young’s modulus is lower than that of the substrate on the fatigue strength were studied. Pure iron plates possessing pure titanium layers on the both sides were prepared as a model material. The formation of the titanium layer remarkably improved the fatigue strength of pure iron. In addition to the fatigue test, we made a calculation of the image stress which acts on a dislocation due to the discontinuity of the elastic constants at the surface and interface. As a result, it was found that the absolute value of image stress in the vicinity of the surface becomes smaller as the elastic modulus of the surface-layer is decreased. From the results of the above experiment and calculation, it was thought that the improvement of the fatigue strength with the formation of the titanium layer was caused by the reduction in the remote applied stress and image stress acting on dislocations near the surface.
(Received March 11, 2004; Accepted May 18, 2004)
Keywords: fatigue strength, bonded material, surface-layer, Young’s modulus, shear modulus, dislocations, image stress
1. Introduction
It is well known that fatigue cracks of metals are generally initiated from the surface through the formation of the intrusion and extrusion under an alternating stress.1,2) To improve the fatigue strength, the surface must be protected from the generation of slip steps to a high stress amplitude level. The important point for this purpose is how to arrest the dislocations escaping from the inside to the surface.
The restraint of dislocations is generally achieved by either the increase of friction stress or the reduction in applied stress. The established surface modification methods such as nitriding or carburizing and quenching are mainly based upon the former effect. On the other hand, the stress applied to the surface can be decreased by the formation of surface-layers with a Young’s modulus lower than that of the substrate. In this case, since the surface can be protected by the stress redistribution due to the difference of Young’s moduli, a remarkable improvement in the fatigue strength is expected. This study was conducted to obtain basic data for improving the fatigue strength through the formation of a surface-layer whose Young’s modulus is less than that of the substrate. As a model material, pure iron specimens possess-ing pure titanium layers on the both sides were prepared and they were subjected to the plane bending fatigue test. Besides, to predict the behavior of dislocations in the bonded material, we further calculated the image stress which acts on the dislocations due to the discontinuity of the elastic constants at the surface and interface.3–6)
2. Experiments and Modeling
2.1 Experimental methods
The bonded material used in this study was made as follows: As shown in Fig. 1, after putting pure copper sheets (55mmthickness) between a pure iron plate (4 mm thickness) and two thin plates of pure titanium (0.5 mm thickness), they were fixed by supports and were heated at 1223 K for 1.8 ks in
air. The insertion of the copper sheets was intended to bond strongly between the different kinds of metals by forming a diffusion zone at the interface.7) Uniform pure iron and
[image:1.595.332.520.337.456.2]titanium plates for comparison were annealed at the same heating condition as the bonded material. In addition, the chemical compositions of the used materials are listed in Table 1.
The above bonding condition was chosen from the three temperatures of 1123, 1173 and 1223 K. The heating time was fixed at 1.8 ks. For all conditions, we conducted metallographic examination, measurement of hardness pro-files and electron probe microanalysis.
Figure 2 shows the configuration of fatigue specimens. All oxide and nitrid formed during the heating were completely eliminated by machining. The corners of specimens were
[image:1.595.306.549.507.585.2]Fig. 1 Illustration of the method to bond the materials.
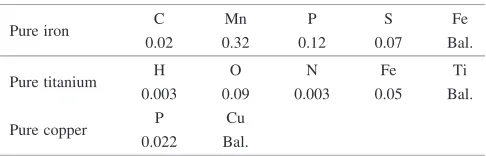
Table 1 Chemical compositions (mass%).
Pure iron C Mn P S Fe
0.02 0.32 0.12 0.07 Bal.
Pure titanium H O N Fe Ti
0.003 0.09 0.003 0.05 Bal.
Pure copper P Cu
0.022 Bal.
carefully scraped and the specimen surfaces were finished with emery papers (1002000mesh) and alumina powders (diameter: 0.03mm). Finally, notches (stress concentration factor: 3) were made at the center of the both surfaces through an electron discharge process to limit the places where fatigue cracks form.
For the bonded and pure titanium specimens, the residual stress was measured on the surface using X-ray technique (X-ray: Co K, diffracting plane: (311), Young’s modulus: 110 GPa, Poisson’s ratio: 0.321). The plane bending fatigue test was carried out at the frequency of 33 Hz and stress ratio ofR¼ 1in air. The fracture surface was investigated with a scanning electron microscope. In addition, the stress ampli-tude was calculated by a¼M=Z, where M is the applied
bending moment andZ is the section modulus of the tested region.
[image:2.595.70.270.71.240.2]2.2 Calculation of applied stress distribution
Figure 3 shows a model of bonded materials under a bending moment M. For simplicity, it is assumed that no intermediate layer exists and strain is continuous through the interface. The Young’s moduli of the substrate and surface-layer are represented by E1 and E2, respectively. Their geometrical moment of inertia are I1¼2wt13=3 and I2¼2wðt23t13Þ=3. The tensile stress distribution ofxðyÞ
is derived by a simple calculation8)as
xðyÞ ¼
E1My E1I1þE2I2
ð0<y<t1Þ;
¼ E2My
E1I1þE2I2
ðt1<y<t2Þ:
ð1Þ
After substituting I1 and I2 into the above equation and normalizing, we obtain
2wt2 2
3M xðy=t2Þ ¼
y=t2
ðt1=t2Þ3þ ðE2=E1Þf1 ðt1=t2Þ3g
ð0<y=t2 <t1=t2Þ;
¼ ðE2=E1Þðy=t2Þ
ðt1=t2Þ3þ ðE2=E1Þf1 ðt1=t2Þ3g
ðt1=t2 <y=t2<1Þ:
ð2Þ
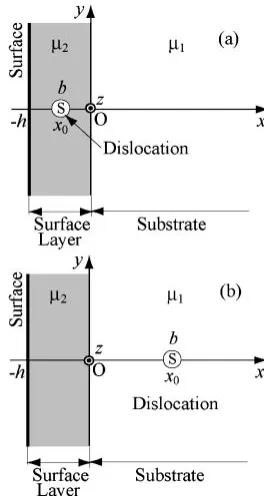
2.3 Calculation of image stress acting on dislocation We calculate the image stress acting on a screw dislocation due to the discontinuity of the shear moduli at the surface and interface, using the concept of image dislocations.3–6)
Although the dislocation may be an edge one, the above calculation can give a good approximation for that case without complications introduced by the difference in Poisson’s ratios.
Figure 4 shows the analysis model. The coordinates are settled as shown in this figure. The thickness of the surface-layer ish. A discrete screw dislocation with a Burger’s vector
b is located at x0 on the x axis. The shear moduli of the substrate and the layer are represented by 1 and 2, respectively.
When the dislocation is situated in the surface-layer (Fig. 4(a)), the image stress can be derived by the same calculation as Head.3)Namely, we satisfy alternately both the condition
that the traction stress is zero at the surface
xzIIðh;yÞ ¼0 ð3Þ
and the condition that the traction stresses and displacements are continuous through the interface
Ixzð0;yÞ ¼IIxzð0;yÞ; uIzð0;yÞ ¼uIIzð0;yÞ; ð4Þ
using the method of image dislocations. In the above
Fig. 2 Configuration of fatigue specimens (mm).
Fig. 3 Model of the bonded material.
Fig. 4 Model for the calculation of the image stress acting on a dislocation:
(a) in the surface-layer; (b) in the substrate.
[image:2.595.322.546.75.177.2] [image:2.595.357.489.506.754.2] [image:2.595.52.287.702.768.2]equation, the subscripts ‘‘I’’ and ‘‘II’’ show the values related to the substrate and surface-layer, respectively. Using the obtained Burger’s vector of image dislocations, we can derive the image stress acting on the dislocation as
yz¼
2b
4
x0
þX
1
k¼1
k1 1
x0þkh
þ
2
x0kh
( )
ðh<x0<0Þ;
ð5Þ
where ¼ ð21Þ=ð2þ1Þ. After normalizing, we finally obtain
yz
1 h
b ¼
1 4
2
1
x0=h
þX
1
k¼1
k1 1
x0=hþk
þ
2
x0=hk
( )
ð1<x0=h<0Þ:
ð6Þ
If the dislocation exists in the substrate (Fig. 4(b)), the image stress applied to the dislocation has been given by
Head3)as
yz¼
1b
4
x0
ð12ÞX
1
k¼1
k1
x0þkh
( )
ðx0>0Þ: ð7Þ
After normalizing and arranging the equation, we obtain
yz
1 h
b ¼
1 4
x0=h
ð12ÞX
1
k¼1
k1 x0=hþk
( )
ðx0=h>0Þ:
ð8Þ
In addition, the sign of the stress in eqs. (6) and (8) is assumed to be positive when a positive dislocation is forced to move in the positivexdirection.
3. Results and Discussions
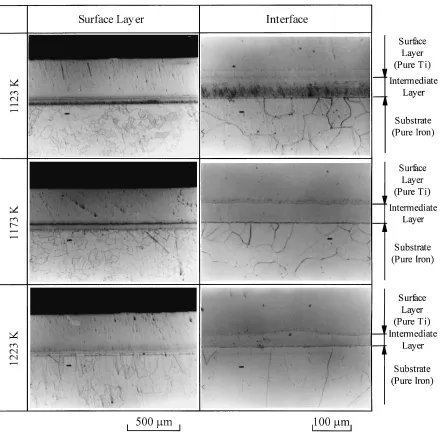
3.1 Effect of heating temperature on bonding condition Figure 5 shows the aspect of the titanium layer and the picture enlarged around the interface. Thickness of the titanium layer was about 350mm. For all heating
[image:3.595.80.522.69.506.2]atures, while there was no flaw along the interface, an intermediate layer was observed. The thickness of the intermediate layers at 1123 K and 1173 K (50mm) was about the same as the initial thickness of the copper sheet (55mm). On the other hand, it was relatively shallow at 1223 K (31mm) since the intermetallic compound between titanium and copper melted during heating and it run out from the sides of the specimens.
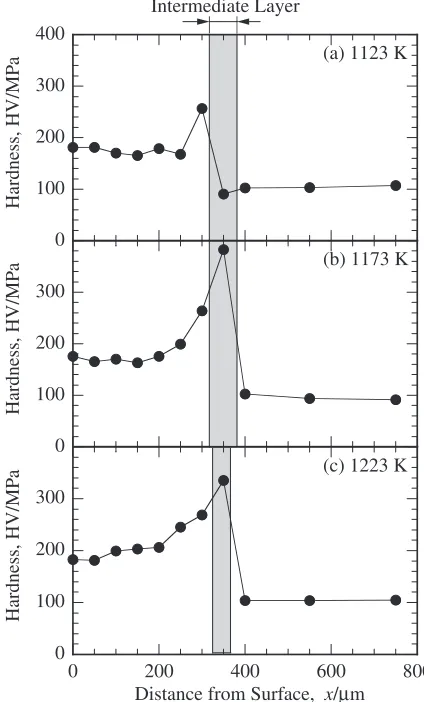
Figure 6 shows the concentration profiles of titanium, copper and iron across the interface. Figure 7 shows the hardness profiles measured from the surface to the inside. In case of 1123 K (Fig. 6(a)), the concentration of copper was 100 mass% in the intermediate layer and most of the inserted copper remained with no significant diffusion. Accordingly, the hardness in the layer was about 90 HV which is the same as that of pure copper (Fig. 7(a)).
With increasing heating temperature, the diffused amount of the elements increased (Figs. 6(b), (c)). Titanium and copper remarkably diffused with each other. Diffusion between copper and iron was also found although their diffused amounts were relatively small. In the titanium layer, corresponding to the amount of diffused copper, the hardness increased from the surface to the interface (Figs. 7(b), (c)). On the substrate side, since the amounts of the diffused copper and titanium were small, the increase in hardness was unremarkable.
To obtain sufficient bonding strength, we prefer the
diffusion amounts of the elements to be high as possible unless thick brittle intermetallic compounds are formed. From this viewpoint, the heating temperature of 1223 K was selected for the fatigue test specimens.
3.2 Fatigue strength
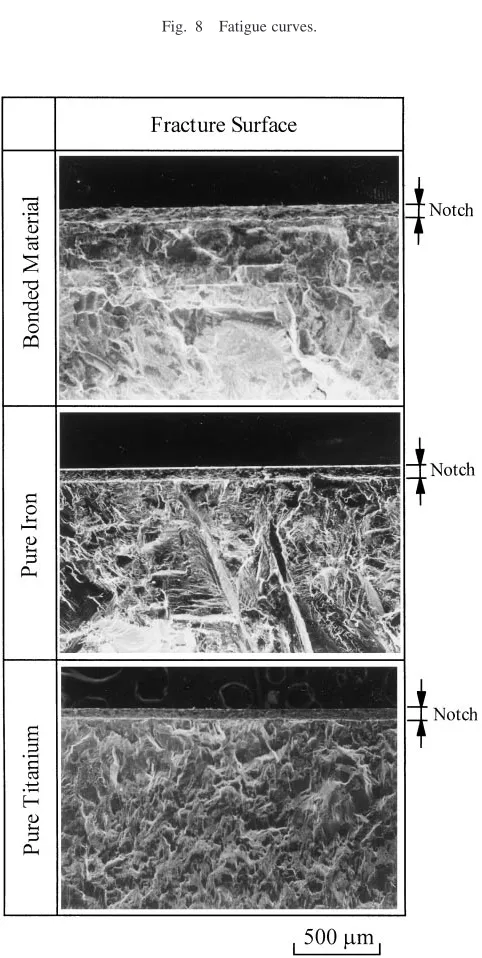
Figure 8 shows the results of the fatigue test. The features of the fracture surfaces are shown in Fig. 9. The mechanical properties, grain size and the residual stress measured on the surface are listed in Table 2. From Fig. 8, it is clearly seen that both the cycles to failure and the fatigue strength of the bonded material ( ) are higher than those of pure iron ( ). In the bonded material, since the crack initiated from the notch root as well as the uniform materials (Fig. 9), its fatigue strength was determined by the stress amplitude applied to the titanium layer.
The improvement of the fatigue strength with the formation of the titanium layer can result from the reduction in the stress applied to the layer due to the difference in Young’s moduli. Substituting the real values concerning the bonded material, that is,t1=t2¼0:87andE2=E1¼0:53, into eq. (2), we obtain the stress distribution shown in Fig. 10. According to this calculation, the stress in the titanium layer decreases to a value of 0.63 times that of the uniform materials (E2=E1¼1) although the stress in the substrate is increased. At the fatigue strength of the bonded material 0
20 40 60 80
-75 -50 -25 0 25 50 75
Concentration (%)
Disthance from Center of Intermediate Layer, x/µm Cu
Ti Fe
(c) 1223 K 0
20 40 60 80 100
Concentration (%)
Cu
Ti Fe
(a) 1123 K
0 20 40 60 80
Concentration (%)
Cu
Ti Fe
(b) 1173 K Intermediate Layer
Fig. 6 Concentration profiles near the interface.
0 100 200 300
0 200 400 600 800
Hardness, HV/MP
a (c) 1223 K
Distance from Surface, x/µm Intermediate Layer
0 100 200 300
Hardness, HV/MP
a (b) 1173 K
0 100 200 300 400
Hardness, HV/MP
a (a) 1123 K
Fig. 7 Hardness profiles.
[image:4.595.63.266.72.407.2] [image:4.595.318.530.76.427.2](130 MPa), the real maximum bending stress applied to the titanium layer is estimated as 1300:63¼82MPa. This value is about the same as the fatigue strength of the uniform pure titanium (70 MPa).
As the other factors affecting the fatigue strength of the bonded material, we can consider the hardness profile in the surface-layer and the residual stress measured on the surface. The hardness near the interface was increased by the diffusion of copper, as mentioned the previous section (Figs. 6(c), 7(c)). However, the hardness of the bonded material near the notch root (depth: 90mm) where the fatigue crack initiated was about the same as that of uniform pure titanium. On the other hand, although there is a difference in the residual stresses between the bonded and uniform materials (Table 2), the difference is relatively small. Therefore, it is thought that those two factors had no significant influence on the fatigue strength.
From the above considerations, we can conclude that the improvement of the fatigue strength is achieved by the stress redistribution through the formation of the surface-layer with a Young’s modulus lower than that of the substrate unless the proper fatigue strength of the surface-layer is strikingly low. This effect is supposed to be potentially valid to improve the fatigue strength of metals in engineering applications.
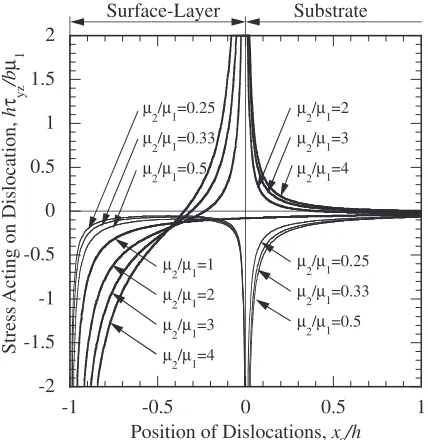
3.3 Image stress acting on a dislocation
Figure 11 shows the change of the image stress calculated from eqs. (6) and (8). Near the interface on the layer side, the dislocation is pushed to the surface in the case of2=1 <1
50 100 150 200 250
104 105 106 107
Stress Amplitude,
σa
/MP
a
a
Cycles to Failure
Bonded Material Pure Iron Pure Titanium
Fig. 8 Fatigue curves.
[image:5.595.63.281.75.287.2]Fig. 9 Features of fracture surfaces.
Table 2 Mechanical properties, grain size and residual stress.
E/GPa 0:2/MPa TS/MPa
(%) d/mm R/MPa
Pure iron 210 215 305 77 191 —
Pure
titanium 110 295 400 41 141 133
Bonded
(1223 K) 204 170 310 —
189 (Substrate)
137 (Layer) 10661
E: Young’s modulus,0:2: 0.2% Offset stress,TS: Tensile strength,:
Reduction of area,d: Grain size,R: Residual stress.
0 0.2 0.4 0.6 0.8 1 1.2
0 0.2 0.4 0.6 0.8 1
T
ensile Stress, 2
wt
2
2 σ
x
/3
M
Position, y/t 2 t
1/t2= 0.87 E1/E2= 0.53
E 1/E2= 1
Interf
ace
Surf
[image:5.595.304.549.86.166.2]ace
[image:5.595.319.530.221.392.2] [image:5.595.49.290.289.768.2]while it is attracted to the interface in the case of2=1>1. In the vicinity of the interface on the substrate side, the dislocation is attracted to the interface in the case of2=1<
1 while it is pushed away from the interface in the case of
2=1>1.
When the fatigue fracture occurs at the interface, the behavior of dislocations near the interface should be fully considered. However, in this study, since the fatigue crack initiated from the surface-layer, the important point to estimate the fatigue strength is the behavior of dislocations near the surface. As shown in Fig. 11, although the surface attracts dislocations in all cases, the absolute value of the image stress is decreased with the decrease of the ratio
2=1. From this result, it can be considered that the decrease of the image stress near the surface with the
formation of the titanium layer contributes to the improve-ment of the fatigue strength.
4. Conclusions
(1) The fatigue strength of pure iron was increased by creating the pure titanium layer. This improvement mainly resulted from the reduction in the stress applied to the surface-layer due to the difference in Young’s moduli between the layer and the substrate.
(2) At the fatigue strength of the bonded material, the real stress amplitude applied to the titanium layer was about the same to the fatigue strength of pure titanium. This agreement showed that the fatigue strength of the bonded material is mainly determined by the proper fatigue strength of the surface-layer and the true stress amplitude applied to the layer.
(3) The calculation of the image stress acting on a dislocation due to the discontinuity of the elastic constants showed that the absolute value of the image stress is decreased with the decrease of the shear moduli ratio between the surface-layer and substrate. From this result, it can be considered that the decrease of the image stress near the surface with the formation of the titanium layer contributes to the improve-ment of the fatigue strength.
REFERENCES
1) P. J. E. Forsyth: Proc. Roy. Soc.A242(1958) 198–197.
2) A. Hunche and P. Neumann: Acta Metall.34(1986) 207–217.
3) A. K. Head: Philos. Mag.44(1953) 92–94.
4) R. Weeks, J. Dunders and M. Stippes: Int. J. Engng. Sci.6(1968) 365–
372.
5) T. Morita, K. Saito and M. Shimizu: Theoretical and Applied Mechanics
44(1995) 137–144.
6) T. Morita, S. Araki and K. Saito: Theoretical and Applied Mechanics49
(2000) 289–297.
7) A. Yamamoto, H. Nakamura, Y. Nishiyama and R. Kurahashi:
Shinnittetsu Technical Report352(1994) 30–34 (in Japanese).
8) T. Ogawa and K. Tokaji: J. Mech. Behav. Mater.11(2000) 265–273.
-2 -1.5 -1 -0.5 0 0.5 1 1.5 2
-1 -0.5 0 0.5 1
Stress Acting
on
Dislocation,
h
τ yz
/b
µ 1
Position of Dislocations, x 0/h
µ2/µ
1=0.25
µ2/µ
1=0.33
µ
2/µ1=0.5
µ2/µ
1=0.25
µ2/µ
1=0.33
µ2/µ
1=0.5
µ
2/µ1=1
µ2/µ
1=2
µ2/µ
1=3
µ
2/µ1=4
µ2/µ
1=2
µ2/µ
1=3
µ
2/µ1=4
[image:6.595.63.277.74.294.2]Surface-Layer Substrate
Fig. 11 Change of image stress acting on a dislocation.