Physical and Sensory Properties of Bread Enriched
with Phenolic Aqueous Extracts from Vegetable Wastes
Antonietta BAIANO, Ilaria VIGGIANI, Carmela TERRACONE, Roberto ROMANIELLO and Matteo Alessandro DEL NOBILE
Department of the Sciences of Agriculture, Food and Environment, University of Foggia, Foggia, Italy
Abstract
Baiano A., Viggiani I., Terracone C., Romaniello R., Del Nobile M.A. (2015): Physical and sensory proper-ties of bread enriched with phenolic aqueous extracts from vegetable wastes. Czech J. Food Sci., 33: 247–253.
The water of the breads was replaced with phenolic aqueous extracts from chicory, cabbage, celery, fennel, olive leaf, or grape marc wastes obtained through microwave-assisted extraction. The highest phenolic concentrations were found in the grape marc and in the bread enriched with it. The highest antioxidant activity values were measured in the crust of bread produced with the grape marc extract and in the crumb of bread with olive leaf extract. Generally, the replacement of water caused significant decreases of the specific volume, the shift of the crumb colour towards redder and yellower tones, and modification of gustatory and tactile attributes.
Keywords:antioxidant activity; functional food; phenolic compounds; sensory properties
In the traditional bread-making process, cereal flour, water, salt, and yeasts are mixed to make a vis-coelastic dough that is then submitted to fermentation and baking (Sivam et al. 2010) operations. Since bread is an important component in the daily diet of most people around the world, it may be used to deliver fibre polysaccharides, prebiotics, polyunsaturated fatty acids, and phenolic compounds.
A simple way to fortify bread and other products whose processing includes the formation of dough consists in using an aqueous extract of antioxidants as water substitute. Many extracts of plants poten-tially usable in the food industry have been described (Bucić-Kojić et al. 2011; Radojkovic et al. 2012). The proposed extraction methods differ from each other although all of them include the use of hy-droalcoholic solutions that are not suitable to be incorporated into foods. The microwave-assisted extraction using water as a solvent shows several advantages, including rapidity and reduction of en-vironmental hazards.
By-products derived from the production of mini-mally processed vegetables could be a rich and cheap source of antioxidants. In fact, the increasing demand
for processed plant products has led to a substantial increase of solid wastes.
The work described in the present study was aimed at waste valorisation and production of functional bread by replacing water with aqueous extracts of solid wastes from celery, chicory, cabbage, fennel, olive leaves, and grape marc.
MATERIAL AND METHODS
Plant material. The solid wastes derived from industries producing ready-to-use vegetables and located in the south of Italy. They were represented by external leaves and stems of chicory, celery, cab-bage, and fennel, olive leaves, and grape marc.
Bread production. Seven types of bread were produced: a control and six breads in which the water was replaced by the aqueous extracts. The raw materials used to produce the bread samples were a soft wheat flour of type 0 (535.0 ± 2.1 g), tap water or aqueous extracts (300.2 ± 1.2 ml), sucrose (14.2 ± 0.5 g), salt (14.3 ± 0.3 g), and active dried Saccharomyces cerevisiae (7.2 ± 0.3 g).
The baking procedure was carried out in a loaf pan (17 cm in length, 13 cm in width) put in a bread-making machine PaneExpress (Ariete, Prato, Italy). It included the following steps: 1st kneading 5 min; break 5 min; 2nd kneading 20 min; 1st leavening 39 min; 1st fast stir-ring 10 s; 2nd leavening 30 min; 2nd fast stirring 10 s; further leavening 59 min; cooking 52 minutes.
After baking, the bread loaves were cooled and weighed. Subsequently, crust and crumb were sepa-rated and analysed.
Extraction of phenolic compounds.The phenolic fraction of crust or crumb was extracted according to the method reported in Zielinski et al. (2008) and analysed to determine the total phenolic content and the antioxidant activity.
Total phenolic content.It was determined accord-ing to the Folin-Ciocalteu method (Gorinstein et al. 2000) and expressed as mg of gallic acid equivalents per 100 ml of solid waste extract or as mg/kg of wet or dry crust and crumb.
Evaluation of the antioxidant activity. The antioxidant activity of the phenolic extracts was evaluated according to the ABTS [2,2'-azino-bis(3-ethyl- benzothiazoline-6-sulfonic acid)] (Re et al. 1999) and DPPH (2,2-diphenyl-1-picrylhydrazyl) (Brand-Williams et al. 1995) assays.
Results were expressed as mmol of Trolox equivalent per 100 ml of solid waste extract or as mmol of Trolox equivalent per kilogram of wet or dry crust and crumb. Physical analyses of vegetable waste extracts and bread samples.The pH values of the vegetable waste extractswere measured using an Ion/pH/mV/ Temperature bench meter (Oakton Instruments, Vernon Hills, USA). Moisture was measured on crust and crumb according to the AACC method (2003). The loaf volume was measured by the rapeseed dis-placement method and then divided by loaf weight to obtain specific volume (g/cm3).
Image analysis of bread slices. A computer vision system (CVS) was used for 24 bit image acquisition of bread slices. The CVS was equipped with a Canon EOS 00D digital colour camera (Canon, USA) located vertically over the matte black background at a distance
of 0.45 m. As standard setting conditions, the viewing/ illuminating geometry was about 0/45. The images were acquired with the resolution of 3888 × 2592 pixels and stored in TIFF format. The image processing software was performed using the MATLAB v. 7.12 (MathWorks, Natick, USA) image processing toolbox.
The fields of view of the RGB images were seg-mented by principal components method (Gonzalez et al. 2004) in order to individuate the crumb cell region and calculate some morphological parameters such as mean cell area and eccentricity. The eccen-tricity is the ratio of the distance between the foci of the ellipse and its major axis length. The value is between 0 and 1, with 0 (circle) and 1 (line segment) being degenerated cases.
The colour of the bread crumb were calculated in L*, a*, and b* units using the function of the MATLAB v. 7.12 image processing toolbox.
Sensory evaluation. The bread samples were analysed by conventional sensory profiling using seven trained panellists. The judges were selected and trained according to the guidelines in ISO/DIS 8586-1:1989 (Draft International Standard. Sen-sory analysis–Methodology–General guidance for the selection, training and monitoring of assessors. Part 1: Selected assessors) and the method for sensory profiling according to ISO 6564:1985 (International Standard. Sensory analysis–Methodology–Flavor profile methods).
The trained judges used a consensus list of 22 sen-sory attributes. A continuous non-structured scale was used for the evaluation. The left side of the scale corresponded to the lowest intensity (value 0) while the right side corresponded to the highest intensity (value 9). Breads were cut into slices (1.5 cm thick) that were served after two hours from preparation in a randomised order. Three samples were served in each session (one session per day). Between two tastings, panellists cleaned their mouth with tap water (20°C).
RESULTS AND DISCUSSION
Determination of total phenolic content. The phenolic concentrations of the waste extracts, ex-pressed as mg/100 ml, were in a descending order: grape marc 142.84 ± 8.20, olive leaves 88.96 ± 1.30, cabbage 27.41 ± 1.62, chicory 23.58 ± 1.24, fennel 18.70 ± 0.58, and celery 8.16 ± 0.19. The total phe-nolic contents of the breads are reported in Table 1. The first interesting evidence is the higher results
[image:3.595.63.532.124.254.2]of the Folin-Ciocalteu reaction applied to crust with respect to those referred to crumb in 5 (control, and with chicory, celery, fennel, or grape marc extracts) of the 7 types of breads. This difference was due to the contribution of the Maillard reaction products to the overall antioxidant contents of crust. In fact, the antioxidant properties are among the most in-teresting biological activities associated with such newly formed compounds (Delgado-Andrade & Morales 2005). Other bread components can Table 1.Folin-Ciocalteu reaction applied to breads (crust and crumb) enriched with vegetable waste extracts
Types of bread Wet crust Dry crust Wet crumb Dry crumb
(mg gallic acid eq/kg)
Control 554.96 ± 75.55a 799.65 ± 108.87a 270.24 ± 48.57b 489.67 ± 88.00b
With chicory extract 574.91 ± 80.09a 777.87 ± 108.36a 347.00 ± 56.86c 592.99 ± 97.16c
With celery extract 556.03 ± 35.84a 729.07 ± 47.00a 239.65 ± 9.75a 405.25 ± 16.49a
With cabbage extract 647.64 ± 98.93b 892.38 ± 136.31b 629.47 ± 68.21e 1053.60 ± 223.68f
With fennel extract 750.86 ± 66.35c 1034.78 ± 91.45c 373.22 ± 32.08d 687.23 ± 59.06d
With olive leaf extract 530.89 ± 65.98a 777.79 ± 74.52a 731.51 ± 90.91f 820.14 ± 102.53e
With grape marc extract 790.67 ± 67.53c 1115.56 ± 95.28d 618.45 ± 90.35e 951.56 ± 152.59f
In columns, for each sample, different lowercase letters indicate significant differences (P < 0.05) between control bread and breads with phenolic extracts of the waste vegetable
Table 2.Antioxidant activity of breads (crust and crumb) enriched with vegetable waste extracts, as measured by the DPPH (2,2-diphenyl-1-picrylhydrazyl) assay and ABTS [2,2‘-azinobis-(3-ethylbenzothiazoline-6-sulfonic acid)]
Types of bread Trolox (mmol/eq/kg)
wet crust dry crust wet crumb dry crumb
DPPH
Control 0.09 ± 0.02b 0.13 ± 0.02c 0.04 ± 0.01b 0.07 ± 0.01b
With chicory extract 0.13 ± 0.02c 0.18 ± 0.03d 0.05 ± 0.01b 0.09 ± 0.01b
With celery extract 0.05 ± 0.02ab 0.09 ± 0.02b 0.02 ± 0.01a 0.01 ± 0.01a
With cabbage extract nda nda nda nda
With fennel extract nda nda nda nda
With olive leaf extract 0.16 ± 0.03d 0.22 ± 0.04e 0.48 ± 0.06d 0.64 ± 0.08d
With grape marc extract 0.23 ± 0.04e 0.32 ± 0.06f 0.18 ± 0.03c 0.32 ± 0.05c
ABTS
Control 1.60 ± 0.30bc 2.30 ± 0.44b 0.84 ± 0.01d 1.51 ± 0.02d
With chicory extract 1.29 ± 0.23a 1.75 ± 0.30a 0.65 ± 0.04b 1.11 ± 0.07b
With celery extract 1.32 ± 0.12ab 1.73 ± 0.16a 0.55 ± 0.06a 0.93 ± 0.10a
With cabbage extract 1.71 ± 0.28c 2.36 ± 0.38b 0.75 ± 0.11c 1.27 ± 0.17c
With fennel extract 1.24 ± 0.22a 1.70 ± 0.30a 0.54 ± 0.10a 1.00 ± 0.18ab
With olive leaf extract 1.43 ± 0.27b 1.93 ± 0.37ab 0.87 ± 0.17d 1.35 ± 0.25c
With grape marc extract 1.87 ± 0.33c 3.15 ± 0.56c 1.39 ± 0.13e 2.34 ± 0.23e
[image:3.595.64.533.475.735.2]contribute to the total antioxidant content. An ex-ample is represented by the phenolic compounds present in wheat flour or added, although they can be degraded by heat (Del Castillo et al. 2002). The highest results of the Folin-Ciocalteu reaction were obtained on the crust of bread enriched with grape marc and fennel extracts, while control bread, and bread enriched with chicory, celery, and olive leaf extracts showed the lowest values. Concerning crumbs, the lowest values were detected in the bread enriched with celery extract, while the breads with cabbage and grape marc extracts showed the highest concentrations on a dry basis.
The values of the ratio between phenolic concentra-tion in crumb and phenolic concentraconcentra-tion in crust, referred to the wet weight, were in a descending order as follows: olive leaf (1.38), cabbage (0.97), grape marc (0.78), chicory (0.60), fennel (0.50), control (0.49), and celery (0.43). The values of this ratio, on dry matter basis, followed a similar order, with the exception of the inversion between olive leaf and cabbage: cabbage
(1.18), olive leaf (1.05), grape marc (0.85), chicory (0.76), fennel (0.66), control (0.61), and celery (0.56). These peculiar distributions of phenolics between crust and crumb are related to the nature of the baking process and of the type of phenolic compounds. Since the temperature of the crumb never exceeds 100°C while the crust reaches temperatures higher than 205°C, heating may alter the phenolic antioxidants to different extents and in different ways in the inner and outer part of the loaf (Sivam et al. 2010). Furthermore, different stability is detected among the individual phenolics (Wang & Zhou 2004). According to Horszwald et al. (2009), the same Maillard reaction products, able to react with the Folin-Ciocalteu reagent, can bind polyphenols to their protein backbones. The reduc-tion of phenolic content could be just associated with the interactions between phenolic antioxidants and wheat proteins via hydrogen bonding during dough preparation (Wang & Zhou 2004).
Determination of bread antioxidant capac-ity. The DPPH assay measures the overall radical-Table 3.Physical characteristics of breads enriched with vegetable waste extracts
Types of bread crustMoisture (%)crumb Volume (cm3) Weight (g) Specific volume (cm3/g)
Control 30.6 ± 4.0c 44.8 ± 6.2abc 2320.5 ± 15.0c 715.7 ± 10.5a 3.24 ± 0.02e
With chicory extract 26.15 ± 0.8b 41.55 ± 0.3a 2231.2 ± 10.2b 769.9 ± 5.5b 2.90 ± 0.03b
With celery extract 23.75 ± 0.3a 40.95 ± 0.8a 2244.0 ± 5.0b 775.4 ± 9.5c 2.89 ± 0.05b
With cabbage extract 27.42 ± 2.70b 44.45 ± 0.33c 2016.0 ± 10.3a 788.9 ± 3.5d 2.56 ± 0.05a
With fennel extract 27.44 ±2.33b 45.69 ± 1.36c 2371.8 ± 5.6d 765.2 ± 5.4b 3.10 ± 0.04d
With olive leaf extract 26.06 ± 2.39b 44.39 ± 0.35c 2016.0 ± 8.7a 777.7 ± 6.6c 2.59 ± 0.07a
With grape marc extract 29.12 ± 2.07c 42.16 ± 0.18b 2392.0 ± 6.5e 785.3 ± 7.0d 3.05 ± 0.08c
[image:4.595.64.533.128.257.2]In columns, for each sample, different lowercase letters indicate significant differences (P < 0.05) between control bread and breads with phenolic extracts of the waste vegetable
Table 4.Image analysis of control bread and breads enriched with vegetable waste extracts
Descriptors Control With chicory extract With celery extract With cabbage extract With fennel extract With olive leaf extract marc extractWith grape Morphological parameters
Cell area (mm2) 0.98 ± 0.09a 1.35 ± 0.43a 0.90 ± 0.43a 1.28 ± 0.35a 1.37 ± 0.65a 1.27 ± 0.31a 1.58 ± 0.76a
Cell eccentricity 0.78 ± 0.02a 0.76 ± 0.04a 0.77 ± 003a 0.76 ± 0.03a 0.78 ± 0.04a 0.80 ± 0.04a 0.80 ± 0.03a
Chromatic parameters of crumb
L* 64.53 ± 0.89e 38.78 ± 1.44b 64.07 ± 1.32e 56.74 ± 1.24d 56.75 ± 1.89d 54.94 ± 1.61d 27.88 ± 1.72a
a* 1.33 ± 0.32a 4.21 ± 0.55c 0.96 ± 0.53a 3.43 ± 0.25b 2.58 ± 0.32b 3.27 ± 0.72bc 7.51 ± 0.63d
b* 21.07 ± 0.28b 23.59 ± 0.72c 20.82 ± 0.42b 27.29 ± 0.22d 26.73 ± 0.22d 26.34 ± 0.69d 4.99 ± 0.67a
[image:4.595.64.531.609.734.2]scavenging activity of a sample whereas the ABTS assay is generally used to screen the relative radical-scavenging abilities of flavonoids and phenolics. Ac-cording to the DPPH assay, the antioxidant activity of the vegetable extracts, expressed as mmol Trolox eq/100 ml, was in a descending order as follows: grape marc 239 ± 25, olive leaves 141 ± 11, cabbage 18 ± 3, fennel 19 ± 1, chicory 4 ± 1, and celery 1 ± 0. Based on the ABTS assay, the values were: grape marc 1145 ± 110, olive leaves 383 ± 35, cabbage 65 ± 8, fennel 54 ± 6, chicory 33 ± 3, and celery 15 ± 2. The linear regres-sion between DPPH and ABTS values of the extracts showed a high correlation coefficient (R = 0.99, P < 0.05). Table 2 shows the antioxidant activity of crust and crumb of enriched and control breads. Based on the DPPH results of the bread crust, the antioxidant activity was: grape marc > olive leaves > chicory > control > celery. The DPPH results of the crumb were slightly different: olive leaves > grape marc > control and chicory > celery. When the ABTS assay was ap-plied to the crust, the highest and the lowest antioxi-dant activity values were shown by the breads with grape marc and chicory/celery/fennel extracts. In the case of crumb, the highest concentrations of Trolox equivalents were detected in the bread with grape marc while the lowest antioxidant values were observed in celery/fennel breads. Low correlation coefficients were obtained by the linear regression between the results of the Folin-Ciocalteu reaction and the antioxidant activity measured by both the assays (the R values were lower than 0.72 at P < 0.05). In fact, although advanced Maillard reaction products and phenolic compounds are good scavengers of peroxyl and ABTS radicals, the antioxidant capacity of a baked product would derive from the synergistic effects of many factors also including thermal-induced degradative products (Rupasinghe et al. 2008), and polyphenol-polysaccharide complexes (Sivam et al. 2010). For these reasons, the antioxidant activity values of crust were always higher than those of crumb, except for the bread made with olive leaf extract, whose antioxidant activity values were coherent with the higher phenolic content of crumb with respect to crust.
Analyses of bread samples. The bread physical parameters are reported in Table 3. Moisture was the highest in the crust of control bread and bread with grape marc extract, while the lowest value was detected in bread with celery extract. The moisture percentage of crumb was in the following order: cab-bage/fennel/olive leaf breads > grape marc extract breads > chicory/celery breads. The crumb moisture
values could be related to the presence of soluble solids in the extracts with a certain water holding capacity that slowed the migration of water from the inside to the outside during baking. This hypothesis would be confirmed by a significant increase of the bread weights followed by the replacement of water with the same volume of vegetable waste extracts. The control bread showed a great moisture variability. The specific volume showed the following de-scending order: control > fennel > grape marc > chicory and celery > cabbage and olive leaf. Thus, the enrichment of bread with the extracts significantly lowered the specific volume. A previous study at-tributed this decrease to the acidifying effect of the adjuncts, which would denature the gluten network (Masoodi & Chauhan 1998). In fact, in the present work, the vegetable waste extracts had significantly lower pH values (between 6.20 and 6.50 for all the extracts with the exception of the grape marc one, whose pH was 3.57) than water (7.40). Nevertheless, it is also well known that the addition of bioactive ingredients may physically modify the development of bread dough (Sivam et al. 2011), since antioxidants can form complexes with proteins and/or polysac-charides. Such complexation reactions can occur reversibly via hydrogen bonding between hydroxyl groups of phenolic compounds and the carbonyl group of peptide residues of proteins, and the resultant complexes can be stabilised via covalent and ionic bonds between the phenolate and anion or cationic site of protein molecules. Complexation can also occur through hydrophobic interactions between polyphenols and proteins, or through a cross-link with different protein molecules (Sivam et al. 2010).
Morphological and chromatic parameters. As reported in Table 4, the replacement of water with the aqueous extracts left the cell area unchanged, thus leading to the hypothesis that different volumes of the various breads were due to a different number of cells. Eccentricity ranged between 0.72 and 0.84 without significant differences between samples. These values indicate the presence of elongated cells in the crumb cross-sectional area.
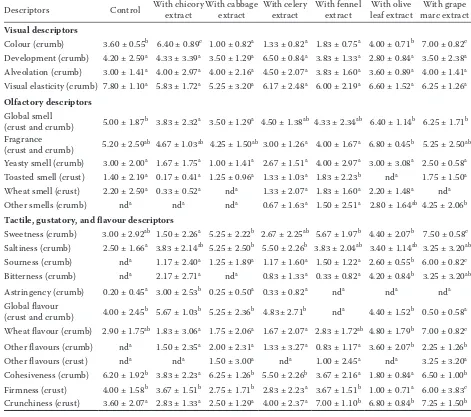
Sensory analysis. The replacement of water with aqueous phenolic extracts from vegetable wastes substantially changed 15 out of the 22 sensory at-tributes (Table 5). The addition of chicory and grape marc extracts made the crumb colour darker, while the addition of cabbage and celery extracts increased lightness. No significant differences were observed for the other visual characteristics, i.e. development, alveolation, and visual elasticity.
The global smell was significantly lower in breads made with chicory and cabbage, while the fragrance was less intense in celery and fennel enriched bread. Concerning gustatory descriptors, the bread pro-duced with grape marc extract was sweeter and more
sour than the others, while the bread enriched with cabbage and celery extracts had the highest saltiness, that made with olive leaf extract was judged as the bitterest, and the astringency was higher in bread enriched with chicory extract.
[image:6.595.60.531.128.545.2]The global flavour was decreased by the addition of fennel and grape marc extracts while the wheat flavour was enhanced by the enrichment with olive leaf and grape marc extracts that also allowed the perception of their proper flavours in the crumb. The bread enriched with grape marc extracts showed the highest firmness and crunchiness while cohesiveness was reduced in bread made with chicory, fennel, and olive leaf extracts.
Table 5.Sensory evaluation of bread enriched with vegetable waste extracts
Descriptors Control With chicory extract With cabbage extract With celery extract With fennel extract leaf extractWith olive marc extractWith grape Visual descriptors
Colour (crumb) 3.60 ± 0.55b 6.40 ± 0.89c 1.00 ± 0.82a 1.33 ± 0.82a 1.83 ± 0.75a 4.00 ± 0.71b 7.00 ± 0.82c
Development (crumb) 4.20 ± 2.59a 4.33 ± 3.39a 3.50 ± 1.29a 6.50 ± 0.84a 3.83 ± 1.33a 2.80 ± 0.84a 3.50 ± 2.38a
Alveolation (crumb) 3.00 ± 1.41a 4.00 ± 2.97a 4.00 ± 2.16a 4.50 ± 2.07a 3.83 ± 1.60a 3.60 ± 0.89a 4.00 ± 1.41a
Visual elasticity (crumb) 7.80 ± 1.10a 5.83 ± 1.72a 5.25 ± 3.20a 6.17 ± 2.48a 6.00 ± 2.19a 6.60 ± 1.52a 6.25 ± 1.26a
Olfactory descriptors Global smell
(crust and crumb) 5.00 ± 1.87b 3.83 ± 2.32a 3.50 ± 1.29a 4.50 ± 1.38ab 4.33 ± 2.34ab 6.40 ± 1.14b 6.25 ± 1.71b Fragrance
(crust and crumb) 5.20 ± 2.59ab 4.67 ± 1.03ab 4.25 ± 1.50ab 3.00 ± 1.26a 4.00 ± 1.67a 6.80 ± 0.45b 5.25 ± 2.50ab Yeasty smell (crumb) 3.00 ± 2.00a 1.67 ± 1.75a 1.00 ± 1.41a 2.67 ± 1.51a 4.00 ± 2.97a 3.00 ± 3.08a 2.50 ± 0.58a
Toasted smell (crust) 1.40 ± 2.19a 0.17 ± 0.41a 1.25 ± 0.96a 1.33 ± 1.03a 1.83 ± 2.23b nda 1.75 ± 1.50a
Wheat smell (crust) 2.20 ± 2.59a 0.33 ± 0.52a nda 1.33 ± 2.07a 1.83 ± 1.60a 2.20 ± 1.48a nda
Other smells (crumb) nda nda nda 0.67 ± 1.63a 1.50 ± 2.51a 2.80 ± 1.64ab 4.25 ± 2.06b
Tactile, gustatory, and flavour descriptors
Sweetness (crumb) 3.00 ± 2.92ab 1.50 ± 2.26a 5.25 ± 2.22b 2.67 ± 2.25ab 5.67 ± 1.97b 4.40 ± 2.07b 7.50 ± 0.58c
Saltiness (crumb) 2.50 ± 1.66a 3.83 ± 2.14ab 5.25 ± 2.50b 5.50 ± 2.26b 3.83 ± 2.04ab 3.40 ± 1.14ab 3.25 ± 3.20ab
Sourness (crumb) nda 1.17 ± 2.40a 1.25 ± 1.89a 1.17 ± 1.60a 1.50 ± 1.22a 2.60 ± 0.55b 6.00 ± 0.82c
Bitterness (crumb) nda 2.17 ± 2.71a nda 0.83 ± 1.33a 0.33 ± 0.82a 4.20 ± 0.84b 3.25 ± 3.20ab
Astringency (crumb) 0.20 ± 0.45a 3.00 ± 2.53b 0.25 ± 0.50a 0.33 ± 0.82a nda nda nda
Global flavour
(crust and crumb) 4.00 ± 2.45b 5.67 ± 1.03b 5.25 ± 2.36b 4.83± 2.71b nda 4.40 ± 1.52b 0.50 ± 0.58a Wheat flavour (crumb) 2.90 ± 1.75ab 1.83 ± 3.06a 1.75 ± 2.06a 1.67 ± 2.07a 2.83 ± 1.72ab 4.80 ± 1.79b 7.00 ± 0.82c
Other flavours (crumb) nda 1.50 ± 2.35a 2.00 ± 2.31a 1.33 ± 3.27a 0.83 ± 1.17a 3.60 ± 2.07b 2.25 ± 1.26b
Other flavours (crust) nda nda 1.50 ± 3.00a nda 1.00 ± 2.45a nda 3.25 ± 3.20a
Cohesiveness (crumb) 6.20 ± 1.92b 3.83 ± 2.23a 6.25 ± 1.26b 5.50 ± 2.26b 3.67 ± 2.16a 1.80 ± 0.84a 6.50 ± 1.00b
Firmness (crust) 4.00 ± 1.58b 3.67 ± 1.51b 2.75 ± 1.71b 2.83 ± 2.23a 3.67 ± 1.51b 1.00 ± 0.71a 6.00 ± 3.83c
Crunchiness (crust) 3.60 ± 2.07a 2.83 ± 1.33a 2.50 ± 1.29a 4.00 ± 2.37a 7.00 ± 1.10b 6.80 ± 0.84b 7.25 ± 1.50b
CONCLUSION
Vegetable wastes are rich in phenolic compounds, and their availability at a null cost makes them po-tentially promising ingredients for value-added food applications. The vegetable waste extracts derived from grape marc and olive leaves gave the breads with the highest phenolic contents and antioxidant activity. Physical and sensory properties were strongly modified by the addition of all the types of extracts.
References
AACC (2003): Approved Methods. 44-15A, Moisture – Air-Oven Methods. St. Paul, American Association of Cereal Chemists.
Brand-Williams W., Cuvelier M.E., Berset C. (1995): Use of a free radical method to evaluate antioxidant activity. Lebensmittel-Wissenchaft und -Technologie, 28: 25–30. Bucić-Kojić A., Planinić M., Tomas S., Jokić S., Mujić I., Bilić
M., Velić D. (2011): Effect of extraction conditions on the extractability of phenolic compounds from lyophilised fig fruits (Ficus carica L.). Polish Journal of Food and Nutrition Sciences, 3: 195–199.
Del Castillo M.D., Ames J.M., Gordon M.H. (2002): Effect of roasting on the antioxidant activity of coffee brews. Journal of Agricultural and Food Chemistry, 50: 3698–3703. Delgado-Andrade C., Morales F..J. (2005): Unraveling the
contribution of melanoidins to the antioxidant activity of coffee brews. Journal of Agricultural and Food Chemistry, 53: 1403–1407.
Gorinstein S., Caspi A., Zemser M., Trakhtenberg M.D. (2000): Comparative contents of some phenolics in beer, red and white wines. Nutrition Research, 20: 131–139. Gonzalez R.C., Woods R.E., Eddins S.L. (2004): Digital
Image Processing Using MATLAB. Upper Saddle River, Pearson Prentice Hall.
Horszwald A., Troszynska A., del Castillo M.D., Zielinski H. (2009): Protein profile and sensorial properties of rye
breads. European Food Research and Technology, 229: 875–886.
Masoodi, F.A., Chauhan, G.S. (1998): Use of apple pomace as a source of dietary fibre in wheat bread. Journal of Food Processing and Preservation, 22: 255–263.
Radojkovic M., Zekovic Z., Jokic S., Vidovic S., Lepojevic Z., Molosevic S. (2012): Optimization of solid-liquid extraction of antioxidants from black mulberry leaves by response surface methodology. Food Technology and Biotechnology, 50: 167–176.
Re R., Pellegrini N., Proteggente A., Pannala A., Yang M., Rice-Evans C. (1999): Antioxidant activity applying an improved ABTS radical cation decolorization assay. Free Radical Biology & Medicine, 26: 1231–1237.
Rupasinghe H.P.V., Wang L., Huber G.M., Pitts N.L. (2008): Effect of baking on dietary fibre and phenolics of muffins incorporated with apple skin powder. Food Chemistry, 107: 1217–1224.
Sivam A.S., Waterhouse D.S., Quek S., Perera C.O. (2010): Properties of bread dough with added fiber polysaccha-rides and phenolic antioxidants: a review. Journal of Food Science, 75: 163–174.
Sivam A., Sun-Waterhouse D., Waterhouse G.I.N., Quek S.Y., Perera C.O. (2011): Physicochemical properties of bread dough and finished bread with added pectin fiber and phenolic antioxidants. Journal of Food Science, 76: H97–H107.
Wang R., Zhou W. (2004): Stability of tea catechins in the breadmaking process. Journal of Agriculture Food Chem-istry, 52: 8224–8229.
Zielinski H., Michalska A., Ceglinska A., Lamparski G. (2008): Antioxidant properties and sensory quality of traditional rye bread as affected by the incorporation of flour with different extraction rates in the formulation. European Food Research and Technology, 226: 671–680.
Received: 2014–09–17 Accepted after corrections: 2014–11–20
Corresponding author: