Like in the other animal sectors, the purpose of chicken production is to obtain the yield of a desir-able level at the lowest cost. As the chickens spend their life in poultry houses, in order to be able to perform their production capacities entirely, they should be kept in good environmental conditions with a good care as well as genetic characteristics. Depending upon economic conditions and clima-tologic constraints, egg production normally takes place in either fully confined or semi-confined housing. Uniformity of body weight in pullets and
laying hens is an important management concern. To achieve early maturity and egg production it is very important to have correct body weight and uniformity in the growing period. Sexual maturity in the growth period of pullets varies in relation to breed and hybrid. Average body weights of white laying pullets at the 6th, 12th and 16th week were
430, 890 and 1 130 g, respectively (Anonymous, 2003). Studies aimed at selection for the live weight gain in laying hens showed that egg production decreased and egg weight and feed consumption
Effects of differences in the initial body weight of groups
on laying performance and egg quality parameters
of Lohmann laying hens
E. Lacin
1, A. Yildiz
1, N. Esenbuga
2, M. Macit
21Department of Animal Husbandry, College of Veterinary Medicine, Atatürk University,
Erzurum, Turkey
2Department of Animal Science, College of Agriculture, Atatürk University, Erzurum, Turkey
ABSTRACT: This study was carried out to investigate the effect of different body weight groups (light (L) = 1 400–1 500; medium (M) = 1 500–1 600 and heavy (H) = 1 600 < g) on performance and egg quality traits of Lohmann hens, 24 weeks of age, in different laying periods. A total of 288 Lohmann White layers were allocated randomly to three groups with respect to live weight, each consisting of 24 replicated cages as subgroups, comprising four hens. The study period lasting for 60 weeks was investigated as four different age periods (first period = 24–40 weeks; second period = 40–54 weeks; third period = 54–68 weeks; fourth period = 68–84 weeks). Differences in the initial live weight at the beginning of experiment among the groups continued to the end of experimental period. Considering the egg production, differences among the groups were not significant (P > 0.05) during the experimental period. Egg weight was determined to be lower in the group with low body weight (64.58 g) than in medium (64.97 g) and heavy hen groups (66.30 g). Differences in feed intake and feed conversion ratio among the groups were found significant, and the mean values were 123.93, 127.48 and 130.67 for feed consumption (g/day); 2.23, 2.28 and 2.27 for feed conversion ratio. Except for the feed conversion ratio, the effect of weight groups by age period interaction on performance param-eters was significant (P < 0.01). The effects of body weight on shell strength, shell thickness and yolk index were not significant during the experimental period. However, different body weight groups significantly affected shape index, yolk colour, albumen index and Haugh unit parameters. Shell strength, yolk colour and yolk index values were affected by weight groups by age period interaction. In conclusion, Lohmann White hens in the light group in a uniform flock had higher egg production and lower feed conversion ratio values than those of other weight groups.
increased as body weight increased because heavy birds consume more feed and lay larger egg with large egg yolk than light hens. Hence, the control of live weight in laying hens is very important. The uniformity of flock at the beginning and during the laying period is the main factor to increase egg production (Leeson et al., 1997). Body weight and egg weight are two relevant productive traits in poultry (Festing and Nordskog, 1967; Sorensen et al., 1980). The relationship among egg produc-tion, egg weight and mature body weight follows the same pattern as observed in the body weight at sexual maturity (Ayorinde et al., 1988; Oke et al., 2004). At the beginning of laying period, one of the most important factors determining egg weight is body weight of hen at the age of sexual maturity (Robinson and Sheridan, 1982; Summers and Leeson, 1983). Chemical composition of pullet body at the beginning of laying period is also as important as body weight because peak produc-ing layproduc-ing hens use body tissues and their desire for feed consumption decreases. This problem is solved by using good quality pullets being at the age of sexual maturity (Leeson and Summers, 1987). Thispractice resulted in segregating pullets asto age at sexual maturity (Harms et al., 2000).
This experiment was conducted to determine the effects of body weight on egg production and egg quality parameters during the different laying periods in Lohmann White hens raised in semi-confined poultry house with a multitier cage sys-tem.
MATERIAL AND METHODS
Poultry house and experimental animals This research was carried out at the Atatürk University Research Farm in accordance with ap-proval by Ethic Committee on Research Animal in Erzurum, Northeastern Turkish city (39°55’N, 41°16’W). Standard feeder, drinker, lighting and densities were used throughout the experiment.
Experimental design
A total of 288 Lohmann White layers at 24 weeks of age were assigned to 3 experimental groups ac-cording to BW (light (L) = 1 400–1 500; medium (M) = 1 500–1 600 and heavy (H) = 1 600 < g) and
each experimental group consisted of 24 replicated cages comprising 4 layers. Hens were placed into 3-tier cages (50 × 46 × 46 cm in width × depth × height). For each hen 575 cm2 of floor space was
[image:2.595.306.531.114.452.2]allocated. Hens in each group were equally put into cages in upper, middle and bottom levels. The ex-periment lasted for 60 weeks and comprised 4 pe-riods (Period I = 24–40 weeks; Period II = 40 to 54 weeks; Period III = 54–68 weeks and Period IV = 68–84 weeks). The diet offered ad libitum once daily at 08:30 h in the experiment is described in Table 1, and water through nipples were available all the time. Hens were also subjected to a 17L:7D cycle. The chemical composition was determined according to AOAC procedure.
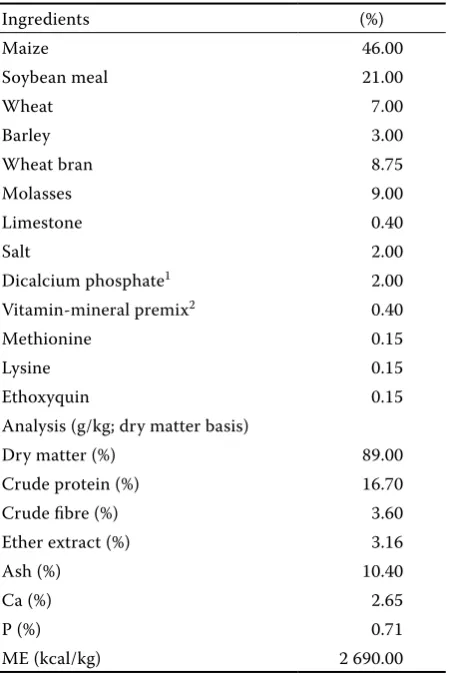
Table 1. Ingredients and chemical composition of the experimental diet
Ingredients (%)
Maize 46.00
Soybean meal 21.00
Wheat 7.00
Barley 3.00
Wheat bran 8.75
Molasses 9.00
Limestone 0.40
Salt 2.00
Dicalcium phosphate1 2.00
Vitamin-mineral premix2 0.40
Methionine 0.15
Lysine 0.15
Ethoxyquin 0.15
Analysis (g/kg; dry matter basis)
Dry matter (%) 89.00 Crude protein (%) 16.70 Crude fibre (%) 3.60 Ether extract (%) 3.16
Ash (%) 10.40
Ca (%) 2.65
P (%) 0.71
ME (kcal/kg) 2 690.00
1each kilogram contained Ca 24% and P 17.5%
2each kilogram contained vitamin A 15 000 IU;
Data collection
Productive performance was evaluated by measur-ing egg production, feed intake and feed conversion ratio (FCR). Feeding, egg collection and recording were done once daily in the morning. Egg produc-tion was recorded daily. Feed was weighed at feed-ing time, usually every day, and then the feed left in the feeder at the end of the week was weighed and subtracted from the total amount supplied dur-ing the week. This gave the total feed intake per 1 week, and from this total the daily feed intake per hen was calculated. Feed conversion ratio was ex-pressed as kilograms of feed consumed per kilogram of egg produced. Egg weights and body weights were measured bi-weekly; egg quality parameters were measured monthly. A total of 144 eggs were ran-domly collected from 3 groups to assess egg quality parameters which were shape index, shell strength, shell thickness, albumen index, yolk index, yolk col-our and Haugh unit. Egg quality parameters were calculated using the following formulas and meth-ods as summarized by Yoruk et al. (2004). Before the egg quality parameters were determined, eggs were stored for 24 h at a room temperature. Shape index (%) = (egg width, cm/egg length, cm) × 100; shell strength (kg/cm2) was determined by using
a machine with the “spiral pressure system”, shell thickness (mm × 10–2) was determined in 3 different
parts with a micrometer; albumen index (%) = (al-bumen height, mm/average of al(al-bumen length, mm and albumen width, mm) × 100; yolk index (%) = (yolk height, mm/yolk diameter, mm) × 100; yolk colour was determined with a commercially avail-able “yolk colour fan” according to the CIE stand-ard colorimetric system (Yolk Colour Fan, the CIE standard colorimetric system, F. Hoffman-La Roche Ltd., Basel, Switzerland), and Haugh unit = 100 × log(AH + 7.57 – 1.7 × EW0.37), where AH = albumen
height (mm) and EW = egg weight (g).
Statistical analysis
The experiment was arranged in a complete rand-omized design. Then 2-way ANOVA was employed using the GLM procedure and differences among groups were evaluated by Duncan’s multiple com-parison test (SPSS for Windows Release 10.01, SPSS Inc. 1996). The linear model to test the effects of treatment groups on laying performance and egg quality parameters was as follows.
Yijk = µ + G + A + (G × A) + eijk
where:
Yijk = response variable µ = population mean
G = treatment group
A = age period group
eijk = experimental error
RESULTS AND DISCUSSION
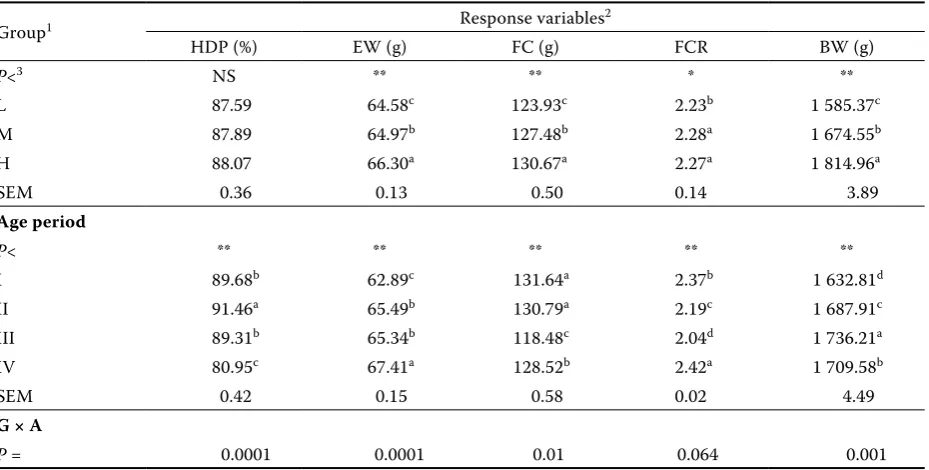
(FCR) varied as the experiment continued. The mean FCR values were 2.23, 2.28 and 2.27 for L, M and H groups, respectively (Table 2). The effect of body weight on FCR was found significant, and hens in L group had the lower FCR value than M and H groups. In agreement with the present results, Harms et al. (1982) reported that feed consumption per kg of egg production increased as the body weight increased. Feed conversion ratio was not affected by weight group by age period interaction. The mean values of egg weight were 64.58, 64.97 and 66.30 g for L, M and H groups respectively, and there was a highly signifi-cant difference in egg weight among the groups. In agreement with the present experiment, Summers and Leeson (1983) reported that an increase in body weight positively increased egg weight. Each 100 g increase in body weight was associated with ap-proximately 3.5 g increase in feed intake and 1.2 g increase in egg weight (Leeson and Summers, 1987). Smaller birds consistently ate less feed throughout lay, regardless of the strain, and this resulted in a loss of egg weight (Leeson et al., 1997). The effect of weight group by age period interaction on egg weight was found highly significant (P < 0.001). Mean egg
weights increased at the 1st, 2nd and 3rd cycle of
lay-ing period as body weight increased. This is sup-ported by Du Plessis and Erasmus (1972), Harms et al. (1982) and Leeson and Summers (1987), who reported that higher body weight resulted in large egg length, width and mass, all factors affecting egg weight. Egg weight in the 4th period (68–84 weeks)
was similar in L and M groups, and H group had the lowest egg weight within the groups.
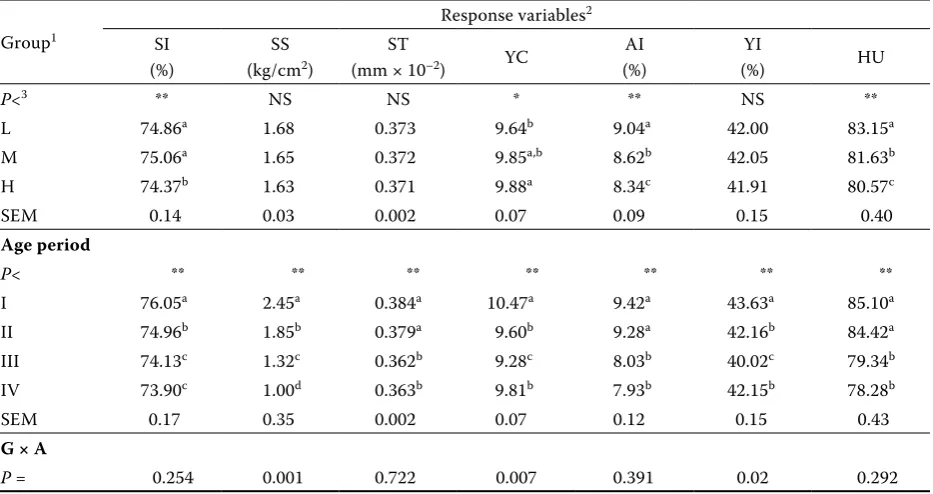
[image:4.595.70.535.114.349.2]The effects of different body weight groups and age periods on egg quality parameters are presented in Table 3. All the egg quality parameters were af-fected by laying periods (I, II, III and IV). The ef-fect of body weight groups on shell strength, shell thickness and yolk index values was found insignifi-cant. Shape index values of L, M and H groups were 74.86, 75.06 and 74.37%, respectively. While there was a significant difference in shape index among the groups, the effect of weight group by age period interaction on shape index was insignificant. Shape index values were similar in L and M groups, and these groups had higher shape index values than H group. Yannakopoulos and Tserveni-Gousi (1986) noted that shape index was affected by the laying Table 2. The effects of different body weight and age periods on laying performance parameters of L, M and H hen groups
Group1 Response variables2
HDP (%) EW (g) FC (g) FCR BW (g)
P<3 NS ** ** * **
L 87.59 64.58c 123.93c 2.23b 1 585.37c
M 87.89 64.97b 127.48b 2.28a 1 674.55b
H 88.07 66.30a 130.67a 2.27a 1 814.96a
SEM 0.36 0.13 0.50 0.14 3.89
Age period
P< ** ** ** ** **
I 89.68b 62.89c 131.64a 2.37b 1 632.81d
II 91.46a 65.49b 130.79a 2.19c 1 687.91c
III 89.31b 65.34b 118.48c 2.04d 1 736.21a
IV 80.95c 67.41a 128.52b 2.42a 1 709.58b
SEM 0.42 0.15 0.58 0.02 4.49
G × A
P = 0.0001 0.0001 0.01 0.064 0.001
1L = light; M = medium; H = heavy; I = 24– 0 weeks; II = 40–54 weeks; III = 54–68 weeks; IV = 68–84 weeks 2HDP = hen day production; EW = egg weight; FC = feed consumption (g/day); FCR = feed conversion ratio (kg
feed consumed per kg of eggs produced); BW = body weight
3statistical significance; NS = non-significant; SEM = standard error of means; a,b,cmeans in the same column
period of quail. A depression in the shape index value in the present experiment could be attrib-uted to increased body weight. The effect of weight group by age period interaction on shell strength was found highly significant (P < 0.001). In the 4th
cycle of laying period L and M groups were similar and had greater shell strength than H group. As egg weight in H group increased, shell strength values decreased in the 4th cycle of laying period. As body
weight increased, shell strength values decreased. Average albumen index values of L, M and H groups were 9.04, 8.62 and 8.34%, respectively. H group had a higher albumen index value than hens placed in L and M groups, differences in this parameter among the groups were determined to be highly significant (P < 0.001). Contrary to the present experiment, Leeson et al. (1997) noted that body weight did not affect albumen index. The effect of weight group by age period interaction on albumen index was not significant. Yolk colour values were affected by dif-ferent weight groups. Yolk colour values were 9.64, 9.85 and 9.88 for L, M and H groups, respectively, and the effect of weight group by age period
interac-tion on this parameter was significant (P < 0.007). In addition, yolk index values were affected by weight group by age period interaction (P < 0.02). Hens in L group had the highest Haugh unit in the whole laying period, and the effect of body weight on this parameter was reported by Altan et al. (1998) not to be significant.
[image:5.595.67.534.116.363.2]In conclusion, this study showed that body weight influenced some important parameters of laying performance and egg quality in hens. Egg weight was determined to be lower in the group with low body weight than in medium and heavy hen groups. However, egg production in light group was higher than that of heavy group (periods III and IV). Feed consumption was found to be higher in medium and heavy groups than in the light group. As body weight increased, egg weight increased but hen-day egg production decreased. Briefly, when feed con-sumption and feed conversion ratio (FCR) values are considered by poultry breeders, hens having light body weight with uniformity of 94% may be preferable to medium and heavy hens because a uniform flock with light weight realises profit due Table 3. The effects of different body weight and age periods on egg quality parameters of L, M and H hen groups
Group1
Response variables2
SI (%)
SS
(kg/cm2) (mm × 10ST –2) YC (%)AI (%)YI HU
P<3 ** NS NS * ** NS **
L 74.86a 1.68 0.373 9.64b 9.04a 42.00 83.15a
M 75.06a 1.65 0.372 9.85a,b 8.62b 42.05 81.63b
H 74.37b 1.63 0.371 9.88a 8.34c 41.91 80.57c
SEM 0.14 0.03 0.002 0.07 0.09 0.15 0.40
Age period
P< ** ** ** ** ** ** **
I 76.05a 2.45a 0.384a 10.47a 9.42a 43.63a 85.10a
II 74.96b 1.85b 0.379a 9.60b 9.28a 42.16b 84.42a
III 74.13c 1.32c 0.362b 9.28c 8.03b 40.02c 79.34b
IV 73.90c 1.00d 0.363b 9.81b 7.93b 42.15b 78.28b
SEM 0.17 0.35 0.002 0.07 0.12 0.15 0.43
G × A
P = 0.254 0.001 0.722 0.007 0.391 0.02 0.292
1L = light; M = medium; H = heavy; I = 24–40 weeks; II = 40–54 weeks; III = 54–68 weeks; IV = 68–84 weeks
2SI = shape index; SS = shell strength; ST = shell thickness; YC = yolk colour; YI = yolk index; AI = albumen index;
HU = Haugh unit
3statistical significance; NS = non-significant; SEM = standard error of means; a,b,cmeans in the same column having different
low feed consumption, high egg production and improved feed conversion ratio.
REFERENCES
Akbas Y., Takma C. (2005): Canonical correlation analy-sis for studying the relationship between egg produc-tion traits and body weight, egg weight and age at sexual maturity in layers. Czech Journal of Animal Sci-ence, 50, 163–168.
Altan O., Oguz I., Akbas Y. (1998): Effects of selection for high body weight and age of hen on egg character-istics in Japanese quail (Coturnix coturnix japonica). Turkish Journal of Veterinary and Animal Science, 22, 467–474.
Anonymous (2003): Report on Pullet Rearing Period 35th North Carolina Layer Performance And Management Test. 35, 2 pp.
AOAC (1990): Official Methods of Analysis, 15th ed. As-sociation of Official Analytical Chemists. Arlington, VA, USA.
Ayorinde K.L., Toye A.A., Aruleba O.A. (1988): Asso-ciation between body weight and two feeding regimes during the growing phase on growth performance and early lay characteristics of pullets. Nigeria Journal of Animal Production, 22, 101–107.
Cerolini S., Mariani P., Cavalchini L.G., Filoni P. (1994): Effects of body-weight and feed restriction on the pro-ductive efficiency of laying hens. Archiv Fur Geflugel-kunde, 58, 30–33.
Du Plessis P.H.C., Erasmus J. (1972): The relationship between egg production egg weight and body weight in laying hens. World’s Poultry Science Journal, 28, 301–310.
Festing M.F., Nordskog A.W. (1967): Response to selec-tion for body weight and egg weight in chickens. Ge-netics, 55, 219–231.
Harms R.H., Russell G.B. (1996): Ability of commercial laying hens producing different egg outputs to meet their methionine and energy requirements when fed the same diets. Poultry Science,75, 519–521.
Harms R.H., Costa P.T., Miles R.D. (1982): Daily feed in-take and performance of laying hens grouped according to their body weight. Poultry Science, 1021–1024.
Harms R.H., Olivero V., Russell G.B. (2000): A compari-son of performance and energy intake of commercial layers based on body weight or egg weight. Journal of Applied Poultry Research, 9, 179–184.
Kirikci K., Cetin O., Gunlu A., Garip M. (2004): Effect of hen weight on egg production and some egg quality char-acteristics in pheasants (Phasianus colchicus). Asian-Australasian Journal of Animal Science, 17, 684–687. Leeson S., Summers J.D. (1987): Effect of immature body
weight on laying performance. Poultry Science, 66, 1924–1928.
Leeson S., Caston L., Summers J.D. (1997): Layer perform-ance of four strains of leghorn pullets subjected to various rearing programs. Poultry Science, 76, 1–5. Marks H.L. (1979): Changes in unselected traits
accom-panying long-term selection for four-week body weight in Japanese Quail. Poultry Science, 58, 269–274. Oke U.K., Herbert U., Nwachukwu E.N. (2004): Association
between body weight and some egg production traits in the guinea fowl (Numida meleagris galeata Palas). Live-stock Research for Rural Development, 16, 1–10. Robinson D., Sheridan A.K. (1982): Effects of restricted
feeding in growing and laying period on the perform-ance of White Leghorn by Australorp cross-bred and White Leghorn strain cross chickens. British Poultry Science, 23, 199–214.
Sorensen P., Ambrosen T., Petersen A. (1980): Scandinavian selection and crossbreeding experiment with laying hens. IV. Results from the Danish part of the experiment. Acta Agriculturae Scandinavica, 30, 288–308.
Summers J.D., Leeson S. (1983): Factors influencing egg size. Poultry Science, 62, 1155–1159.
Statistical Packages for the Social Sciences (1996): SPSS for Windows Release 10.01. SPSS Inc., Chicago, USA. Yannakopoulos A.L., Tserveni-Gousi A.S. (1986): Qual-ity characteristics of quail eggs. British Poultry Science, 27, 171–176.
Yoruk M.A., Gul M., Hayirli A., Macit M. (2004): The effects of supplementation of humate and probiotic on egg production and quality parameters during the late laying period in hens. Poultry Science, 83, 84–88.
Received: 2008–02–22 Accepted after corrections: 2008–08–04
Corresponding Author
Asst. Prof. Dr. Ekrem Lacin, Department of Animal Husbandry, College of Veterinary Medicine, Atatürk University, Erzurum 257 00, Turkey