Application of laser diffraction method for determination
of particle size distribution of grey-brown podzolic soil
M. Ryżak, A. Bieganowski, R.T. Walczak
Institute of Agrophysics, Polish Academy of Sciences, Lublin, Poland
Abstract: Particle size distribution affects many physical soil properties and processes taking place in soil. There are many methods to determine the particle size distribution. The most frequently used are the sieve, sieve-pipette and sedimentation methods. Technological progress in electronics permitted a wide use of new methods of particle size distribution measurement in soil, e.g. the laser diffraction method. A comparison of particle size distribution obtained with the universally used areometer method (Cassagrande, modified by Prószyński) with results from the laser diffraction method for soil material received from grey-brown podzolic soil is presented in this work. The larg-est differences between the results were obtained for the smalllarg-est fraction determined with the areometer and laser diffraction methods. In a majority of other cases the slopes of interpolated straight lines were contained within the range of 0.81 ÷ 1.09.
Keywords: soil particle size; determination of grain size distribution; laser diffraction method
The physical and physicochemical proprieties of soil decide about plant growth and development and strongly influence the formation of the state of environment (Horabik & Walczak 2002). The structure of soil is directly related with its mineral composition and particle size distribution which is considered as one of the basic physical character-istics of soil (Gee & Bauder 1986; Gliński et al. 2002; Eshel et al. 2004). Particle size distribution affects many physical soil proprieties and processes taking place in soil. It is also the basis of soil texture classification. Solid phase parameters of soil, such as particle and aggregate size distribution are crucial for estimation of hydrophysical characteristics of soil-water retention and water conductivity coeffi-cients in the saturated and unsaturated zone (Wal-czak 1984; Kutilek & Nielsen 1994; Sławiński 2003).
An important methodological problem connected with determination of particle and aggregate size distribution of soil is sample preparation. The procedure of sample preparation has to assure the stability of results in time, i.e. soil aggregates should not break up under peptisation during the measure-ment. Taking into consideration that the stability of soil aggregates is different for different soils as well as conditions in soil and its surroundings, the problem of the stability of aggregates has been the
object of thorough investigations (Witkowska-Walczak 2000).
The procedure of sample preparation for meas-urements involves soil dispersion which is most frequently performed in two ways: chemical and mechanical. Chemical dispersion consists in the addition of suitable surfactants to the sample, for example Na-hexametaphosphate (which is one of the components of so-called Calgon), to prevent flocculation during the sedimentation of the soil sample (Gee & Bauder 1986). Mechanical disper-sion consists in mixing the sample with the use of different kinds of stirrers (this way of dispersion is usually applied in combination with chemical dis-persion) or in subjecting the sample to the effect of ultrasounds. The ultrasonic dispersion of a sample consists in the transmission, through soil solution, of a sound wave with suitable frequency which is needed to break up aggregates naturally occurring in the soil sample (Chappell 1998).
areometer methods, in spite of being time consum-ing, have been widely used due to the lack of more exact methods of measurement so far.
Technological progress in electronics, which took place in recent years, permitted a wide use of new methods of particle size distribution measure-ment in soil, such as for example the laser diffrac-tion method (Cooper et al. 1984; Buurman et al. 1997). The use of this method in earlier studies was practically impossible due to complicated calcula-tions which required the application of very quick processors.
The aim of this work was to compare the parti-cle size distribution results obtained by generally used areometer method (Cassagrande, modified by Prószyński) with these coming from the laser diffraction method for soil material received from grey-brown podzolic soil.
MATeRiAls And MeThods
The measurements were conducted on soil sam-ples coming from profiles of grey-brown podzolic soil (Hapic Luvisols): forest (profile 1 and 3) and ar-able (profile 2 and 4). Profiles 1 and 2 were derived from sandy silt deposit, profiles 3 and 4 – from silt (loess) deposit. The soil samples from profiles 1 and 2 were taken from Grodzisko Górne (Sandomierska Basin), while soil samples from profiles 3 and 4 – in Czesławice (Lubelska Upland).
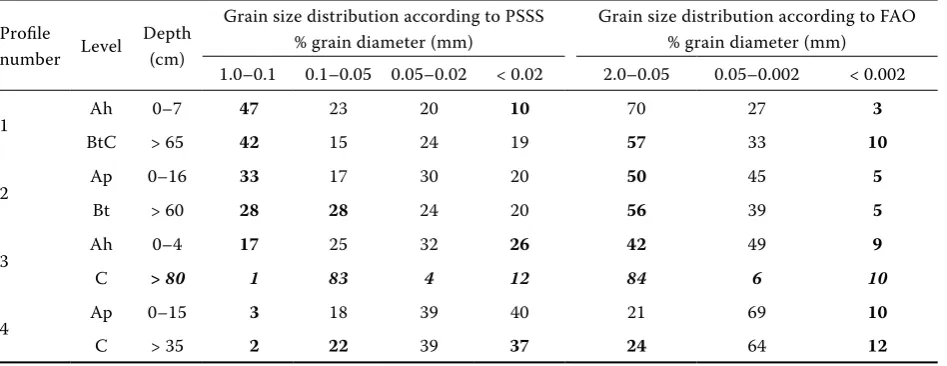
Particle size distribution of the studied soil sam-ples, measured by areometer method (Cassagrande, modified by Prószyński) was published by Turski and Witkowska-Walczak (2004) (Table 1). The
soil sample preparation procedure included adding Calgon as a peptising agent.
The measurements of particle size distribution by means of laser diffraction method were performed with Mastersizer 2000 (Malvern Instruments) which measures particles in a wide range from 0.02 µm to 2.0 mm. The measurements were conducted in liquid dispersion, i.e. in distilled water with refrac-tive index for light equal to 1.33. In the calculation of particle size, the Mie theory which describes the interaction between laser light and matter (by means of exact solution of Maxwells equations) was used. The use of the Mie theory in calculations requires the knowledge of the refractive index of the tested material. In the calculation of particle size, the value of the refractive index for soil samples was assumed as equal to 1.577 and the absorption index 0.1 were used (Sample dispersion and refractive index guide 1997).
ResulTs And discussion
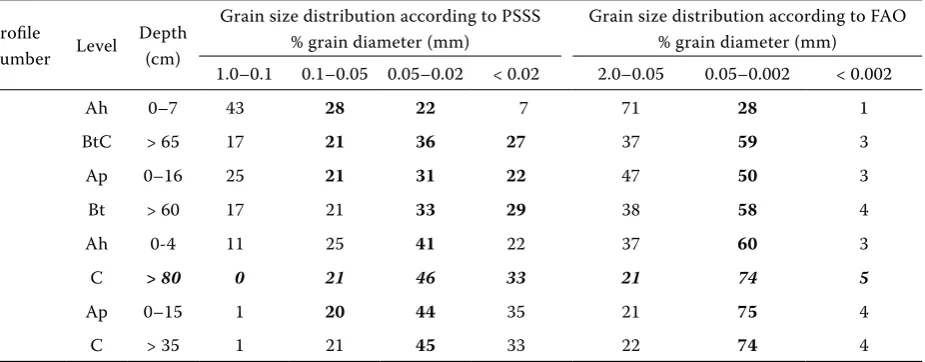
The results of measurement of particle size dis-tribution of the studied soil samples using the laser diffraction method are presented in Table 2.
[image:2.595.64.538.577.760.2]A comparison of the results of particle size distri-bution measurement coming from the areometer and laser diffraction methods according to the FAO classification (Polish Standard PN-R-04033 1998) is presented in Figure 1. The respective comparison according to the classification of Polish Soil Sci-ence Society (PSSS) (Anonymous 1989), (Mocek et al. 2000) is presented in Figure 2. The results from the areometer and the laser diffraction methods
Table 1. Particle size distribution of studied soil samples (Turski & Witkowska-Walczak 2004); results marked in bold and in italic were disregarded from comparison (explanation in text); results from areometer method marked in bold were higher than corresponding results from laser diffraction method (compare Table 2)
Profile
number Level
Depth (cm)
Grain size distribution according to PSSS % grain diameter (mm)
Grain size distribution according to FAO % grain diameter (mm)
1.0–0.1 0.1–0.05 0.05–0.02 < 0.02 2.0–0.05 0.05–0.002 < 0.002
1 Ah 0–7 47 23 20 10 70 27 3
BtC > 65 42 15 24 19 57 33 10
2 Ap 0–16 33 17 30 20 50 45 5
Bt > 60 28 28 24 20 56 39 5
3 Ah 0–4 17 25 32 26 42 49 9
C > 80 1 83 4 12 84 6 10
4 Ap 0–15 3 18 39 40 21 69 10
were compared, except for the results obtained for the deeper level (level C) of the third profile (dark grey background in corresponding lines in Tables 1 and 2). These results were rejected from the compar-ison due to a disproportionately large, in comparcompar-ison to the other results, discrepancy between the results from the areometer and the laser diffraction meth-ods for fraction 0.05–2.0 mm in FAO classification (and corresponding fraction 0.05–0.1 mm in PSSS classification). This discrepancy is difficult to be explained, also in the context of essential differences
in the characteristic of the soil material obtained using only the areometer method (Table 1: column 0.1–0.05 mm for PSSS classification and column 2.0–0.05 mm for FAO classification) (Turski & Witkowska-Walczak 2004).
[image:3.595.69.532.103.284.2]Analysing the dependences presented in Figures 1 and 2 one should conclude that, regardless the ap-plied classification of particle size distribution, for a majority of cases, the results obtained with the areometer method are lower than the results coming from the laser diffraction method. The slope of the Table 2. Particle size distribution of studied soil samples measured by laser diffraction; results marked in bold and in italic were disregarded from comparison (explanation in text); results from laser diffraction method marked in bold were higher than corresponding results from areometer method (compare Table 1).
Profile
number Level
Depth (cm)
Grain size distribution according to PSSS % grain diameter (mm)
Grain size distribution according to FAO % grain diameter (mm)
1.0–0.1 0.1–0.05 0.05–0.02 < 0.02 2.0–0.05 0.05–0.002 < 0.002
1 Ah 0–7 43 28 22 7 71 28 1
BtC > 65 17 21 36 27 37 59 3
2 Ap 0–16 25 21 31 22 47 50 3
Bt > 60 17 21 33 29 38 58 4
3 Ah 0-4 11 25 41 22 37 60 3
C > 80 0 21 46 33 21 74 5
4 Ap 0–15 1 20 44 35 21 75 4
C > 35 1 21 45 33 22 74 4
0.002–0.05 mm y = 0.83x - 0.01
R2 = 0.71
0.0 0.2 0.4 0.6 0.8
0.0 0.2 0.4 0.6 0.8
Silt fraction by laser diffraction method
Silt
fraction
by
areometer
method
0.05–2.0 mm
y = 0.94x + 0.09
R2 = 0.78
0.0 0.2 0.4 0.6 0.8
0.0 0.2 0.4 0.6 0.8
Sand fraction by laser diffraction method
Sand fraction by areometer method
< 0.002 mm
y = 2.03x + 0.01
R2= 0.44
0.00 0.05 0.10 0.15
0.00 0.02 0.04 0.06 0.08 0.10
Clay fraction by laser diffraction method
C
la
y
fr
ac
tio
n
by
a
re
om
et
er
m
et
ho
[image:3.595.302.532.469.603.2]d
Figure 1. Comparison of particle size distribution from areometer and laser diffraction methods according to the FAO classification (Polish Standard PN-R-04033 1998) for: (a) clay, (b) silt, (c) sand fraction
(c)
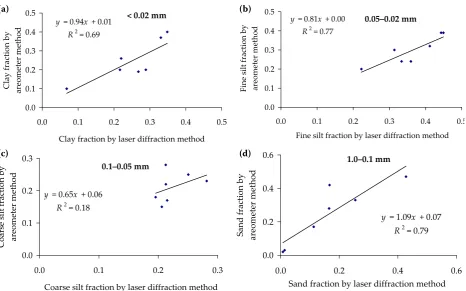
straight line was less than one in 5 out of 7 cases – in Figure 1b, c and in Figure 2a, b and c, respectively. In these cases the slopes of interpolated straight lines changed within the range from 0.65 to 0.94. The value of the slope of a straight line close to unity was obtained for the sandy fraction in the PSSS clas-sification (Figure 2d).
Analysis of source data which were the basis for delimitation of the dependences presented in Figures 1 and 2 do not allow to draw such unambiguous conclusions. In a comparison conducted in this manner, in a slightly larger number of cases higher values were obtained using the areometer method – 24 to 21 cases (in bold in Tables 1 and 2).
The greatest discrepancy was observed for the clay fraction according to the FAO classification (Figure 1a). The results obtained for this fraction from the laser diffraction method were over twice lower in comparison to the results obtained from the ar-eometer method. The discrepancy of results for the smallest fraction should not surprise because, for both mentioned above methods, the uncertainty of measurement for small particles is the largest. In the areometer method this uncertainty comes from the fact that small and light particles do not sediment in obedience to the Stokes law, but they can sediment more slowly or can form a suspension (Loveland & Whalley 2001). In the laser diffraction method
one of the sources of uncertainty is the fact that measurement is based on calculation of the volume of particles. Therefore, less numerous but larger particles have a major influence on the results of measurements. In this context high correlation for the smallest particles according to the PSSS seems to be surprising (Figure 2a).
For both classifications the results for fraction 0.05–2.0 mm (according to the FAO classification) and fraction 0.1–1.0 mm (according to the PSSS classification) were the most similar. In these cases the slopes of a straight lines were the closest to unity. This can be explained by the fact that sand particles have shapes closest to the spherical, which was the assumption during particle size distribution meas-urement using the areometer and laser diffraction methods.
Correlation between both studied methods, de-scribed by determination coefficients, is on the level from 0.7 to 0.8. In one case, for fraction 0.1–0.02 mm in the PSSS classification (Figure 2c) (R2) amounts to only 0.2. This can be caused by the uncertainty of one or both methods.
conclusions
[image:4.595.66.533.52.343.2]Laser diffraction method can be applied for par-ticle size measurements.
Figure 2. Comparison of particle size distribution from areometer and laser diffraction methods according to the PSSS classification for: (a) clay, (b) fine silt, (c) coarse silt, (d) sand fraction
<ȱ0.02ȱmmȱ yȱ=ȱ0.94xȱ+ȱ0.01
R2ȱ=ȱ0.69
0.0 0.1 0.2 0.3 0.4 0.5
0.0 0.1 0.2 0.3 0.4 0.5
Clayȱfractionȱbyȱlaserȱdiffractionȱmethod Clay ȱfr ac tio nȱ by ȱ ar eo m et er ȱm et ho
d yȱ=ȱ0.81R2ȱ=ȱ0.77xȱ+ȱ0.00 0.05–0.02ȱmmȱ
0.0 0.1 0.2 0.3 0.4 0.5
0.0 0.1 0.2 0.3 0.4 0.5
Fineȱsiltȱfractionȱbyȱlaserȱdiffractionȱmethod Fine ȱsilt ȱfraction ȱby ȱ areometer ȱmethod
0.1–0.05ȱmmȱ
yȱ=ȱ0.65xȱ+ȱ0.06
R2ȱ=ȱ0.18
0.0 0.1 0.2 0.3
0.0 0.1 0.2 0.3
Coarseȱsiltȱfractionȱbyȱlaserȱdiffractionȱmethod Coarse ȱsilt ȱfr ac tio nȱ by ȱ ar eo m et er ȱmethod 1.0–0.1ȱmmȱ
y ȱ=ȱ1.09x ȱ+ȱ0.07 R2ȱ=ȱ0.79
0.0 0.2 0.4 0.6
0.0 0.2 0.4 0.6
Sandȱfractionȱbyȱlaserȱdiffractionȱmethod Sand ȱ fraction ȱ by ȱ ar eo m et er ȱ m et ho d
(a) (b)
Abstrakt
Ryżak M., Bieganowski A., Walczak R.T. (2007): Použití laserových difrakčních metod ke stanovení veli-kosti částic a jejich rozdělení v šedohnědých podzolových půdách. Res. Agr. Eng., 53: 34–38.
Rozdělení velikosti částic ovlivňuje mnoho fyzikálních vlastností půd a také procesů, které v ní probíhají. Existuje mnoho různých metod pro určování rozdělení částic. Nejčastěji se používají sítové, síto-pipetová a sedimentační metody. Technologický pokrok v elektronice umožnil širší použití nových metod určování velikostního rozdělení částic v půdách, např. také laserové difrakční metody. Srovnání rozdělení velikosti částic tak jak bylo získáno běžně používanou aerometrickou metodou (Cassagrandeova v modifikaci Prószyńského) s výsledky laserové difrakční metody u šedohnědých podzolových půd je uvedeno v této práci. Největší rozdíly mezi výsledky byly získány pro nejméně zastoupené frakce jak u aerometrické laserové difrakční metody. Ve většině ostatních případů směrnice přímek použitých k regresní analýze se pohybuje v rozmezí 0.81 ÷ 1.09.
Klíčová slova: velikost půdních částic; určování velikostního rozdělení zrn; laserová difrakční metoda
Corresponding author:
Magdalena Ryżak, MSc., Instytut Agrofizyki PAN, ul. Doświadczalna 4, P.O. Box 201, 20-290 Lublin 27, Polska tel.: + 48 81 744 50 61 ext. 128, fax: + 48 81 744 50 67, e-mail: [email protected]
For grey-brown podzolic soils the largest differ-ences between results were obtained for the smallest fraction with the areometer and laser diffraction methods (< 0.002 mm according to the FAO clas-sification). In a majority of other cases the slopes of interpolated straight lines were contained within the range of 0.81 ÷ 1.09.
References
Anonymus (1989): Taxonomy of Polish soils. Roczniki Gle-boznawcze, 40(3/4): 7–150. (in Polish)
Buurman P., Pape Th., Muggler C.C. (1997): Laser grain size determination in soil genetic studies. 1. Practical problems. Soil Science, 162: 211–218.
Chappell A. (1998): Dispersing sandy soil for the meas-urement of particle size distributions using optical laser diffraction. Catena, 31: 271–281.
Cooper L.R., Haverland R.L., Hendricks M., Knisel W.G. (1984): Microtrac particle-size analyzer: An alterna-tive particle–size determination method for sediment and soil. Soil Science, 138: 138–146.
Eshel G., Levy G.J., Mingelgrin U., Singer M.J. (2004): Critical evaluation of the use of laser diffraction for par-ticle-size distribution analysis. Soil Science Society of America Journal, 68: 736–743.
Gee G.W., Bauder J.W. (1986): Particle – size analysis. In: Klute A. (ed.): Methods of Soil Analysis. No. 9, Part 1 in the series Agronomy, 383–411.
Gliński J., Stępniewska Z., Turski R., Bennicelli R., Wolińska A., Szafranek A., Charytoniuk P. (2002):
Selected Methods of Soil Investigations. EKO-KUL, Lublin. (in Polish)
Horabik J., Walczak R.T. (2002): Role of physical methods of investigations of natural environment and food products. Acta Agrophysica, 60: 71–90.
Kutilek M., Nielsen D. R. (1994): Soil Hydrology. Catena Verlag, Cremlingen-Destedt.
Loveland P.G., Whalley W.R. (2001): Particle size analysis. In: Smith K.A, Mullins C.E. (eds.): Soil and Environ-mental Analysis. Physical Methods. Marcel Dekker, Inc., New York.
Mocek A., Drzymała S., Maszner P. (2000): Genesis, Anal-ysis and Classification of Soils. AR Poznań. (in Polish) Sample dispersion and refractive index guide (1997): MAN
0079, Malvern Instruments.
Sławiński C. (2003): Influence of soil solid phase param-eters on values of hydraulic conductivity coefficients. Acta Agrophysica, No. 90. (in Polish)
Turski M., Witkowska-Walczak B. (2004): Physical properties of sandy silt and silty loam (loess) formation. Acta Agrophysica, No. 101. (in Polish)
Walczak R. (1984): Modelling of water retention depend-ing on parameters of solid phase of the soil. Problemy Agrofizyki, No. 41. (in Polish)
Witkowska-Walczak B. (2000): The impact of aggregate structure of mineral soils on their hydrophysical charac-teristics (Model investigations). Acta Agrophysica, 30: 5–96. (in Polish)