BERARD & CHARLES (2000) and SCHILLING & PAN
-TELIDES (1997) deal with a general approach to multi-purpose batch plants planning. The methodology consists of two steps. It commences with the development of a Discrete-Event Simulation (DES) model to describe the all over dynamic behavior including food production bounds. More precisely, the different stages applied to the design of an object-oriented DES are presented. Then the global simulation tool is coupled with a stochastic optimization procedure to solve efficiently the produc-tion planning problem of a highly combinatorial nature. LOZA-GARAY & FLORES (2000) and POSNER & HIBBS
(1997) focus on the flow characteristics of the product through the flour mill at the total flow rate. This is con-sidered following a flow with normal distribution varia-tions. The model describes the flow of total matter in a stochastic (probabilistic) analysis. The mass flow is linked directly to wheat attributes and to the specific process conditions of the pilot mill.
Production planning in fish processing factories is marred by uncertainty in both the demand for final goods and the supply of raw fish. The SLAM II discrete event simulation model is used to study the potential of multi-supplier sourcing as a strategy for minimizing stock re-lated costs under variable demand and variable supply yield (HARVEY & KWEKU-MUATA 2000).
MINEGISHI and THIEL (2000) discuss the comprehen-sion of the industrial management behavior of food
in-dustries, which have short or long manufacturing pro-cesses and short or long sell-by date products. Three ge-neric models have been implemented according to the duration of the manufacturing processes and the sell-by date of the food products. Management recommendations are suggested without changing the basis of the operat-ing system structure.
There are few research papers dealing with scheduling problems in food industries (KEDAD et al. 1994, 1996), or with food manufacturing resources planning MRP II combined with a Just-In-Time system (CONCEICAO
1996).
SIMEONOV (1999) and SIMEONOV & SIMEONOVOVÁ
(1996, 1999) discuss capabilities of APS systems for Plan-ning and Scheduling of production systems.
PEGDEN (2000) focus on changes in simulation tech-nology and discuss the impact of these changes on the role and importance of simulation modeling in the future design and operation of complex systems. Simulation pro-vides a simple yet flexible method for generating a finite capacity schedule for a factory floor.
ESPRIT projects are top research projects supported by EU (http://www.cordis.lu). The objectives of the project “Computer Integrated Manufacturing System for the Meat Processing Industry” were to develop a generic CIM concept and additional methods that will enable an effective implementation of CIM systems in specific fac-tories, focusing especially on dynamic production
plan-Simulation Scheduling in Food Industry Application
SIMEON SIMEONOV1 and JANA SIMEONOVOVÁ2
1
Technical University, Brno; 2Mendel University of Agriculture and Forestry, Brno, Czech Republic
Abstract
SIMEONOV S., SIMEONOVOVÁ J. (2002): Simulation scheduling in food industry application. Czech J. Food Sci., 20: 31–37.
Nowadays manufacturers are facing rapid and fundamental changes in the ways business is done. Producers are looking for simulation systems increasing throughput and profit, reducing cycle time, improving due-date performance, reducing WIP, pro-viding plant-wide synchronization, etc. Planning and scheduling of coffee production is important for the manufacturer to syn-chronize production capacity and material inputs to meet the delivery date promised to the customer. A simulation model of coffee production was compiled. It includes roasting, grinding and packaging processes. Using this model the basic features of the coffee production system are obtained. An optimization module of the simulation SW is used for improving the current structure of the production system. Gantt charts and reports are applied for scheduling. Capacity planning problems related to coffee production are discussed.
ning, scheduling and control/monitoring at factory floor level, coordination of cells/production of lines, control and monitoring of production processes, links to (typi-cally existing) administrative and order long term plan-ning systems.
Description of Coffee Production
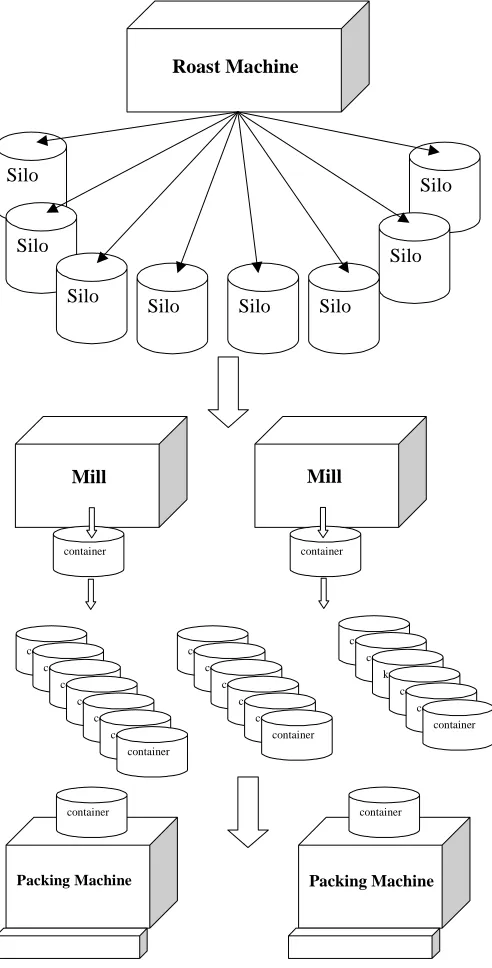
The material flow in the process of coffee production is illustrated in Fig. 1. One roasting machine is available for roasting. Its per hour output and production load are known to be identical for all types of coffee. The
trans-portation of ground coffee to the silos is ensured by a pipeline system connecting the roasting machines with the respective silos. The coffee transfer from the roasting machine to the silo is controlled from the production con-trol center.
Based on the technology of coffee production, coffee is degassed immediately after roasting. For that purpose it is stored in eight degassing silos of known maximum capacity. Only one type of coffee can be stored in a silo. The minimum duration of degassing after roasting is spec-ified by the technology and must be strictly adhered to.
Roast Machine
Silo
Silo
Silo Silo
Silo Silo
Silo
Silo
Mill Mill
contejner contejner
contejner contejner
contejner contejner
container contejner
contejner contejner
contejner contejner
container
contejner contejner
kontejner contejner
contejner container
Packing Machine Packing Machine
container container
[image:2.595.74.320.250.734.2]container container
Fig. 1. A material flow in the process of coffee production
Apart from this, it is absolutely necessary to ob-serve the maximum period of keeping coffee in the silo. These conditions must be implemented into the simulation model, where various rules are created to control the material flow. Based on the assumption that there are three kinds of coffee pro-cessed, the table illustrating the minimum and maximum storage time in the silos can be as fol-lows:
Type of coffee Time (h)
min. max.
Coffee type A 8 50 Coffee type B 10 50 Coffee type C 12 50
Coffee is transported from the silos to the mills by a tube system controlled by the dispatcher.
Coffee is ground in two mills of known per hour output. Ground coffee is transported via the pipe-line system to the containers, where additional de-gassing is carried out. The maximum capacity of each container is known and cannot be exceeded. As shown by the actual process and by the simula-tion model, the containers are considered to be the bottleneck of the production chain. The duration of degassing after grinding is again specified by the technology. For the three types of coffee it is as follows:
Type of coffee Time (h)
min. max.
Coffee type A 2.5 14.5 Coffee type B 20 30 Coffee type C 6 17
lation model deals with the problems of production sched-uling, it does not involve elements of probability, for ex-ample breakdowns of machines and equipment, differences in processing and set up time, etc. If this simulation mod-el is used for a longer period simulation to determine the characteristics of production system (e.g. its potential capacity), it is easily possible to add those elements that will convert the deterministic model into a probability model. The number of shifts is defined for each machine. For most machines two shifts are considered (planned). Resources are grouped in dependence on the type of prod-ucts. For instance, two groups can be defined for the pack-ing process: one group of packpack-ing machines producpack-ing 60 to 100 g packages and the other group producing 60 to 250 g packages. Each machine can be integrated into different groups.
As the simulation model should be preferably used for production planning, its major role is to identify fluctua-tions in demand. This demand changes in a dynamic way with regard to both the types of coffee and the size of packages. The changing demand is reflected in produc-tion orders that are scheduled by means of this simula-tion model. The manager then only puts producsimula-tion orders to be processed into the corresponding interfaces.
The capacity limits for the number of mobile contain-ers are presented as the capacity of buffcontain-ers of the type Pool/WIP.
For the convenience of the user, all time values (pro-cess, setup or transportation times) are presented in the tables in the MS Access or MS Excel format. The user can modify the tables without entering the simulation model. All the products, e. g. type of coffee A, B, C… are defined in the model. The technology of coffee pro-duction is included in the so-called processing plan, which contains the respective processing steps such as roast-ing, degassroast-ing, grindroast-ing, etc.
The rules of production system control are also includ-ed in the model. Production orders are defininclud-ed through the following data:
Type of product – e.g. Coffee type A Required amount – e.g. 3440 kg Priority of the order – e.g. 3
Deadline of the order – e.g. 6 February, 2001
The user of the simulation model can modify the mod-el to create various alternatives for solving problems. The alternatives can be compared by means of various graph-ical and textual inputs offered by the system.
Outputs of Simulation Model for Production Scheduling
The users of this simulation model can easily modify it and create various alternatives for the solution of their problems. It is also possible to compare these alterna-tives by means of various graphical and textual outputs that are provided by the simulation system as well as by other SW system.
Capacity Planning and Scheduling Problem
Bottleneck points occur in the above-mentioned sys-tem of coffee production. They represent a limiting fac-tor for the system productivity and a danger of failure of production technology. The occurrence of these bottle-necks depends on the current status of unfinished pro-duction as well as on mix of propro-duction orders (orders entering the production). Without a simulation tool for production scheduling the identification of bottlenecks can be difficult. Based on the previous experience, it is known that the containers filled up with coffee need a longer period for degassing. Due to this the mills (up-stream workplace) as well as the packing machines (downstream workplace) must break work.
As it is difficult to predict the occurrence of a bottle-neck in time, the production cannot be scheduled satisfac-torily. The scheduling manager uses a backward scheduling starting from the time when the order is due to be complet-ed. With respect to wide production assortment, produc-tion scheduling is very difficult if not impossible. The capacity of the containers reaches its limit and conse-quently grinding and packing are interrupted. Packing machines finalizing the production cannot be utilized at the maximum and the efficiency of the system decreases. A production scheduling tool is therefore needed to pre-dict bottleneck points and generate a realizable produc-tion schedule to ensure maximum producproduc-tion capacity.
Simulation Model of Coffee Production
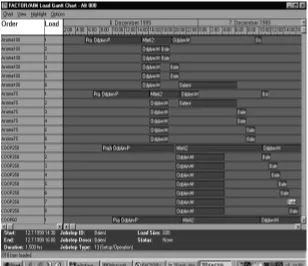
simu-For production scheduling the simulation system gener-ates Gantt charts, both from the point of view of resources (machines and equipment) and from the point of view of loads (Load Charts). Gantt charts illustrate the time se-quence of the events arising in the simulation system in a graphic form. In Fig. 2 the Gantt charts for all machines and equipment of the production system is illustrated.
For example, it is possible to read from this chart that Silo 7 is connected to Mill 2, which grinds the first load of the given order. This operation lasts from 4:10 p.m. to 9:04 p.m.
[image:4.595.71.367.99.338.2]The Gantt charts in Fig. 3 describes a part of the week-ly schedule for the coffee production. A course of the individual production loads can be followed in detail. It
[image:4.595.70.378.491.757.2]Fig. 3. Week schedule for the coffee production
is obvious that with all the production loads, minimum times of degassing are maintained.
One of the problems that the manager can identify from the Gantt charts is the break of work of the packing ma-chines due to the lack of empty containers. The occur-rence of the bottleneck caused by containers can be revealed, among others, from the graph showing the state of the packing machines versus time, as well as from the graph illustrating the fluctuation in the number of empty containers.
Further analyses have been carried out using a variety of outputs offered by the simulation system. If the rele-vant output lacks a suitable format, then the user easily generates the required output, as the results of the simu-lation course are stored in the database.
The simulation model supports the application of the approach known as TOC/OPT (GOLDRATT ELIYAHU
1992). It identifies bottlenecks of the production process and enables their analysis and correct scheduling (Fig. 4).
Simplan – Optimal
It is necessary for the user (manager, planner-schedul-er) of the simulation model of coffee production to per-form a number of simulation experiments with the aim to find the most suitable and, under given conditions, the optimum solution. For instance, if it is found during the production scheduling for the following week that the bottleneck (lack of empty containers) interrupts the work of packing machines, then it is possible to modify the input parameters to minimize this break. For the sched-uling these parameters are as follows: input time of pro-duction orders, their priority, propro-duction loads controlling rules, etc. If the simulation model is used to improve the production process, the user performs simulation exper-iments and observes how the production parameters are being modified. For instance, if the user decides to
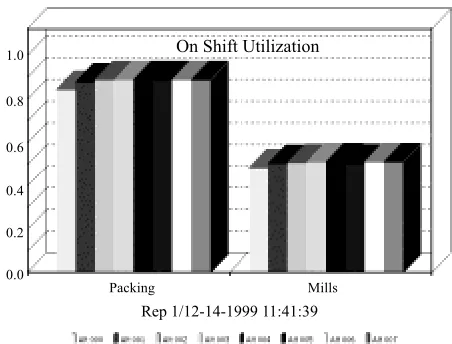
in-crease the number of containers, then he/she can also find out how many containers to add, to what extent this is profitable in respect to the cost of newly purchased con-tainers, where a bottleneck can occur, etc. Fig. 5 shows the dependence between On Shift Utilization of packing machines and mills and the number of containers. The number of containers varies from 40 to 75 with the incre-ments of 5. If the On Shift Utilization of these machines were the only criterion, then it can be assumed that the number of containers exceeding 50 does not result in fur-ther increase of On Shift Utilization.
Optimisation tasks require a large number of simula-tion experiments as well as their assessment. For this pur-pose the optimisation system SIMPLAN-Optimal was developed (SIMEONOV & SIMEONOVOVÁ 2000). This system enables to change the input parameters of the op-timisation, to define standard criterion (objective) func-tions and to assess the results. The following optimisation methods have been applied in this system (ČERMÁK 1998; ZÍTEK 1990):
– all simulation possibilities (all combinations of chosen variables and their values)
– VFSR (Very Fast Simulated Reannealing) – Simulated Annealing
– Genetics Algorithm
– Modified Box’s Method of Complexes
– Method of Gold Cutting (only for vehicle speed).
CONCLUSION
[image:5.595.300.526.97.269.2]Integration of the simulation system into the plant IS: An efficient use of the simulation model within the pro-cess of production planning and scheduling can be reached only in case of its integration into the manageri-al structure of the production plant. If there is an infor-mation system (IS) in the company, the simulation
Fig. 4. Identification of bottlenecks Fig. 5. On shift utilisation vs the number of containers
1.0
0.8
0.6
0.4
0.2
0.0
BTH-41 MPE Pražstro Probat Rovema l Rovema 2
Alt000/Rep 1/12-12-1999 16:39:46
On Shift Utilization 1.0
0.8
0.6
0.4
0.2
0.0
On Shift Utilization
[image:5.595.55.285.101.248.2]subsystem can develop an efficient planning module. In-tegration of simulation (planning) model is implemented at the level of the database of both these systems. An interface enabling its connection with the plant IS has already been elaborated for the described simulation model. This interface can be modified depending on the type of IS and its database. Recent experience with the integration of the simulation system into the plant IS in-dicates that the transfer of data runs without any prob-lems. However, it should be emphasised that the “classical” IS (i.e. with the planning module of MRP type) does not (and even cannot) include all data that are re-quired for simulation planning (e.g. advanced rules of control). For that reason it can be said that this simula-tion module not only enables a qualitatively new approach to the solution of planning problems, but also efficiently supports the overall management approach to the contin-uous improvement of the production process.
If the company lacks a uniform integrated IS, the sim-ulation system can operate independently. Its database can be used as a basis of the plant IS because it contains all important data about the production system.
R e f e r e n c e s
CONCEICAO V. (1996): Implementation d’un systeme mixte de gestion de la production. In: 5th Int. Cong. Industrial En-gineering GI5. Grenoble, 2–4 avril 1996: 131–135.
ČERMÁK L. (1998): Numerical Methods. VÚT, Brno. BERARD F., CHARLES A. (2000): A production planning
stra-tegic approach for food batch industry. In: FOODSIM 2000 – 1st Int. Conf. Simulation in Food and Bio Industries. June 26–27, 2000: 223–227.
HARVEY H., KWEKU-MUATA B. (2000): Simulation of one versus two suppliers in raw fish procurement under demand and supply yield uncertainty. In: FOODSIM 2000 – 1st Int. Conf. Simulation in Food and Bio Industries. June 26–27, 2000: 233–237.
GOLDRATT ELIYAHU M. (1992): The Goal. The North River Press Publ. Corp., Great Barrington.
KEDAD S., LECOMTE C., DEJAX P. (1994): Parallel machine scheduling: application to the packaging lines in the food industies”. In: 10th EURO Summer institute – Combinato-rial Optimization. HEC, France.
KEDAD S., LECOMTE C., DEJAX P. (1996): Une heuristique en deix phases pour la resolution d’un probleme d’ordon-nancement a machines paralleles. In: 5th Int. Cong. Indus-trial Engineering. Grenoble: 97–103.
LOZA-GARAY M., FLORES R. (2000): Computer simulation of flour mill as a stochastic model. In: FOODSIM 2000 – 1st Int. Conf. Simulation in Food and Bio Industries. June 26–27, 2000: 228–232.
MINEGISHI S., THIEL D. (2000): Generic models of food lo-gistics and production management systems. In: 1st Int. Conf. Simulation in Food and Bio Industries. June 26–27, 2000: 247–251.
PEGDEN D. (2000): Future directions in simulation. In: Proc. 11th Int. DAAAM Symp. Opatija: 365–366.
POSNER E., HIBBS A. (1997): Wheat Flour Milling. Amer. Assoc. Cereal Chem., St. Paul, MN, Chapter 8.
SCHILLING G., PANTELIDES C. (1997): Optimal periodic sched-uling of multipurpose plants in the continuous time domain. Computers Chem. Eng., 21 (Suppl.): 1191–1196.
SIMEONOV S., SIMEONOVOVÁ J. (1996): Simulation sched-uling in manufacturing. In: Proc. 7th Int. DAAAM Symp. Vienna, Austria, Oct. 17–19, 1996.
SIMEONOV S., SIMEONOVOVÁ J. (1999): APS and MRP Ap-proaches for planning and scheduling. In: Proc. 5th Int. Sci. Conf. Production Engineering CIM ’99. Opatia, Croatia, June 17–18, 1999.
SIMEONOV S. (1999): Advanced methods for production plan-ning and scheduling – APS. Techn. Weekly, 31: 8–9. SIMEONOV S. SIMEONOVOVÁ J. (2000): FACTOR/AIM
Op-timization System. In: Proc. Int. Adv. Simulation Technol. Conf. ASTC 2000. Washington, D.C., USA, April 16–20, 2000.
ZÍTEK P. (1990): Simulation of Dynamic Systems. SNTL, Praha.
Received for publication November 19, 2000 Acception after corrections August 2, 2001
Souhrn
SIMEONOV S., SIMEONOVOVÁ J. (2002): Simulace plánování a rozvrhování v potravinářském průmyslu. Czech J. Food Sci., 20: 31–37.
za využití optimalizačního modulu. Jsou diskutovány kapacitní problémy související s výrobou kávy. Zvolený přístup je apliko-vatelný na celou řadu potravinářských provozů.
Klíčová slova: simulace; plánování a rozvrhování výroby; výroba kávy
Corresponding author:
Doc. Ing. JANA SIMEONOVOVÁ, CSc., Mendelova zemědělská a lesnická univerzita, Ústav technologie potravin, Zemědělská 1, 613 00 Brno, Česká republika