DEVELOPMENT AND VALIDATION OF HPTLC METHOD FOR
THE DETERMINATION OF LETROZOLE IN BULK AND TABLET
DOSAGE FORM
N. Tamilselvi1*, R. Arivukkarasu2, Ancymol Antony1, Anitha T. J,1, Boominathan A.1, Chandrasekar R.1, Deepthi Visakh1
1
Department of Pharmaceutical Analysis, KMCH College of Pharmacy, Coimbatore, Tamil
Nadu.
2
Department of Pharmacognosy, KMCH College of Pharmacy, Coimbatore, Tamil Nadu.
ABSTRACT
Letrozole is a potent and selective non – steroidal Aromatase inhibitor
approved for the use in post - menopausal woman who have breast
cancer that has progressed after antiestrogen therapy.The present work
describes a simple, precise and accurate HPTLC method for its
estimation as bulk and in tablet dosage form. The chromatographic
separation was carried out on precoated silica gel 60F254 aluminium
plates using mixture of chloroform : methanol (9:1 v/v) as mobile
phase and densitometric evaluation of spots was carried out at 254 nm
using Camag TLC Scanner-3 with win CAT 1.3.4 version software.
The experimental parameters like band size of the spot applied,
chamber saturation time, solvent front migration, slit width etc. were
critically studied and optimum conditions were evolved. The drug was
satisfactorily resolved with Rf value 0.11±0.01. The accuracy and reliability of the proposed
method was ascertained by evaluating various validation parameters like linearity (500-5500
ng/spot), precision (intra-day RSD 0.17-1.54%, inter-day RSD 0.30-1.43%), accuracy (99.3
to 99.8 %) and specificity according to ICH guidelines. The proposed method can analyze
eight or more formulation units simultaneously on a single plate and provide a faster and
cost-effective quality control tool for routine analysis of letrozole as bulk drug and in tablet
formulation.
KEYWORDS: Letrozole, HPTLC, densitometric estimation, method development and validation.
Volume 5, Issue 01, 884-893. Research Article ISSN 2277– 7105
*Correspondence for Author
N. Tamilselvi
Department of
Pharmaceutical Analysis,
KMCH College of
Pharmacy, Coimbatore,
Tamil Nadu.
Article Received on 29 Oct. 2015,
INTRODUCTION
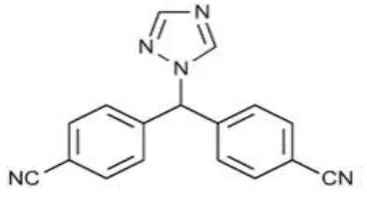
Letrozole (4, 4’-((1H-1, 2, 4-triazol-1- yl ) methylene) dibenzonitrle) is a potent and
selective non – steroidal aromatase inhibitor approved for the use in post - menopausal
woman who have breast cancer that has progressed after antiestrogen therapy.[1] Few methods
of analysis of Letrozole have been reported like RP- HPLC[2-4],UV-spectrophotometric
method.[5] However there is no High Performance Thin Layer Chromatographic (HPTLC)
method reported for Letrozole in pharmaceutical dosage forms. The present study describes
the determination of Letrozole in tablet dosage form by using a HPTLC method. Unlike
HPLC, consumption of mobile phase per sample basis is quite low. This saves cost per
analysis and analysis time as well. HPTLC facilitates repeated detection (scanning) of the
chromatogram with the same or different parameters. HPTLC technique is most suited for
impurity profile of drug substances and content uniformity test as per compendia
specifications.[6] The aim of this study is to develop a simple, precise, rapid, accurate and
repeatable HPTLC method for the estimation of letrozole in tablet dosage form as per ICH
[image:2.595.205.389.400.507.2]guidelines.[7-10]
Fig 1: Chemical structure of Letrozole
MATERIALS AND METHODS Chemicals and reagents
Letrozole was supplied as a gift sample from Sris Pharmaceuticals (Hyderabad,India).
Letrosoul was procured from private Pharmacy, Coimbatore, India and reagents used were of
analytical grade (MERCK Chem. Ltd., Mumbai). Methanol was selected as the solvent for
sample preparation.
HPTLC instrumentation
Chromatography was performed on 20 cm × 10 cm aluminum-backed TLC plates coated with 200 μm layers of silica gel 60F254 (E. Merck, Darmstadt, Germany; supplied by Merck India,
min prior to chromatography. The samples were applied on the plates as 6 mm wide bands,
by means of a CAMAG (Muttenz, Switzerland) Linomat-5 sample applicator fitted with a 100 μL sample syringe (Hamilton, Bonaduz, Switzerland). Plate was developed to a distance
of 8 cm using chloroform: methanol (9:1) as mobile phase in a Camag twin-trough glass
chamber previously saturated with mobile phase vapors for 10 min at ambient temperature.
Densitometric scanning was performed at 254 nm using Camag TLC Scanner 3 equipped
with win CATS software version 1.3.0.
Preparation of standard solution
Standard stock solution containing 10 mg /ml of Letrozole was prepared in methanol by
dissolving 100 mg of Letrozole in 10 ml methanol. Standard solution was further diluted with
methanol to obtain working standard solutions in a concentration range of 500-5500 ng/spot
for Letrozole.
Preparation of sample solution
For analysis of tablet dosage form, twenty tablets, each containing 2.5 mg Letrozole, was
weighed and their average weight was calculated. The tablets were finely powdered and
powder equivalent to 100mg of Letrozole was accurately weighed and transferred into 10 ml
of volumetric flask containing 5 ml of methanol, Sonicated for 30 min and make up to the
mark with methanol to give 10mg/ml of Letrozole. The solution was centrifuged for 15 min
at 600 rpm, filtered through what mann No 41 filter paper and the residue was washed with
methanol. The volume of the filtrate was adjusted to 10 ml with the same solvent. This above
solution was further diluted with methanol to get the concentrations of 2500 and 4500 ng/spot
for Letrozole. The procedure was repeated as per the analysis of formulation. The amount of
[image:3.595.144.453.589.748.2]drug recovered was calculated by using slope and intercept values from the calibration graph.
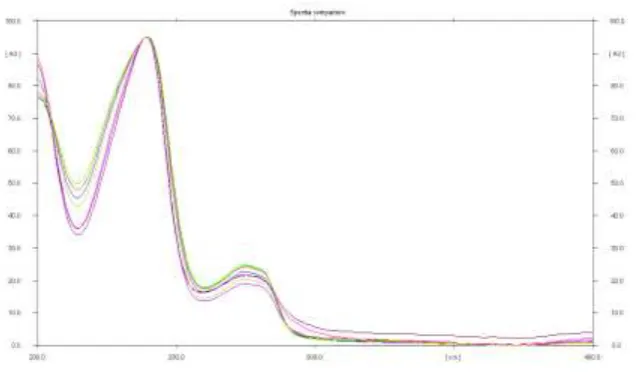
Fig 3. Overlay spectrum of Letrozole standard and sample
METHOD VALIDATION
The method was validated as per ICH guide lines[7-10] for precision, accuracy, specificity,
linearity, reproducibility, LOD and LOQ.
a) Accuracy
Accuracy of the method was determined by recovery experiments. The reference standards of
the respective drug were added to the sample solution at the level of 50%, 100% and 150%.
These were further diluted by procedure as followed in the estimation of formulation. The
concentrations of the drugs present in the resulting sample solution were determined by using
assay method.
b) Linearity and range
From the standard stock solutions, a suitable standard solution was prepared. Letrozole was
found to be linear in the range of 500 to 5500 ng/spot. .The solutions were examined by the
assay procedure. The calibration curve was plotted using peak area Vs concentration of the
standard solution. From the calibration curve, the slope and intercept were calculated.
c) Precision
Precision of the method was determined by
Intra-day precision
Inter-day precision
a) Intra-day Precision
Intra-day precision was found out by carrying out the analysis of the standard drug solutions
at a concentration of 1500-3500 ng/spot of Letrozole for three times on the same day. The
Percentage RSD was calculated.
b) Inter-day precision
Inter-day precision was found out by carrying out the analysis of the drug solution at a
concentration of 1500-3500 ng/spot of Letrozole for three different days and the Percentage
RSD was calculated.
c) Repeatability
Repeatability of measurement of the peak area was determined by spotting 2500 ng/spot of
Letrozole of drug solution on a pre-coated TLC plate. The separated spots were scanned six
times without changing the position of the plate and the percentage RSD was calculated.
d) Limit of Detection (LOD) and Limit of Quantification (LOQ)
The detection limit of an individual analytical procedure is the lowest amount of analyte in a
sample which can be detected but not necessarily quantitated as an exact value. The
quantitation limit of an individual analytical procedure is the lowest amount of analyte in a
standard which can be quantitatively determined with suitable precision and accuracy. The
LOD and LOQ were experimentally verified by the known concentration of a standard
solution of Letrozole until the average response approximately 3 or 10 times the standard
deviation of the responses for the 6 replicate determinations.
e) Specificity
It was observed that other constituents’ presents in the formulation did not interfere either
with the peak of Letrozole. Therefore the method was specific. The overlay spectrum of the
standard Letrozole spots present in the samples was found to be similar or overlap. The peak
purity of the Letrozole was assessed by comparing the spectra at three different levels, viz.
peak start, and peak apex and peak end positions of the spot.
f) Robustness of the method
The robustness of an analytical procedure is a measure of its capacity to remain unaffected by
small changes in the mobile phase composition, mobile phase volume and duration of mobile
g) Ruggedness
It expresses the precision within laboratory variations like different days, different analyst,
and different equipments. Ruggedness of the method was assessed by spiking the standard
concentrations of Letrozole 2500 ng/spot, 6 times in two different days with different analyst.
RESULTS AND DISCUSSION
A HPTLC method was developed for the estimation of Letrozole in tablet dosage forms,
which can be conveniently employed for routine quality control in pharmaceutical dosage
forms.
1. Analysis of Formulation
The percentage of drug in formulation, mean and relative standard deviation were calculated.
The result of analysis showed that the amount of drug present in the formulation is in good
[image:6.595.160.432.599.720.2]correlation with the label claim of the formulation
Table 1. Assay of Letrozole in tablet Dosage Form.
*- each value is the mean of six observations
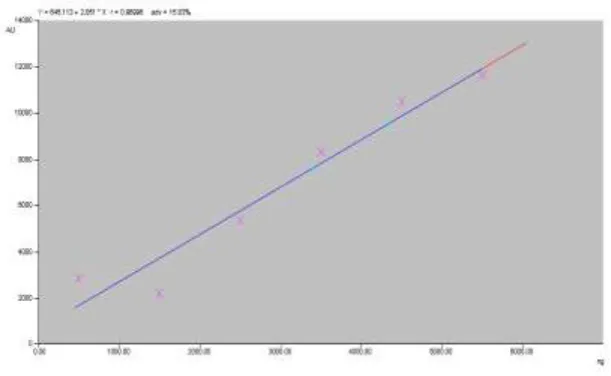
2. Linearity
Letrozole was found to be linear in the range of 500 to 5500 ng/spot. The correlation
coefficient of Letrozole was found to be 0.9699. The linearity range of Letrozole was
shown in Table 2 . The calibration curves was plotted between peak area and concentration of the standard solutions (Fig: 4 ).
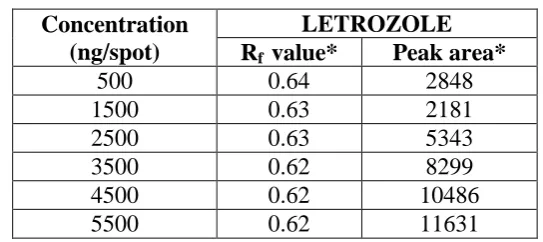
Table 2. Linearity range of Letrozole Concentration
(ng/spot)
LETROZOLE Rf value* Peak area*
500 0.64 2848 1500 0.63 2181 2500 0.63 5343 3500 0.62 8299 4500 0.62 10486 5500 0.62 11631 *- each value is the mean of six observations
Formulation (Letrozole)
Labeled amount (mg)
Amount found (mg)
Percentage Assay (%w/w)
The calibration graph shows that linear response was obtained over the range of
[image:7.595.143.449.133.321.2]concentrations used in the assay procedure. The range demonstrates that the method is linear.
Fig 4. Calibration curve for Letrozole
3. Accuracy (Recovery studies)
The accuracy of the method was determined by recovery experiments. A known quantity of
the pure drug was added to the pre-analyzed sample formulations at 50%, 100% and 150%
levels. The recovery studies were carried out 6 times of each level and the percentage
recovery and percentage relative standard deviation were calculated and given in Table 3.
The percentage recovery of Letrozole was found to be in the range of 99.3-99.8%
Table 3. Recovery studies of Letrozole
Drug
Label Claim mg/tab
Spike Level (%)
Amount of drug added
(ng/spot)
Amount of drug recovered
(ng/spot)
Percentage Recovery
(%)
%RSD*
Letrozole 2.5
50 250 248.3 99.3 0.36 100 500 498.5 99.7 0.31 150 750 748.6 99.8 0.27 *-Each value is a mean of six observations.
4. Precision
The precision of the method was determined by studying reproducibility and repeatability.
The area of drug peaks and percentage relative standard deviation of intraday and inter day
Table 4. Intra-day and inter-day precision of the developed method Concentration
(ng/spot)
Intraday Interday
Peak
area SD
%RSD *
Peak
area SD
%RSD * LETROZOLE
1500 2156 33.37 1.54 2154 31.69 1.46 2500 5432 31.19 0.40 5496 25.17 0.42 3500 8398 14.95 0.17 8351 23.11 0.30 *- each value is the mean of six observations
5. Repeatability
Repeatability of measurement of the peak area was determined by spotting 2500 ng/spot of
Letrozole of drug solution on a pre-coated TLC plate.
6. LOD and LOQ of letrozole Table 5. LOD and LOQ
Parameter LETROZOLE (ng/spot)
LOD 42.81 LOQ 129.74
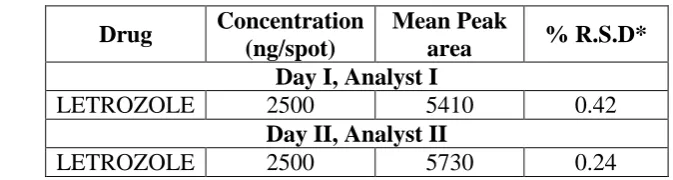
7. Ruggedness
The sample was analyzed by a different chemist and same instruments on a different day
have been performed. The deviation among the results obtained by two chemists on a
different day is well within the limits. Hence the method is rugged.
Table 6.Ruggedness
Drug Concentration (ng/spot)
Mean Peak
area % R.S.D* Day I, Analyst I
LETROZOLE 2500 5410 0.42
Day II, Analyst II
LETROZOLE 2500 5730 0.24 *- each value is the mean of six observations
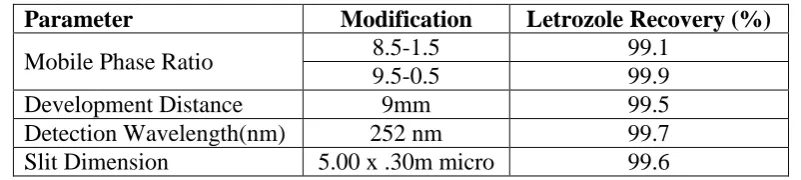
8. ROBUSTNESS
[image:8.595.119.456.531.621.2]The Robustness studies were performed for the standard solutions and were presented in
Table 7 .Robustness studies
CONCLUSION
Simple, accurate, reproducible, robust and cost effective HPTLC chromatographic method
requiring simple reagents were developed and statistical analysis proved that method are
reproducible and selective for quantitative determination of Letrozole in pharmaceutical
dosage form.
It was concluded that developed method offered several advantages such as rapid, cost
effective, simple mobile phase and it is in good agreement with the label claim of the drug.
The additives present in the pharmaceutical formulation of the assayed sample did not
interfere with determination of Letrozole HPTLC method can be used for routine analysis of
Letrozole in their dosage form without any interference of excipients.
REFERENCES
1. https://en.wikipedia.org/wiki/Letrozole
2. M.Mathrusri Annapoorna, Stability indicating liquid chromatographic method for the
determination of letrozole in pharmaceutical formulations, Journal of pharmaceutical
analysis, August 2012; 2(4): 298-305.
3. T.K Laha, R.K Pat naik and S.Sen, Reverse phase HPLC method for the analysis of
letrozole in pharmaceutical dosage forms, Indian Journal of pharmaceutical sciences 2008
May-june; 70(3): 401-403.
4. Pallavi S,Vasanth P M,Ramesh T,Ramesh Malothu, Development and validation of
RP-HPLC method for the determination of letrozole in bulk and dosage form, International
Research Journal of Pharmacy, IRJP., 2012; (11): 3-5.
5. Mondal,N.; Pal,T.K; Ghosal,S.K, Development and validation of a spectrophotometric
method for estimation of letrozole in bulk and pharmaceutical formulation, Die
pharmazie-An International Journal of pharmaceutical sciences, August 2007; 62: 8, 1,
597-598.
Parameter Modification Letrozole Recovery (%)
6. Vikram kumar, Priya kamle, Akash mithal, (High Performance Thin Layer
Chromatography (HPTLC): A Review), International Journal of Analytical and
Bioanalytical Chemistry, 2014; 4(2): 42-44.
7. ICH, Q2A, 1994, Validation of Analytical procedure: Methodology. In Proc. Int. Con.
Harmonization, Geneva.
8. International Conference on Harmonization. Q2A: Text on Validation of Analytical
Procedures. Federal Register; 1995; 60(40): 11260–2.
9. ICH: Q2B Analytical Validation Methodology (November 1996)
10.International Conference on the Harmonization of Technical Requirements for t h e
Registration of Pharmaceuticals for Human Use (ICH) “Q2A”: Validation of Analytical