DEVELOPMENT AND VALIDATION OF RP -HPLC METHOD
FOR THE ESTIMATION OF SITAGLIPTIN PHOSPHATE IN
BULK AND TABLET DOSAGE FORM
Ne ha Sunil Dangi*, S. R. Bavas kar and Dr. S. D. Barhate
Departme nt of Qualit y Assura nce, Shree Sureshda da Jain Instit ute of
Pharmac e ut ic a l Educat io n and Researc h, Jamne r - 424206.
ABSTRACT
A simple new, precise, economic reverse phase high performance
chromatographic method has been developed and validated for the
estimation of Sitagliptin phosphate in bulk and tablet dosage form. The
estimation is done by using C18 Primesil (250mm x 4.6mm;5µm)
column and mobile phase is Methanol: Water (50:50 % v/v), pH is
maintained at 3 by using Orthrophosphoric Acid. The chromatographic
separation was performed with the UV detector set at 264 nm and flow
rate is maintained at 0.7ml/min. The method was validated and found
to be linear in the range of 20 - 100 µg/ml and correlation coefficient
was found to be 0.999. The assay of Sitagliptin was found to be
99.15%. The results of the study showed that the proposed RP-HPLC
method is simple, accurate and economical which is useful for the
routine determination of Sitagliptin phosphate in bulk and its pharmaceutical dosage form.
KEYWORDS: Sitagliptin Phosphate, RP-HPLC, Method development, Validation.
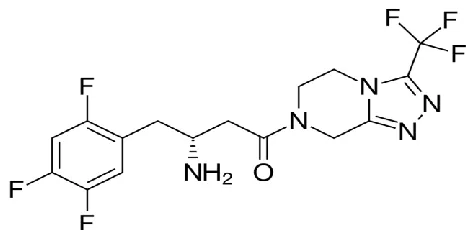
[image:1.596.179.412.629.744.2]INTRODUCTION
Fig. 1 Structure of Sitagliptin
Volume 5, Issue 9, 773-781. Research Article ISSN 2277– 7105
Article Received on 02 July 2016,
Revised on 23 July 2016, Accepted on 12 Aug 2016
DOI: 10.20959/wjpr20169-6878
*Corresponding Author
Ne ha S uni l Dang i
Department of Quality
Assurance, Shree
Sureshdada Jain Institute
of Pharmaceutical
Education and Research,
Sitagliptin Phosphate chemically
7-[(3R)-3-amino-1-oxo-4-(2,4,5-triflurophenyl]-5,6,7,8-tetra hydro-3-(trifluromethyl)-1,2,4-triazole [4,3] pyrazoline phosphate(1:1) monohydrate. It
is a novel hypoglycemic drug that belongs to dipeptidyl-peptidase 4 inhibitor class which
stimulates glucose-dependent insulin release.[1,2] Recently the combination of two drugs has been recommended in the treatment of diabetes mellitus to improve glycemic control.
Sitagliptin generally used in combination e.g. Sitagliptin-Metformin, Sitagliptin-Simvastatin.
Sitagliptin increases the level of incretin level (GLP-1, GIP) which inhibits the release of
glucagon by pancreas, and decreases blood glucose, but more significantly increases Insulin
secretion.[3]
Literature survey reveals that various bio-analytical RP-HPLC methods are there[1,2] as well as few spectrophotometric methods are available for estimation of Sitagliptin in bulk and
pharmaceutical dosage form.[3-4] Two RP-HPLC methods are also there, but these methods are not economical.[8-9] Hence there is need to develop an RP-HPLC method for the estimation of Sitagliptin Phosphate in the Tablet formulations. The aim of present analytical
research is to develop simple, precise, accurate, rapid and economical RP-HPLC method for
the estimation of Sitagliptin in tablet formulation.
MATERIALS AND METHODS Materials
Sitagliptin was purchased from Swapnroop drug and pharmaceuticals. Commercial Tablet of
Sitagliptin phosphate named ISTAVEL was purchased from local market. All other
chemicals and reagents used are HPLC grade manufactured by Merck Ltd. India.
Instrument and chromatographic conditions
High performance liquid chromatography YounglineAcme9000 having autochro-3000
software containing primesilC18 column (250mm X 4.6mm, 5µm) was used for the study.
UV-Spectrophotometer is used as a detector. The mobile phase used was Methanol: Water
(0.05% Orthophosphoric acid) in the ratio of 50:50 % v/v maintained at pH 3 with a flow
rate 0.7ml/min. Mobile phase and sample solutions were filtered through a 0.45 μm
membrane filter and degassed in Sonicator. The effluent was detected at 264 nm. The
Preparation of mobile phase
The mobile phase was prepared by Mixing Methanol (50ml) and Water (50ml) and adjusted
to the pH 3 with Ortho Phosphoric Acid. The prepared mobile phase was degassed by
ultrasonication for 20 min so as to avoid the disturbances caused by dissolved gases. This
degassed mobile phase was filtered through 0.45 g membrane nylon filter to remove smaller
particles that may be present in mobile phase.
Preparation of solutions Standard stock solution
10 mg of Sitagliptin pure drug was dissolved in 10 ml volumetric flask by sufficient quantity
of Methanol: water (50:50). Volume was made up to 10ml, this will produce 1000μg/ml
standard stock solution of Sitagliptin.
Working standard solution
1mL of standard stock solution was pipetted into 10mL volumetric flask and diluted up to the
mark with diluent and filtered through 0.45μ Millipore Nylon filter to obtain concentration of
10μg/ml.
EXPERIMENTAL
Study of spectra and selection of wavelength
UV Detector was selected and solution 10 µg/mL of Sitagliptin was scanned in the range of
400 – 200nm. A fix concentration of analyte were analysed at different wavelengths. As per
response of analyte, 264nm wavelength was selected. The UV Spectra of Sitagliptin is as
shown in Fig. 2.
Analysis of marketed formulation
For analysis of the tablet dosage form, 20 tablets were weighed individually and their average
weight was determined which is 4.22gm, after that they were crushed to fine powder. 42.2
gm sample of Sitagliptin accurately weighed and transferred to 10 ml volumetric flask which
is equivalent to 10mg of pure drug. Powder was dissolved with some amount of mobile phase
and sonicate to dissolve it completely and to remove dissolved gases. Then it is filtered
through 0.45 µg nylon membrane filters. Then volume was made up to mark with mobile
phase. It will make the solution of 1000 µg/ml. From the above solutions 0.60 ml from Stock
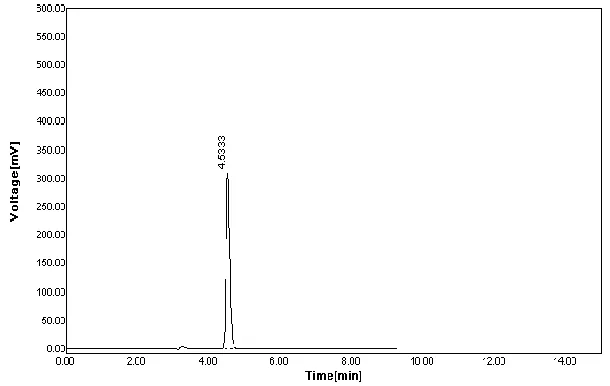
was taken and diluted to 10 ml with mobile phase to get a solution containing 60µg/ml. The
amount of Sitagliptin was calculated by extrapolating the value of area from the calibration
[image:4.596.146.451.317.510.2]curve. Shown in Fig. 3.
Fig. 3 Chromatogram of Sitagliptin
Table 1 Analysis of marketed formulation Sr.
no. Concentration Area
Amt. found
%Label Claim 1 60 1774.32 59.40 99.00 2 60 1779.25 59.57 99.28 - Mean 1776.78 59.49 99.15 - SD 3.4860 0.1202 0.1979
- %RSD 0.20 0.20 0.20
Method validation
The method was validated in terms of the following parameters; linearity, accuracy,
precision, repeatability, robustness, LOD, LOQ and system suitability parameters as per the
1. Linearity
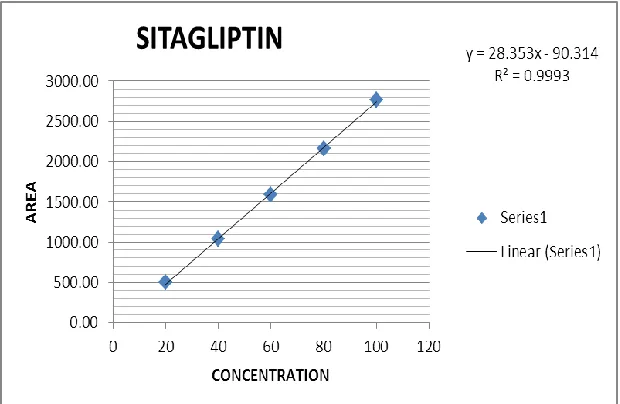
From Sitagliptin standard stock solution, different working standard solution (20, 40, 60, 80,
100μg/ml) were prepared in mobile phase. Chromatogram was recorded. The plot of linearity
plotted graphically as a function of analyte concentration is as shown in fig. 4 and table 2 and
3.
[image:5.596.144.454.188.390.2]Fig. 4 Calibration curve of Sitagliptin
Table 2 Data of Linearity
Sr. no. Concentration μg/ml Area
1 20 500.98
2 40 1034.08
3 60 1583.81
4 80 2164.20
5 100 2771.20
Table 3 Statistical data of linearity
Regression Equation Data Y = mx+c
Slope (m) 28.353
Intercept© 90.314
Correlation coefficient 0.999
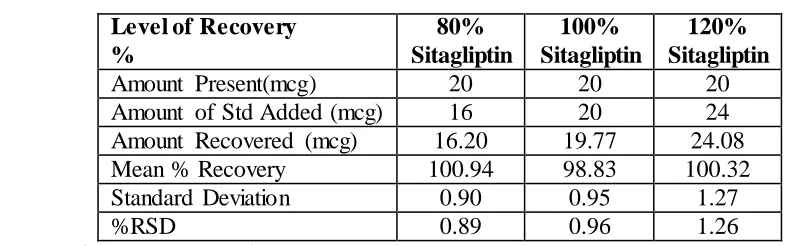
2. Accuracy
The accuracy study was performed at three different levels (80%, 100% and 120% of the test
concentration). The mean % recoveries were found to be between 98–102% as required by
ICH guidelines. The results of the recovery studies and its statistical validation data are given
Table 4 Recovery study of Sitagliptin Level of Recovery %
80% Sitagliptin
100% Sitagliptin
120% Sitagliptin
Amount Present(mcg) 20 20 20
Amount of Std Added (mcg) 16 20 24 Amount Recovered (mcg) 16.20 19.77 24.08 Mean % Recovery 100.94 98.83 100.32
Standard Deviation 0.90 0.95 1.27
%RSD 0.89 0.96 1.26
*Mean of each three readings
3. Precision
Precision of the analytical method is expressed as the series of the measurement. It was
ascertained by replicate estimation of the drug by the proposed method as shown in Table No.
5.
Table 5 Intra-day precision
Conc. Mean Area Amt Found % Amt Found SD RSD 40 1044.85 40.03 100.27 3.10 0.30
60 1589.11 59.23 98.73 1.97 0.12
80 2163.30 79.49 99.36 5.65 0.26
*Mean of each three readings
Table: 6 Inter-day precision
Sr No. Conc Mean Amt Found % Amt Fnd SD RSD 1 40 1042.85 40.11 100.27 5.93 0.57 2 60 1589.11 59.43 99.06 7.93 0.50 3 80 2161.30 79.42 99.27 7.06 0.33 *Mean of each three readings
4. Repeatability
Table 7 Repeatability study of Sitagliptin
Conc. µg/ml Peak Area Amount Found Percent Amount Found
40 1010.35 38.82 97.05
40 1032.13 39.59 98.98
40 1033.12 39.62 99.32
- Mean 39.34 98.45
- SD 0.45 1.22
5. Robustness
The changes were did in flow rate (± 0.1 ml/min), pH of mobile phase composition and
wavelength (± 1 nm). %RSD for peak area was calculated which should be less than 2%. As
shown in Table No. 8.
Table: 8 Result of Robustness study of Sitagliptin
6. LOD and LOQ
The Limit of detection and Limit of Quantitation were separately determined which is based
on the standard deviation of response of the calibration curve. LOD and LOQ is as follow
LOD of Sitagliptin = 0.8299 LOQ of Sitagliptin = 2.51
7. System suitability
System suitability parameters were studied as shown in Table No. 9.
Table: 9 System Suitability studies result
System Suitability Parameters Proposed Method
Retention Time 4.8890
Area 1025.2073
Theoretical Plate Number 14882.1
Tailing Factor 1.2354
RESULT AND DISCUSSION
The proposed method was developed and validated as per the ICH guidelines. Linearity was
observed over a concentration range of 20 to 100μg/ml. The accuracy of method was
determined by calculating mean percentage recovery at 80,100 and 120 % level and % RSD
was found to be less than 2. In this method precision was studied as repeatability and inter
and intra-day variations for both drugs and both were found in limit. System suitability
parameters were satisfactory and the theoretical plates were obtained above 2000. Tailing
Parameter Concentration
(Mcg)
Area
factor was found below 2. %RSD also found below 2%. The assay of Sitagliptin was found to
be 99.15% and the low % RSD value confirms the robustness of the method.
CONCLUSION
The proposed RP-HPLC method was found to be simple, accurate, precise, linear, robust and
economic for quantitative estimation of Sitagliptin phosphate in bulk and its formulation. The
proposed RP-HPLC method was cost effective and less time consuming. The values for
system suitability parameters showed feasibility of this method for routine pharmaceutical
application. Hence, the present RP-HPLC method is suitable for routine assay of Sitagliptin
phosphate in bulk and tablet dosage form in the quality control laboratories.
ACKNOWLEDGEMENT
The authors are thankful to S.S.J.I.P.E.R, Jamner, Maharashtra, India, for providing the
necessary facilities and help in my dissertation work.
REFERENCES
1. Badyal DK and Kaur J. Sitagliptin: a new class of oral drug for type 2 diabetes. JK
Science, 2008; 10(2): 93-98.
2. Chu XY, Bleasby K, Yabut J, Cai X, Chan GH, Hafey MJ, Xu S, Bergman AJ, Braun
MP, Dean DC and Evers R Transport of the dipeptidyl peptidase-4 inhibitor sitagliptin by
human organic anion transporter 3, organic anion transporting polypeptide 4C1, and
multidrug resistance P-glycoprotein . The Journal of Pharmacology and Experimental
Therapeutics, 2007; 321(2): 673-683.
3. Monila. N et.al. Spectrophotometric method for determination of Sitagliptin Phosphate in
bulk and also in pharmaceutical formulations. Journal of Pharmacy and Biological
Sciences, 2012; 1(6): 37-40.
4. Jeyabalan.G and Narendra Nyola spectrophotometric method for the Determination of
sitagliptin in pure and tablet dosage form. Journal of Pharmaceutical Analysis, Oct–Dec,
2012; 1(1): 19-23.
5. Rolim M.B et.al UV-spectrophotometric method for the analysis and dissolution studies
of Sitagliptin phosphate in tablets Latin American Journal of Pharmacy, 2010; 29(6):
962-967.
6. Parag Pathade et.al stability indicating UV Spectrophotometric method has been
developed for quantitative determination of Sitagliptin Phosphate in bulk and
7. Tarkase K.N et.al UV spectrophotometric method has been developed for Estimation of
Sitagliptin phosphate in tablet dosage form. Scholars Research Library, 2013; 5(3): 315-
318.
8. Deepthi.v a novel stability-indicating RP-HPLC method for quantitative analysis of
Sitagliptin in the bulk drug and in its pharmaceutical dosage form. International journal of
pharmacy and pharmaceutical sciences, 2013; 5(1): 320-325.
9. Lavanya R., Md. Yunoos development and validation of RP-HPLC method for the
estimation of Sitagliptin Phosphate in bulk and its tablet dosage form. Journal of