www.wjpr.net Vol 7, Issue 02, 2018. 619
DETERMINATION OF OXYFEDRINE DOSAGE FORMS BY D.D.Q
METHOD
Mallapu E. Rani*
Associate Professor, Head of the Dept of Chemistry, Rayalaseema University, Kurnool –
518002, A.P. India.
ABSTRACT.
This paper describes the validation of a new spectrophotometric
method for the assay of oxyfedrine as in pharmaceutical dosage forms,
the DDQ method employs for the estimation of drugs containing amino
group and phenolic groups. In this method, the reaction of oxyfedrine
with 2,3 – dichloro -5-6 – dieyano -1,4 benzoquinone (DDQ)
inchloroform mixture forms honey colour – charge – transfer complex.
The honey colour charge – transfer complex solution was stable for
more than 24 hrs. The absorbance of the honey colour solution was
measured at the wave length 470mm against the regent blank. The
calibration graph was obtained by plotting absorbance values against
the concentrations of oxyfedrine solution. The calibration curve was found to be linear over a
concentration range of 50 to 250g / ml of oxyfedrine. The linearity of the curve obtained
indicate that it obeys Beer’s law. Results of analysis were validated statistically and by
recovery studies. The procedures described were successfully applied to the determination of
oxyfedrine in tablets.
KEYWORDS:D.D.Q method by speetrophotuetrically oxyfedine, Method of validation.
INTRODUCTION
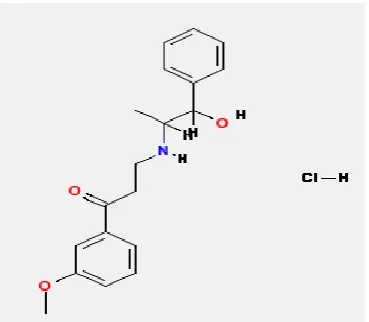
Oxyfedrine chemically 3–((1–hydroxy –1–phenyl–propan–2 yl)amino]–1–(3–methoxy
phenyl) propan – 1 – one. Oxyfedrin is soluble in chloroform. It is commercially available in
the markets.
1) ILDAMEN 8mg tablets, 2) ILDAMEN 24mg Tablets
Volume 7, Issue 02, 619-627. Research Article ISSN 2277–7105
Article Received on 25 Nov. 2017,
Revised on 15 Dec. 2017, Accepted on 04 Jan. 2018
DOI: 10.20959/wjpr20182-10553
*Corresponding Author Mallapu E. Rani
Associate Professor, Head of
the Dept of Chemistry,
Rayalaseema University,
Kurnool – 518002, A.P.
www.wjpr.net Vol 7, Issue 02, 2018. 620 It is used to improve myocardial metabolism.
Survey of literature reveals that various methods were reported for the determination of
oxyfedrine in pharmaceutical formulations. Which includes in vitro and In vivo synergism
between Tetracycline and the cardio vascular agent oxyfedrine HCl against common.
Bacterial strains 54, Antimicrobial potentiality of a new non – antibiotic, the cardiovascular
drug oxyfedrine hydrochloride 55, oxyfedrine in myocardial stunning 56 etc.
The present investigation was under taken with the aim of developing new, simple, rapid and
accurate method. Hence this spectrophotometric method based on a charge transfer
[image:2.595.206.391.298.459.2]complexation reaction.
Fig 3.2.4: Structure of oxyfedrine.
EXPERIMENTAL
APPARATUS
1. ELICO UV, Visible double beam spectrophotometer with 10 nm matched quartz cuvettes
used for adsorbance values of the drug solution. This instrument provides a unique
monochromatic design and a variety of microprocess controlled features to give fast and
accurate spectrophotometric measurements.
Reagents
All chemicals used were of analytical reagent grade. Chloroform was used through out the
www.wjpr.net Vol 7, Issue 02, 2018. 621 D.D.Q: - i.e. 2,3 dichloro -5,6 dicyano – 1,4- Benzoquinone in chloroform.
D.D.Q solution (100 g/ml), 50 mg was dissolved in chloroform and the resulting solution
was made up to the mark in the 50 ml standard flask with chloroform.
2. Oxyfedrin Solution
Pure oxyfedrin solution (50mg) was dissolved in 50 ml chloroform. Futher the stock solution
was diluted to 50 ml with chloroform to get working concentration of 50 µg / ml.
Spectrophotometry
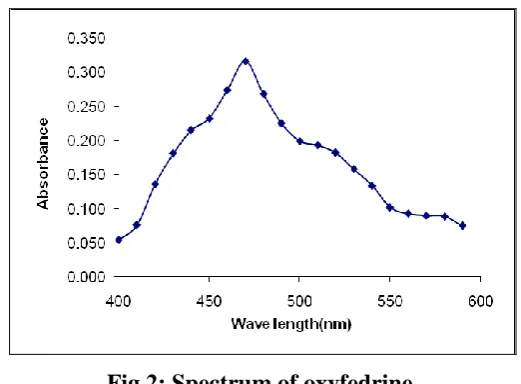
The estimation of oxyfedrine by D.D.Q method. In this method was based on the reaction of
oxyfedrine with 2,3 – dichloro – 5,6 – dicyano -1,4 – benzoquinone (D.D.Q) to form honey
colour charge – transfer complex solution. This honey colour solution was stable for more
than 24 hrs. The honey colour solution was used to determine the oxyfedrine spectro
photometrically. This sample solution was measured at the wave length range of 400 to
600nm, against the reagent blank. The blank were prepared for this study, the reagent blank
containing optimum concentrations of the reagents expect drug.
The absorbance was found to decrease linearly with increasing concentrations of oxyfedrine
and this forms the basis for the determination of drug. Finally the estimation of the drug was
made through the calibration curve.
PROPOSED ASSAY PROCEDURE
A series of 25ml volumetric flasks, 0.5ml, 1ml. 1.5ml 2.0, 2.5ml of the working standard
solution of the drug was pipette into each flask. To each flask, were varying amounts of 0.5 –
2 ml of DDQ reagent solution are added to form honey colour solution. The final volume was
brought to 10 ml with chloroform. The resultant solution in each flasks was well mixed and
allowed to stand for 5 minutes for complete the reaction The absorbance of the honey colour
solution was measured at 470nm by using spectrophotometer against a black solution. The
www.wjpr.net Vol 7, Issue 02, 2018. 622 Fig 2: Spectrum of oxyfedrine.
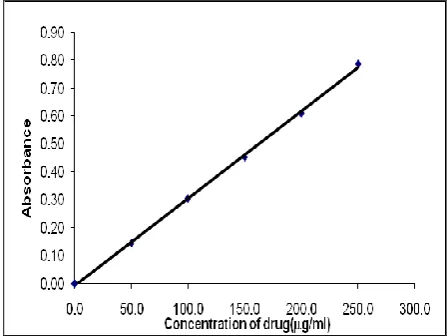
The oxyfedrine curve was obtained by plotting absorbance values against the amount of
standard drug. The amount of oxyfedrine present in the sample was computed from the
calibration curve are presented in figure – 3 and the result is given in Table – 1.
Table 1: spectral data for calibration curve.
Solvents Durg solution)
0.5 ml 0.151
1 ml 0.312
1.5 ml 0.452
2 ml 0.613
2.5 ml 0.792
The drug calibration graph was obtained by plotting absorbance values against the
concentration of oxyfedrine solution. The calibration curve was found to be linear over a
concentration range of 50 to 250 g/ml of oxyfedrine. The linearity of the curve obtained
indicates that it obeys Beer’s law. The amount of oxyfedrine present in the sample was read
from the calibration graph. The results are present in Figure - 3 and the result is given in table
– 1.
The drug calibration graph was obtained by plotting absorbance values against the
concentration of oxyfedrine solution. The calibration curve was found to be linear over a
concentration range of 50 to 250 g/of oxyfedrine. The linearity of the curve obtained
indicates that it obeys Beer’s law. The amount of oxyfedrine present in the sample was read
www.wjpr.net Vol 7, Issue 02, 2018. 623 Fig.5.1.2: Calibration curve of oxyfedrine.
Validation of the Method
This method was validated in terms of linearity, accuracy, precision, specificity and
reproducibility, of the sample applications. The linearity of this method was investigated by
serially diluting the stock solutions of oxyfedrine and measured the absorbance value at
470mm by spectrophotometer. Calibration curves were constructed by plotting the
absorbance difference values against the amount of drug in g/ml.
Statistical analysis
A statistical analysis was performed on the statistically significant variables using the
statistical soft ware. The following pare meters were determined, standard deviation (S.D),
Relative standard deviation (RSD) Student t – test, F-test.
The standard deviation (SD) Relative standard deviation (RSD%) and t – test and F– test of
variation of the oxyfedrine was calculated from five measurements of replicate samples and
the results are summarized in table – 2.
Table 2:- Statistical Analysis of Estimation of oxyfedrine.
Table 1: Assay of oxyfedrine in tablets.
Sample Labelled
amount (mg)
*Amount found by proposed method ± S.D
% of Label claim
RSD%* t*cal F*
*Amount found by Reference method ± S.D Tablet 1 24 23.953 ± 0.0229 99.8 0.0956 0.6750 1.3418 23.962 ± 0.0265 Tablet 2 24 23.941 ± 0.0290 99.75 0.1213 1.3069 0.8351 23.962 ± 0.0265 Tablet 3 24 23.949 ± 0.0462 99.79 0.1931 0.5971 0.3295 23.962 ± 0.0265
*
Average of six determination based on label claim
www.wjpr.net Vol 7, Issue 02, 2018. 624 RSD : Relative standard deviation ‘a’ Calculated ‘t’ value by proposed method.
‘F’ Calculated ‘F’ value by proposed method.
The values of standard deviation and Relative standard deviation are low, indicated high
accuracy and reproducibility of this method. The data of assay values of commercial
formulations was subjected to statistical evaluation for student ‘t’ test to study the proposed
method. The calculated ‘t’ values are less than ‘t’ theoretical values with 4(n-1 = 5-1) degree
of freedom at 5% level of significance indicate that there is no significant difference between
proposed method and standard method.
RESULTS AND DISCUSSION
The present study was carried out to develop a simple, rapid, sensitive, precise, reproducible
and accurate spectrophotometric method for the estimation of oxyfedrine in pharmaceutical
dosage forms.
In this method the drug react with DDQ solution to form honey colour charge complex. The
honey coloured charge complex solution formed is measured at 470 nm against reagent
blank. The amount of drug read from calibration curve. The calibration curve is linear over
the range of 50-250 μg/ml of oxyfedrine. The values of Standard deviation, RSD%, tcal, F
test, are shown in Table.5.1.4. The values of standard deviation, RSD% are low, indicates
high accuracy and reproducibility of the method. The data of assay values of commercial
formulations is subjected to statistical evaluation for student ‘t’ test to study the proposed method. The calculated ‘t’ values are less than ‘t’ theoretical values with 4 (n-1= 5-1) degrees
of freedom at 5% level of significance indicate that there is no significant difference between
proposed method and standard method.
The proposed method is found to be simple, precise, accurate and time saving, reproducible
and can be conveniently adopted for routine analysis of estimation of oxyfedrine in bulk
drugs samples and pharmaceutical formulations.
REFERENCES
1. Qi M, Wang P, Cong R and Yang J., J Pharm Biomed Anal, 2004; 35(5): 1287-91.
2. Zhao G.Z and Li H.K. Guang Pu Xue Yu Guang Pu Fen Xi, 2003; 23(1): 157-9.
3. Suhagia B.N, Shah S.A, Rathod I.S, Patel H.M and Doshi K.R, ParmarVK., Indian
www.wjpr.net Vol 7, Issue 02, 2018. 625 4. Lim J, Jang B, Lee R, Park S and Yun H., J Chromatogr B Biomed Sci Appl, 2000:
746(2): 219-25.
5. Feng Y.C and H.u C.Q., J Pharm Biomed Anal, 2006; 41(2): 373-84.
6. Egli K.L., J Assoc Off Anal Chem, 1985; 68(4): 803-6.
7. Bighley L.D, Mc Donnell J.P., J Pharm Sci, 1975; 64(9): 1549-53.
8. Watts P.J, Tudor A, Church S.J, Hendra P.J Turner P, Melia C.D and Davies M.C., Pharm
Res, 1991; 8(10): 1323-8.
9. Pastor-Navarro N, Gallego-Iglesias E, Maquieira A and Puchades R., Anal Chim Acta,
2007; 583(2): 377-83.
10.Mennickent S, Pino L, Vega M, Godoy CG and de Diego M., J Sep Sci, 2007; 30(5):
772-7.
11.Mennickent S, Pino L, Vega M and de Diego M., J Sep Sci, 2008; 31(1): 201-6.
12.Trabelsi H, Bouabdallah S, Bouzouita K and Safta F., J Pharm Biomed Anal, 2007; 29(4):
649-57.
13.Fang J and Gorrod J.W.J Chromatogr, 1993; 614(2): 267-73.
14.Igarashi K and Castagnoli N., J Chromatogr, 1992; 579(2): 277-83.
15.Lea A.R, Hailey D.M and Duguid P.R., J Chromatogr, 1982; 250: 35-42.
16.Ouanês S, Kallel M, Trabelsi H, Safta F and Bouzouita K., J Pharm Biomed Anal, 1998;
17(3): 361-4.
17.Vujic Z, Radulovic D and Zivanovic L., Farmaco, 1995; 50(4): 281-4.
18.Rahman N, Rahman H and Azmi S.N., Chem Pharm Bull, 2005; 53(8): 942-8.
19.Gupta K.R, Tajne M.R and Wadodkar S.G., Indian Journal of Pharmaceutical Sciences,
2008; 70(4): 511-513.
20.Garg G, Saraf S and Saraf S.J., AOAC Int, 2008; 91(5): 1045-50.
21.Liu H, Ren J, Hao Y, Ding H, He P and Fang Y., J Pharm Biomed Anal, 2006; 42(3):
384-8.
22.Chawla S, Ghosh S, Sihorkar V, Nellore R, Kumar T.R and Srinivas NR.Biomed
Chromatogr, 2006; (4): 349-57.
23.HoraiY, IshizakiT, KusakaM, Tsujimoto G, and HashimotoK., Ther Drug Mnit, 1988;
10(4): 42833.
24.Winkler H, Ried W and Lemmer B., J Chromatogr, 1982; 228; 223-34.
25.Lea A.R and Hailey D.M, Duguid P.R., Journal of Pharmaceutical and Biomedical
www.wjpr.net Vol 7, Issue 02, 2018. 626 26.Colbourne P.D, Baker G.B and Coutts R.T., J Pharmacol Toxicol Methods, 1997; 38(1):
27-32.
27.Jianshe Huang, Jinying Sun, Xiaoguang Zhou and Tianyan You., Analytical Sciences,
2007; 23(2): 183.
28.El-Desoky H.S and M.M. Ghoneim., Journal of Pharmaceutical and Biomedical Analysis,
2005; 38(3): 543-550.
29.Altiokka G, and Atkosar Z., J Pharm Biomed Anal, 2002; 27(5): 841-4.
30.Fdez de Betono S. (1); Arranz Garcia A and Arranz Valentin J. F., Journal of
pharmaceutical and biomedical analysis, 1999; 20(4): 621-630.
31.E. Appel, G. Planz, B. Schmid, D. Palm and H. Grobecker., Biomedical and Life
Sciences, 2004; 280(4): 373-390.
32.Atherden, L.M., Edt, Bentley and Drivers, Text Book of Pharmaceutical Chemistry, 8th
Edn., Oxford University Press, 1996.
33.Melentyeva, G., Antonova, L., Pharmaceutical Chemistry, Mir Publishers, Moscow,
1988.
34.Wolff, M.E., Edt., Burger’s Medicinal Chemistry, Part IV, 4th Edn., Wiley Interscience,
New York, 1981.
35.Deorge, R.F., Edt., Wilson and Gisvolds’s Text book of Organic and Medicinal and
Pharmaceutical Chemistry, 8th Edn., Lippincott Company, 1982.
36.Pandeya, S.N., A Text Book of Medicinal chemistry, Vol.I and II, 2 nd Edn., 2003.
37.CDER Guideline on Validation of Chromatographic Methods, Reviewer Guidance of
Chromatographic Methods, US Food and Drug Administration, Center for Drugs and
Biologics, Department of Health and Human Services, 1994.
38.ICH, Q2A: Validation of Analytical Methods, Definitions and Terminology, 1994.
39.ICH, Q2B: Analytical Validation-Methodology, 1996.
40.The Drugs and Cosmetics Act and Rules, Government of India Publications, 1984.
41.Indian Pharmacopoeia, Vol I, II, 1996 & Addendum 2005 and Vet, Government of India,
Ministry of Health and Family Welfare, Controller of Publications, Delhi, 2000.
42.United States Pharmacopoeia USP 29 & NF 24, 2006 and Supplements, USP convention
Inc., Rockville, 2006.
43.European Pharmacopoeia, 5th Edn., 2005 and Supplement, Council of Europe, Strasbourg,
2004.
www.wjpr.net Vol 7, Issue 02, 2018. 627 45.Sweetman, S.C., Martindale, The Complete Drug Reference (Extra Pharmacopoeia) 33rd
Edn., The Pharmaceutical Press, London, 2002.
46.The Merck Index, 13th Edn., Merck & Co Inc, New York, 1997.
47.Saletan, D., In: Creative Troubleshooting in the Chemical Process Industries,
48.Blackie Academic Professional, New York, 1996: 284.
49.Cunnif, P., Edt., Official Methods of Analysis of AOAC International, 16th Edn., Vol. 1.
AOAC International, Arlington, 1995.
50.Gilpin, R.K., Pharmaceutical and drugs. In: Meyers, R.A., Edt., Encyclopedia of
Analytical Chemistry 8, Wiley, Chichester, 2000.
51.PDR: Physician’s Desk Reference, 59th Edn, 2005.
52.Sethi, P.D., Quantitative Analysis of Drugs in Pharmaceutical Formulations, Unique
Publishers, 1985.
53.Pesez, M., Bartos, J., Colorimetric and Fluorimetric Analysis of Organic Compounds and
Drugs., Marcel Dekkar Inc., New York, 1974; 83.
54.Kaushiki MAZUMDAR, Noton Kumar DUTTA,Kuppusamy,Asok Kumar,and Sujata
Ghosh DASTIDAR., Biol. Pharm. Bull, 2005; 28(4): 713-717.
55.Mazumdar K, Ganguly K, Kumar K A, Dutta NK, ChakrabartyAN, Dastidar
SG.,Microbiol Res, 2003; 158(3): 259-64.
56.Maulik SK, Seth SD, Maulik M, Manchanda SC., Microbiol Res, 2003; 158(3): 259-64.
57.Wetzelsberger N, Birkel M, Fuder H, Lucker PW, Stiegler S, Thummler D., Institut fur
Klinische Pharmakologie Bobenheim, Grunstadt, Germany.