www.wjpr.net Vol 6, Issue 16, 2017. 1093
DEVELOPMENT AND VALIDATION OF RP-HPLC METHOD FOR
QUANTITATIVE ESTIMATION OF SITAGLIPTIN PHOSPHATE IN
BULK AND PHARMACEUTICAL DOSAGE FORMS
M. Phanisri*1, M. Jhansi Lakshmi1, D. Rama Brahma Reddy2 and H. Padmalatha2
Gyana Jyothi College of Pharmacy, Uppal, Hyderabad -500089, Telangana, India.
ABSTRACT
A simple and rapid reversed phase-high performance liquid
chromatographic method was developed for simultaneous
determination of Sitagliptin Phosphate In Bulk And Pharmaceutical
Dosage forms. The elution was done with a mobile phase of Methanol,
Acetonitrile & 0.1% ortho phosphoric acid in the ratio of 40:55:05 &
adjust to pH 4.1 by using triethyl amine on Zodiac C18 column (250 ×
4.6 mm, 5µ). The wavelength of detector was set at 265 nm. The
reliability and analytical performance of the proposed HPLC procedure
were statistically validated according to the respect of linearity, ranges,
precision, accuracy, repeatability, reproducibility, detection and
quantification limits. Linear ranges were established between 60-210 μg/mL for the drug. The
LOD and LOQ for Sitagliptin was found to be 0.05, 0.16 respectively. The described High
Performance Liquid Chromatography method was successfully employed for the analysis of
pharmaceutical formulations.
KEYWORDS: Sitagliptin, RP- HPLC, validation, UV Detection, Zodiac C18 column.
INTRODUCTION
Sitagliptin phosphate is an oral dipeptidyl peptidase-4 (DPP-4) inhibitor, which improves
glycaemic control by inhibiting DPP-4 inactivation of the incretin hormones glucagon-like
peptide-1 (GLP-1) and glucose-dependent insulinotropic polypeptide (GIP). This increases
active incretin and insulin levels and decreases glucagon levels and post-glucose-load glucose
excursion.
Category: Dipeptidyl peptidase-4 (DPP-4) inhibitor.
Volume 6, Issue 16, 1093-1110. Research Article ISSN 2277–7105
Article Received on 17 October 2017,
Revised on 06 Nov. 2017, Accepted on 27 Nov. 2017
DOI: 10.20959/wjpr201716-10282
*Corresponding Author M. Phanisri
Gyana Jyothi College of
Pharmacy, Uppal,
Hyderabad -500089,
www.wjpr.net Vol 6, Issue 16, 2017. 1094
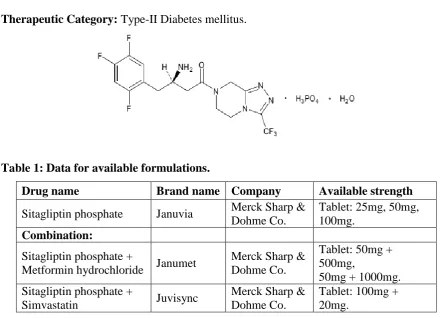
[image:2.595.71.519.60.378.2]Therapeutic Category: Type-II Diabetes mellitus.
Table 1: Data for available formulations.
Drug name Brand name Company Available strength
Sitagliptin phosphate Januvia Merck Sharp &
Dohme Co.
Tablet: 25mg, 50mg, 100mg.
Combination:
Sitagliptin phosphate +
Metformin hydrochloride Janumet
Merck Sharp & Dohme Co.
Tablet: 50mg + 500mg,
50mg + 1000mg. Sitagliptin phosphate +
Simvastatin Juvisync
Merck Sharp & Dohme Co.
Tablet: 100mg + 20mg.
High Performance Liquid Chromatography is the most widely used of all the analytical
separation techniques. The reason for the popularity of the method is its sensitivity, its
suitability for separating non-volatile or even thermally fragile ones, its ready adaptability to
quantitative determinations and above all its wide spread applicability to substances that are
of primary interest to industry, to many fields of science, biomedical applications.
Reverse phase chromatography is a bonded phase chromatographic technique that uses water
as base solvent. Separation is based on solvent strength and selectivity. Separation is also
affected by column temperature and pH. In general, the more polar compounds elute faster than the less polar compounds.
Method validation is an integral part of the method development; it is the process by which a
method is tested by the developer or user for reliability, accuracy and preciseness of its
intended purpose and demonstrating that analytical procedures are suitable for their intended
use that they support the identity, quality, purity, and potency of the drug substances and drug
products. The search for the reliable range of a method and continuous application of this
knowledge is called validation. Simply, method validation is the process of proving that an
www.wjpr.net Vol 6, Issue 16, 2017. 1095 MATERIALS AND METHODS
Drug samples
Sitagliptin phosphate working standard was received as gift sample from Mylan Laboratories
Ltd., Hyderabad, India.
Formulation used
Januvia tablets containing 100mg of sitagliptin phosphate were procured from local
pharmacy.
Reagents and Chemicals used
Sitagliptin phosphate WS (Potency-99.9%).
Acetonitrile (HPLC grade).
Methanol (HPLC grade).
Milliq water.
Ortho phosphoric acid.
Triethyl amine.
Instruments used
Schimadzu AD HPLC system with Rheodyne universal injector 7725 and
LC20-AD UV-Visible detector module equipped with SPINCHROM software was used.
Ultra Sonicator (Make fast clean).
Water bath shaker (Make: Lab tech; Model: HHE-32 cm).
Thermo Orion pH meter.
Analytical balance (Mettler).
Development and Optimization of Chromatographic Condition
Solubility
According to literature review, Sitagliptin phosphate is freely soluble in methanol and
acetonitrile. Therefore the solubility of the drug was checked with different dilutions of
buffer methanol and acetonitrile. Finally methanol and acetonitrile was chosen as solvent for
present work.
Selection of wavelength (max)
By scanning the sample solution of Sitagliptin phosphate by using UV method at a
www.wjpr.net Vol 6, Issue 16, 2017. 1096
length selected was 265 nm because it shows maximum absorbance and was chosen for
further studies.
UV spectrum for Sitagliptin phosphate.
Selection of mode of separation
Appropriate selection of mode of separation depends upon the characteristic nature of the
sample (ionic or neutral) molecular weight and solubility. The nature of Sitagliptin phosphate
is polar hence reverse phase mode was proposed for initial chromatographic conditions.
Optimized chromatographic conditions
Stationary Phase : Zodiac C18 column (250 × 4.6 mm, 5µ).
Pump mode : Isocratic.
Flow rate : 1.0 ml/min.
Column temperature : Ambient.
Selected wave length : 265 nm.
Mobile phase ratio : Methanol, Acetonitrile & 0.1% Ortho phosphoric acid in the
ratio of 40:55:05 & adjust to pH 4.1 by using triethyl amine.
Diluents : Mobile Phase.
Injection Volume : 20 µl.
Run Time : 10 minutes.
Quantitative Estimation of Tablet Formulation by Proposed Method:
Preparation of mobile phase
Prepare 40ml of methanol, 55 ml of acetonitrile and 5ml of 0.1% ortho phosphoric acid was
mixed and degassed in ultrasonic water bath for 5 minutes, and adjust to pH 4.1 by using
www.wjpr.net Vol 6, Issue 16, 2017. 1097 Preparation of working standard solution
Accurately weighed 10 mg of sitagliptin phosphate working standard was taken in 10 ml
volumetric flask, dissolved and diluted to volume with mobile phase and mixed.
Preparation of sample preparation
Exactly 20 tablets were weighed and grinded to fine powder. A quantity of powder equivalent
to 10 mg of sitagliptin phosphate was transferred into a 10 ml volumetric flask and dissolved
in 7 ml of diluent. The solution was sonicated for 15 min and shaken for 30 min. Then diluted
to volume with diluent and mixed. Pipette out 1mL of the above stock solution into a 10mL
volumetric flask and diluted up to the mark with diluent. Mix well and filter through 0.45µ
membrane filter. The filtrate was injected for the further analysis.
Procedure
Separately inject the standard preparation and the sample preparation in to the liquid
chromatography and record the area for major peaks. The % assay results were tabulated in
Table 11.
Calculation
The % assay of the sample was determined by using the following formula
claim Label X weight Sample X dilution Standard X area Standard 100 X weight Average X standard working of Purity X dilution Sample X weight Standard X area Sample VALIDATION PARAMETERS
1. System suitability
From the chromatogram obtained for the standard preparation, the column efficiency was
determined. The theoretical plates obtained should be not less than 2500 and the tailing factor
should be not more than 2.0 and the relative standard deviation of replicate injection should
be not more than 2.0%.
2. Accuracy
A study of Accuracy was conducted by recovery studies. Recovery studies were performed
by spiking the previously analyzed sample of Sitagliptin phosphate with the known amounts
of pure drug at different concentration levels. The spiked levels were 50%, 100% and150%.
The % recovery was calculated three times at each level and the average % recovery was
www.wjpr.net Vol 6, Issue 16, 2017. 1098 3. Precision
a). System precision
Standard preparation
Accurately weighed 10 mg of sitagliptin phosphate working standard was taken in 10 ml
volumetric flask, dissolved and diluted to volume with mobile phase and mixed.
Procedure
Separately inject the standard solution for 5 times in to the liquid chromatography and
confirm the system suitability and then record the response of area in record of analysis for
system precision.
b). Intraday precision
Sample Preparation
Weigh and grind 20 tablets to fine powder. Transfer a quantity of powder equivalent to 10 mg
of Sitagliptin phosphate into a 10 ml volumetric flask; add 7 ml of mobile phase. Sonicate for
15 minutes and shake for 30 minutes. Dilute to volume with mobile phase and mix. 10ml of
this solution is taken into 10 ml of volumetric flask and the volume is made up to the mark to
get a final concentration of 120 ppm of Sitagliptin phosphate. Filter through 0.45 µ
membrane filter by using the filtrate as the sample preparation.
Procedure
Separately inject the standard solution for 5 times in to the liquid chromatography and
confirm the system suitability and then record the response of area. Prepare the sample
preparation for 6 times and inject all the solutions in duplicate and run the sample injections
for 30 minutes. Record all the areas in record of analysis for repeatability.
c). Interday precision
Evaluates the reliability of the method in different environments. The objective is to ensure
that the method provides the same results when same sample are analyzed on different days
on different instruments and by different analysts.
4. Linearity
A Series of solutions are prepared using Sitagliptin phosphate working standard at
www.wjpr.net Vol 6, Issue 16, 2017. 1099
and 210 ppm). Peak area response of solutions at Level 1 and Level 6 was measured six
times.
5. Limit of detection and Limit of quantitation
Limit of detection and Limit of quantitation represents the concentration of analyte that
would yield Signal to Noise ratio of 3:1 and 10:1. The limit of quantitation is approximately
twice than that of limit of detection.
6. Robustness
For demonstrating the robustness of the developed method, experimental conditions were
purposely altered and evaluated. The method must be robust enough to withstand such slight
changes and allow routine analysis of the sample. Following optimized conditions were
slightly varied.
a). Effect of variation in mobile phase composition
A study was conducted to determine the effect of variation in Organic phase composition in
mobile phase. Standard solution prepared as per the test method was injected into the HPLC
system.
b). Effect of variation of flow rate
A study was conducted to determine the effect of variation in flow rate. Standard solution
prepared as per the test method was injected into the HPLC system and the chromatograms
were recorded using flow rates, 0.8ml/min and 1.2ml/min.
c). Effect of variation of pH
A study was conducted to determine the effect of variation in pH. Standard solution prepared
as per the test method, was injected into the HPLC system at 4.0 and 4.2 pH.
RESULTS AND DISCUSSION
Quantitative Estimation of Tablet Formulation by Proposed Method
Percentage assay of Sitagliptin phosphate tablets were carried out by proposed method.
www.wjpr.net Vol 6, Issue 16, 2017. 1100 Table 2: Quantitative estimation of tablet formulation.
S.No Brand name
Standard area
Sample area
Labelled claim (mg)
Amount found(mg)
% Purity
[image:8.595.123.469.370.586.2]1. Januvia 539793 533644 100 98.50 98.50
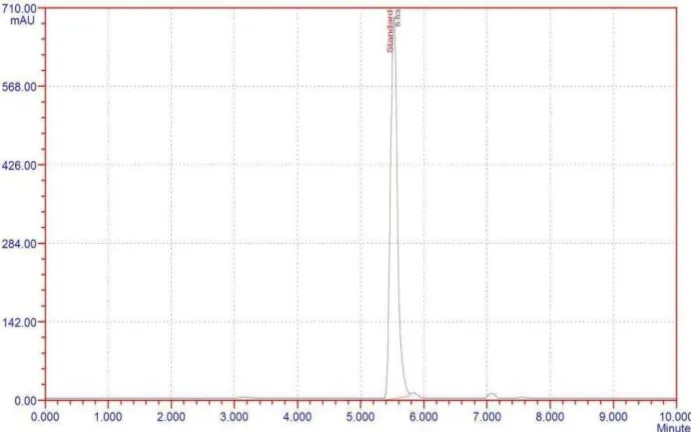
Fig 1: Chromatogram for Sitagliptin phosphate blank.
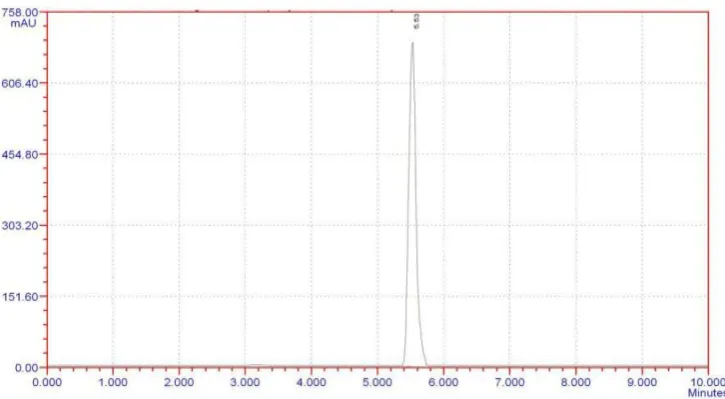
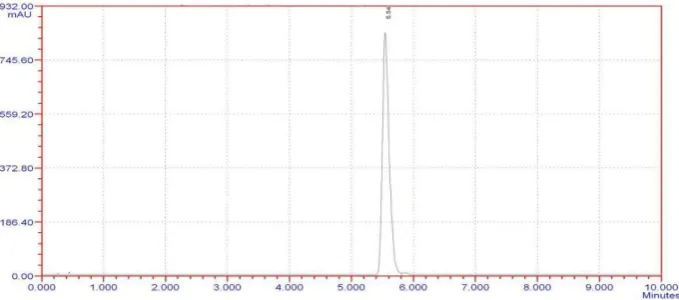
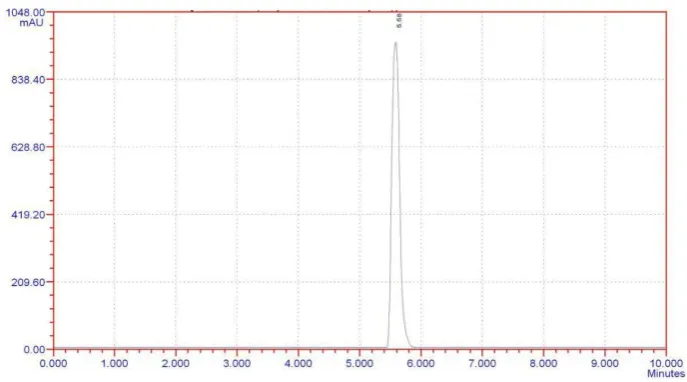
www.wjpr.net Vol 6, Issue 16, 2017. 1101 Fig 3: Chromatogram for Sitagliptin phosphate tablet formulation.
Validation Results
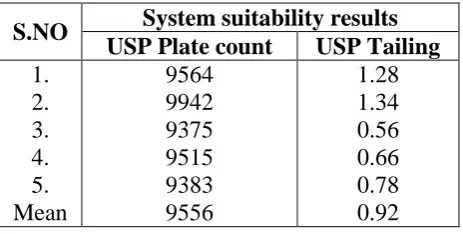
1.System suitability
The % RSD values is NMT than 2.0% for the retention times of principal peak from 5
replicate injections of Standard solution indicate that the system was acceptable. The number
of theoretical plates (N) for the Sitagliptin phosphate peak is NLT 2500.The Tailing factor (T)
for the Sitagliptin phosphate is NMT 2.0.
Table 3: Data for system suitability.
S.NO System suitability results
USP Plate count USP Tailing
1. 2. 3. 4. 5. Mean
9564 9942 9375 9515 9383 9556
1.28 1.34 0.56 0.66 0.78 0.92
2. Accuracy (Recovery studies)
The mean % recovery values of not less than 98.0% and not more than 102.0% of Sitagliptin
phosphate at each level indicates the good accuracy of the method. The results were tabulated
[image:9.595.183.415.432.549.2]www.wjpr.net Vol 6, Issue 16, 2017. 1102 Table 4: Data for accuracy recovery studies
Level Target
in ppm
Amount of Sitagliptin spiked (ppm)
Total in ppm
Amount of Sitagliptin recovered (ppm)
% Recovery
50 %
60 30 90 88.71 98.57
60 30 90 89.84 99.82
60 30 90 88.94 98.82
100%
60 60 120 119.57 99.64
60 60 120 120.62 100.51
60 60 120 121.02 100.85
150%
60 90 150 152.81 101.87
60 90 150 151.33 100.89
[image:10.595.61.540.95.480.2]60 90 150 152.37 101.58
[image:10.595.114.477.492.691.2]Fig 4: Chromatogram for accuracy (50% level).
www.wjpr.net Vol 6, Issue 16, 2017. 1103 Fig 6: Chromatogram for accuracy (150% level).
3. Precision
a). System precision
Standard preparation was injected 5times. The responses for Sitagliptin phosphate peak area
were shown in Table 5.
Table 5: Data for system precision.
S.NO Retention time Peak area
1. 2. 3. 4. 5. Mean SD % RSD 5.53 5.54 5.56 5.55 5.57 5.54 0.02 0.39 539793 540808 537399 531240 530875 536023 4700 0.88
b). Intraday precision
The % assay values of Sitagliptin phosphate calculated from the responses of intraday
precision was NLT 95% and NMT 102%. The results of the analysis were shown in Table 6.
Table 6: Data for intraday precision.
Sample preparation
Observed values
Area % Assay
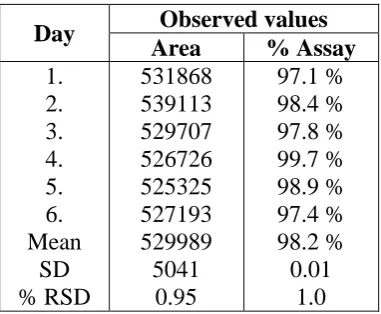
www.wjpr.net Vol 6, Issue 16, 2017. 1104 c). Interday precision
The % assay values of Sitagliptin phosphate calculated from the responses of intraday
[image:12.595.203.394.168.325.2]precision was NLT 95% and NMT 105%. The results of the analysis are shown in Table 7.
Table 7: Data for interday precision.
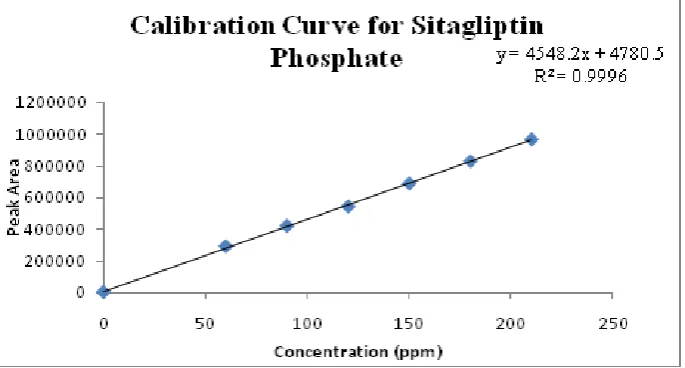
4. Linearity
The linearity of response for Sitagliptin phosphate was determined at different concentrations
(60-210ppm) as shown in Table 8. TheCorrelation Coefficient value 0.9996 indicates that the
method was linear over a concentration range of 60- 210ppm for Sitagliptin phosphate as
shown in Table 8.
Table 8: Data for linear graph.
Table 9: Results for regression analysis.
S.NO Drug name Linear dynamic
range (ppm)
Correlation
coefficient Slope Intercept
1. Sitagliptin
phosphate 60-210 0.9996 4548.2 4780.5
Day Observed values
Area % Assay
1. 2. 3. 4. 5. 6. Mean SD % RSD 531868 539113 529707 526726 525325 527193 529989 5041 0.95 97.1 % 98.4 % 97.8 % 99.7 % 98.9 % 97.4 % 98.2 % 0.01 1.0
S.NO Concentration (ppm) Peak area
www.wjpr.net Vol 6, Issue 16, 2017. 1105 Fig 7: Linearity curve for Sitagliptin phosphate.
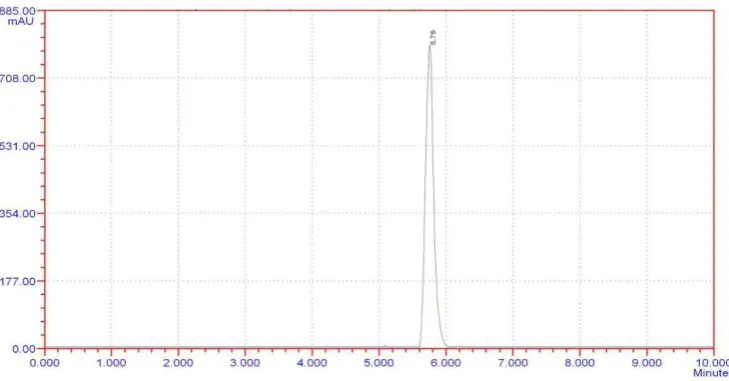
Fig 8: Chromatogram for linearity 60 ppm.
[image:13.595.124.471.540.727.2]www.wjpr.net Vol 6, Issue 16, 2017. 1106 Fig 10: Chromatogram for linearity 120ppm.
Fig 11: Chromatogram for linearity 150 ppm.
[image:14.595.114.479.533.723.2]www.wjpr.net Vol 6, Issue 16, 2017. 1107 Fig 13: Chromatogram for linearity 210 ppm.
5. Limit of detection and Limit of quantitation
The limit of detection (LOD) and limit of quantitation (LOQ) represent the concentration of
Sitagliptin phosphate stock solution in order to obtain signal-to-noise ratio of 3:1 for LOD
[image:15.595.124.463.403.663.2]and 10:1 for LOQ were determined.
Table 10: LOD and LOQ values for Sitagliptin phosphate.
Sample LOD LOQ
Sitagliptin phosphate 0.05µg/ml 0.16µg/ml
www.wjpr.net Vol 6, Issue 16, 2017. 1108 Fig 15: Chromatogram for LOQ.
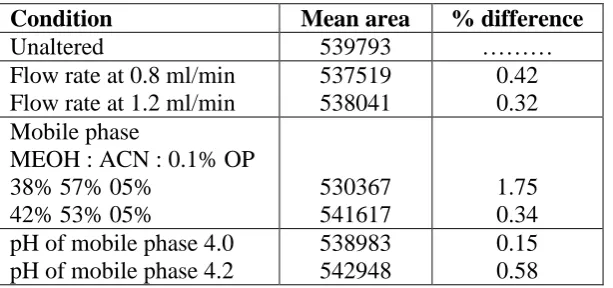
6. Robustness
For demonstrating the robustness of the developed method, experimental conditions were
purposely altered and evaluated. The method must be robust enough to with stand such a
slight changes and allow routine analysis of the sample.
Table 11: Data for robustness.
Condition Mean area % difference
Unaltered 539793 ………
Flow rate at 0.8 ml/min Flow rate at 1.2 ml/min
537519 538041
0.42 0.32 Mobile phase
MEOH : ACN : 0.1% OP 38% 57% 05%
42% 53% 05%
530367 541617
1.75 0.34 pH of mobile phase 4.0
pH of mobile phase 4.2
538983 542948
0.15 0.58
CONCLUSION
From the reported literature, there were few methods established for the determination of
Sitagliptin Phosphate in individual and in combination with other drug.
It was concluded that there was no method reported for the above selected dosage form,
which promote to carry out the present work. The scope and objective of the present work is
to develop and validate a new simple RP-HPLC method for quantitative estimation of
[image:16.595.147.454.420.564.2]www.wjpr.net Vol 6, Issue 16, 2017. 1109
In RP-HPLC method development, the mobile phase selected after optimization was mixed
with methanol, acetonitrile and 0.1% ortho phosphoric acid in the ratio of 40:55:05 to pH 4.1
adjusted with triethyl amine was found to be ideal. The chromatographic condition was set at
a flow rate of 1.0ml/min with the UV detection at 265 nm.
Sitagliptin Phosphate showed linearity in the range of 60-210ppm respectively. The
correlation coefficient was found to be 0.9996 respectively for Sitagliptin Phosphate which
indicates excellent correlation between response factor Vs concentration of standard
solutions.
Precision of the developed method was studied. The %RSD values for precision was found to
be within the acceptable limit, which revealed that the developed method was precise. The
developed method was found to be robust. The %RSD value for percentage recovery of
Sitagliptin Phosphate was found to be within the acceptance criteria.
Hence, the chromatographic method developed for Sitagliptin Phosphate was said to be rapid,
simple, specific, sensitive, precise, accurate and reliable that can be effectively applied for
routine analysis.
REFERENCE
1. A. K. Gupta, Dinesh Sahu, Y. P. Agrawal, Avnish Jain. 2011. Simultaneous estimation of
Metformin and Sitagliptin in tablet dosage form. Asian Journal of Biochemical and
Pharmaceutical Research, 2(1): 352-358.
2. Amruta B. Loni, Minal R. Ghante, S. D. Sawant. 2012. Simultaneous UV
spectrophotometric method for estimation of Sitagliptin phosphate and Metformin
hydrochloride in bulk and tablet dosage form. Der Pharma Chemica, 4(3): 854-859.
3. Ankur Kothari and Sheetal Sharma. 2012. Development and validation of
spectrophotometric method for simultaneous estimation of sitagliptin phosphate and
simvastatin in tablet dosage form. International Journal of Pharmacy, 2(3): 609-612.
4. Anonymous. November 2005, ICH Harmonized Tripartite Guidelines, Text on Validation
of Analytical procedures: Text and Methodology. Q2(R1).Geneva, 1-8.
5. Anonymus. www.ich.org.
6. Anonymus. United State Pharmacopoeia 26. 2003. National Formulary. The United states
www.wjpr.net Vol 6, Issue 16, 2017. 1110
7. Beckett AH, Stenlake JB. 2007. Practical Pharmaceutical Chemistry. Part-II. 4th edn., CBS Publishers and Distributors: New Delhi, 85, 86, 92.
8. Chellu S. N. Malleswararao, Mulukutla V. Suryanarayana. 2012. Simultaneous
determination of Sitagliptin phosphate monohydrate and Metformin hydrochloride in
tablets by a validated UPLC method. Scientia Pharmaceutica, 80: 139–152.
9. Douglas A Skoog, Donald M West, James F Holler, Stanley R Crouch. 2007.
Fundamentals of Analytical Chemistry. 8th edn., Thomson Asia Pvt. Ltd: Singapore, 4, 921, 975.
10.D. Phaneemdra, V. Venkatesh, Ramarao N. 2012.Simultaneous estimation of Simvastatin
and Sitagliptin by using different analytical methods. International Journal of Advances in
Pharmaceutical Analysis,2(1): 19-23.
11.Gurdeep R Chatual, Shan K Anand. 2006. Instrumental Methods of Chemical Analysis.
5th edn., Himalya publishing House; Mumbai; 1.2, 2.108, 2.168, 2.147.
12.Hobart H Willard, Lynne L Merritt, Jr., John A Dean, Frank A Settle, Jr. 1986.
Instrumental Methods of Analysis. 7th edn., CBS Publishers and Distributors: New Delhi, 1, 592, 622-628.
13.Jeffery GH, Bassett J, Mondham J, Denney RC. 1989. Vogel’s Text Book of Quantitative
Chemical Analysis. 5th edn. Longmen Singapore Publishers Pvt Ltd: Singapore, 5: 216-217.
14.Lloyd R Slyder, Joseph J Kirkland, Joseph L Glajch. 1997. Practical HPLC Method
Development. 2nd edn. John Wiley and Sons, Inc, USA, 1-14.
15.Parag Pathade, Md Imran, Vinod Bairagi. 2011. Development and validation of stability
indicating UV Spectrophotometric method for the estimation of Sitagliptin phosphate in
bulk and tablet dosage form. Journal of Pharmacy Research, 4(3): 871-873.
16.Sandy Lindsay. 1998. HPLC by open Learning. John Wiley and Sons: New York; 30-45.
17.Sethi PD. 1997. Quantitative Analysis of Drugs in Pharmaceutical Formulations. 3rd edn.,
CBS Publishers and Distributors: New Delhi, 6-9.
18.Sharma. B.K., 2007, High Performance Liquid Chromatography, Instrumental Methods
of Chemical Analysis, GOEL publishing house, Meerut, 6th edition, C-290-291.
19.Sheetal Sharma, Ankur Kothari, M.S. Harsoliya. 2012. Simultaneous UV
Spectrophotometric method for estimation of Sitagliptin Phosphate and Simvastatin in
Tablet dosage Form. Journal of Pharmacy Research, 5(1): 444-446.
20.www.frorumsci.coil/HPLC/HPLC_overview_handouts 2002.pdf.