Abnormal functional connectivity during visuospatial
processing is associated with disrupted organisation
of white matter in autism
Jane McGrath1*, Katherine Johnson1,2, Erik O’Hanlon3, Hugh Garavan1,4, Alexander Leemans5and Louise Gallagher1
1
Department of Psychiatry, Trinity College Dublin, Ireland
2
Department of Psychology, University of Melbourne, Melbourne, Victoria, Australia
3Department of Psychiatry, Royal College of Surgeons in Ireland, Dublin, Ireland 4Department of Psychology, University of Vermont, Burlington, VT, USA
5Image Sciences Institute, University Medical Centre Utrecht, Utrecht, Netherlands
Edited by:
Rajesh K. Kana, University of Alabama at Birmingham, USA
Reviewed by:
Brittany Travers, University of Wisconsin-Madison, USA Franco Pestilli, Stanford University, USA
*Correspondence:
Jane McGrath, Department of Psychiatry, Trinity Centre for Health Sciences, St. James’s Hospital, Dublin 8, Ireland
e-mail: [email protected]
Disruption of structural and functional neural connectivity has been widely reported in Autism Spectrum Disorder (ASD) but there is a striking lack of research attempting to integrate analysis of functional and structural connectivity in the same study population, an approach that may provide key insights into the specific neurobiological underpinnings of altered functional connectivity in autism. The aims of this study were (1) to determine whether functional connectivity abnormalities were associated with structural abnormalities of white matter (WM) in ASD and (2) to examine the relationships between aberrant neural connectivity and behavior in ASD. Twenty-two individuals with ASD and 22 age, IQ-matched controls completed a high-angular-resolution diffusion MRI scan. Structural connectivity was analysed using constrained spherical deconvolution (CSD) based tractography. Regions for tractography were generated from the results of a previous study, in which 10 pairs of brain regions showed abnormal functional connectivity during visuospatial processing in ASD. WM tracts directly connected 5 of the 10 region pairs that showed abnormal functional connectivity; linking a region in the left occipital lobe (left BA19) and five paired regions: left caudate head, left caudate body, left uncus, left thalamus, and left cuneus. Measures of WM microstructural organization were extracted from these tracts. Fractional anisotropy (FA) reductions in the ASD group relative to controls were significant for WM connecting left BA19 to left caudate head and left BA19 to left thalamus. Using a multimodal imaging approach, this study has revealed aberrant WM microstructure in tracts that directly connect brain regions that are abnormally functionally connected in ASD. These results provide novel evidence to suggest that structural brain pathology may contribute (1) to abnormal functional connectivity and (2) to atypical visuospatial processing in ASD.
Keywords: neuroimaging, autism spectrum disorders, functional connectivity, diffusion tractography, constrained spherical deconvolution, visuospatial processing, structural connectivity, mental rotation
INTRODUCTION
There is extensive evidence to suggest that autism is a disor-der characterized by disrupted functional and structural neural connectivity. Abnormal inter- and intra-regional functional con-nectivity has been described whilst participants have performed various neuropsychological paradigms and whilst in the resting state. In parallel with functional connectivity research, a number of diffusion imaging studies in autism have demonstrated aber-rant “structural connectivity”—a term referring to the integrity of white matter (WM) micro- and macrostructure. Abnormal func-tional connectivity between brain regions in autism may arise from disrupted organization of WM, but its pathophysiology is unknown. Despite the numerous studies that have consistently reported abnormal functional connectivity in autism, there is a surprising lack of research attempting to integrate analysis of
functional and structural connectivity in the same study popula-tion, an approach that may provide key insights into the specific neurobiological underpinnings of altered functional connectivity in autism.
BEHAVIORAL EFFECTS OF DISRUPTED NEURAL CONNECTIVITY IN ASD
cingulate cortex (Thakkar et al., 2008) and with the number of tracts in the forceps minor (Thomas et al., 2011). More severe social-communicative deficits have been correlated with reduced FA in WM of fronto-striatal regions, temporal regions, the pos-terior part of the corpus callosum (Cheung et al., 2009), left and right uncinate fasciculus, left superior longitudinal fasciculus, left and right fornix (Poustka et al., 2011), the dorsolateral prefrontal cortex (Noriuchi et al., 2010), right anterior thalamic radiation and right uncinate fasciculus (Cheon et al., 2011) and left cere-bellar peduncle (Catani et al., 2008) and with increased fiber length and density in the corpus callosum (Kumar et al., 2010). Alexander et al. found a relationship between Autism Spectrum Disorder (ASD) symptom severity (Social Responsiveness Scale) and WM measures (although it was only seen across both groups combined and not just within the ASD group;Alexander et al., 2007). Some studies however have found no correlation between ASD symptomatology and WM measures (Sundaram et al., 2008; Barnea-Goraly et al., 2010; Shukla et al., 2010; Hong et al., 2011; Jou et al., 2011). Reduced microstructural organization of WM in autism has also been correlated with lower performance IQ scores (Alexander et al., 2007) and with increased response times in a pictorial problem-solving task (Sahyoun et al., 2010).
A number of studies have also investigated the behavioral effects of functional connectivity abnormalities in ASD and have reported correlations between altered functional connectivity and core symptoms of autism. Reduced fronto-posterior functional connectivity was found to correlate with increased severity of autism (Just et al., 2007). Poorer social functioning in indi-viduals with ASD has been associated with reduced functional connectivity between the superior frontal gyrus and posterior cin-gulate (Monk et al., 2009; Weng et al., 2010) and communication deficits have been associated with increased functional connec-tivity between regions of the default mode network during the resting state (Weng et al., 2010). Increased severity of repetitive behaviors in autism has been associated with reduced functional connectivity between frontal structures and the posterior cin-gulate (Weng et al., 2010), and also with increased functional connectivity between the posterior cingulate and parahippocam-pal gyrus (Monk et al., 2009) and between the anterior cingulate and frontal eye fields (Agam et al., 2010). In summary, results from both anatomical and functional studies suggest that dis-rupted neural connectivity in autism may impact negatively on core features of the condition.
EVIDENCE FOR A RELATIONSHIP BETWEEN DISRUPTED BRAIN WHITE MATTER STRUCTURE AND FUNCTIONAL CONNECTIVITY
ABNORMALITIES IN ASD
The direct impact of WM abnormalities on functional connec-tivity in ASD has been less well-studied. This is surprising given the extensive literature that has documented abnormal functional connectivity in the disorder, and the lack of knowledge about the pathophysiology of this abnormal functional connectivity. A small number of studies have used a measure of the size of the corpus callosum as an index of “anatomical connectivity” and demonstrated a relationship between reduced size of the corpus callosum and reduced functional connectivity during a number of neuropsychological paradigms, including the Tower
of London task (Just et al., 2007), a sentence comprehension and visual imagery task (Kana et al., 2006), the Embedded Figures task (Damarla et al., 2010), a narrative comprehension task (Mason et al., 2008), and whilst participants were at rest (Cherkassky et al., 2006). No previous studies in autism have attempted to iden-tify whether there are abnormal WM connections that directly link brain regions showing abnormal functional connectivity, nor have any studies examined the relationship between alterations in structural connectivity and functional connectivity.
EVIDENCE FOR A RELATIONSHIP BETWEEN BRAIN WHITE MATTER STRUCTURE AND FUNCTIONAL CONNECTIVITY IN NEUROTYPICAL POPULATIONS
In neurotypical populations, a number of multimodal (func-tional MRI and diffusion MRI) imaging studies have integrated structural and functional connectivity analyses in the same study population and have shown that there is evidence of substantial correspondence between structural and functional connectivity.
Studies that have combined analyses of structural and func-tional connectivity during the resting state have revealed a struc-tural basis for resting state functional connectivity. Regions of the default mode network are linked by WM tracts (Greicius et al., 2009), the level of WM organization in the cingulum is correlated with resting state functional connectivity between midline brain regions (van den Heuvel et al., 2008) and maps of resting state functional connectivity in adult macaque monkeys were shown to be markedly similar to maps of structural connectivity obtained from tracer studies (Vincent et al., 2007; Margulies et al., 2009).
These combined structural/resting state studies have also provided evidence for a relationship (albeit complex) between anatomical and functional connectivity. Studies that have gener-ated whole brain maps of functional and anatomical connectivity on the same cohort of participants have demonstrated that struc-tural connection patterns and functional interactions between regions of the cortex are significantly correlated (Hagmann et al., 2008; Skudlarski et al., 2008; Honey et al., 2009; Hermundstad et al., 2013). This relationship between structural and functional connectivity is not a simple one however; strong functional con-nections often exist between regions with no direct anatomical connection (Honey et al., 2009). Such functional connections may arise from indirect WM connections, or from the two regions receiving common input from a third region (Behrens and Sporns, 2012).
patients with multiple sclerosis, disease-related reduction of func-tional connectivity between left and right primary sensorimotor cortices was associated with increased radial diffusivity in the WM tracts connecting these regions, again indicating a relationship between reduced anatomical connectivity and reduced functional connectivity (Lowe et al., 2008).
To date, studies investigating a link between structural and functional connectivity in neurotypical populations have indi-cated that functional connectivity has a structural basis, and that there is evidence of substantial correspondence between the strength of structural and functional connectivity.
FUNCTIONAL CONNECTIVITY DURING VISUOSPATIAL PROCESSING IN ASD
Atypical visuospatial processing is common in autism spectrum disorders. In brief, enhanced visuospatial processing in ASD has been described in behavioral studies during a variety of cog-nitive tasks (see McGrath et al., 2012, for review). A number of neuroimaging studies have revealed that brain activity and connectivity differs markedly between ASD and control groups during visuospatial processing (Lee et al., 2007; Manjaly et al., 2007; Damarla et al., 2010). Recent work from our group used functional connectivity MRI (fcMRI) to investigate the neural correlates of visuospatial processing during a mental rotation task, whereby two rotated stimuli were judged to be the same (“Same” trials) or mirror-imaged (“Mirror” trials;McGrath et al., 2012). Results of this study indicated that there was a rela-tive advantage of mental rotation in the ASD group. The ASD group performed Same and Mirror trials at similar speeds, but the control group slowed significantly on Mirror trials relative to Same trials. Functional connectivity analysis revealed marked abnormalities in the ASD group that were characterized by long-range fronto-posterior underconnectivity and short-long-range intra-occipital overconnectivity. This study concluded that atypical visuospatial processing in ASD appears to be associated with both quantitative and qualitative differences in functional connectivity, which may result in a combination of enhanced low-level visual perceptual processing and a reduction of higher-level cortical control. A further study from our group investigated the struc-tural properties of major WM tracts that are thought to play an important role in visuospatial processing (McGrath et al., 2013) This research demonstrated that there were significant alterations in the microstructural organization of WM in the right inferior fronto-occipital fasciculus (IFOF) in ASD. This alteration was associated with poorer visuospatial processing performance in the ASD group. This study provided an insight into structural brain abnormalities that may influence atypical visuospatial processing in autism, however it did not provide any information on how WM abnormalities may impact on functional connectivity in the disorder.
AIMS AND HYPOTHESES
In ASD, there is strong evidence for disrupted functional and anatomical connectivity but no previous studies have attempted to integrate these types of connectivity analyses. The integration of functional and structural connectivity analysis in the same study population allows for the investigation of inter-participant
variability in structural connectivity and provides an opportu-nity to relate this variability to differences in individual functional connectivity and behavior (Hagmann et al., 2008). As discussed above, such multimodal connectivity studies in neurotypical pop-ulations have revealed strong relationships between WM organi-zation, functional connectivity and behavior. Thus, the aims of this study were two-fold; first to investigate the structural integrity of WM that directly connected brain regions showing abnor-mal functional connectivity in ASD, and second to investigate relationships between brain WM structure, functional connec-tivity and behavior. To do this, brain regions from a previously reported functional connectivity analysis (McGrath et al., 2012) were used as regions of interest (ROIs) for diffusion tractogra-phy in order to isolate WM tracts that directly linked the two regions. Microstructural organization of these WM tracts was assessed and correlated with both functional connectivity and behavioral measures to provide a comprehensive examination of the relationships between brain structural connectivity, func-tional connectivity and behavior in ASD. It was hypothesized that there would be WM tracts linking some, but not all, pairs of brain regions that showed abnormal functional connectiv-ity. This hypothesis was based on the knowledge that functional connectivity between regions does not always require a direct WM connection, but can be mediated by indirect connections or input from unrelated regions (Behrens and Sporns, 2012). It was also hypothesized that WM structure would be abnormal in tracts directly connecting the functionally defined ROIs and that there would be correlation between microstructural organi-zation of WM, functional connectivity and behavior. It is difficult to make specific predictions about the correlations in this study because there is such a limited literature that has investigated relationships between structural connectivity, functional connec-tivity and behavior. Nevertheless, it was theorized that if ASD and control groups do use qualitatively and quantitatively neural net-works for successful visuospatial processing as hypothesized in McGrath et al. (2012), there should be differential relationships between WM organization, functional connectivity and response time data in the ASD and control groups.
MATERIALS AND METHODS PARTICIPANTS
Table 1 | Demographics of study participants *Full scale IQ was estimated based on four sub-scales of the WISC/WAIS [Wechsler Intelligence Scale for Children (WISC-III or IV UK), (Wechsler, 2004) and Wechsler Adult Intelligence Scale (WAIS-III), (Wechsler, 1997)].
Control ASD p-value
Number 22 22
Gender Male (22) Male (22)
Age mean (SD, Range) 17.51 (2.76, 13.6–21.3) 17.56 (2.91, 13.0–21.8) 0.76
Full scale IQ*Mean (SD, Range) 110.50 (16.97, 84–147) 105.95 (13.46, 84–127) 0.25 Verbal IQ∧Mean (SD, Range) 117.60 (12.69, 93–134) 105.60 (18.48, 79–134) 0.11 Performance IQ∼Mean (SD, Range) 120.80 (26.39, 91–155) 124.35 (17.46, 99–155) 0.73
Handedness Right (22) Right (22)
Medication None None
Ethnicity Irish (22) Irish (22)
∧Verbal IQ was estimated using the Information and Vocabulary subtests of the WISC III for n=10 participants with ASD and n=10 matched controls, using
Sattler’s method (Sattler, 1992). It was not possible to produce a Verbal IQ for n=12 participants with ASD and n=12 controls, as the WISC IV was used to estimate full scale IQ for these participants.∼Performance IQ was estimated using the Picture Completion and Block Design subtests of the WISC III for n=10 participants with ASD and n=10 for controls, using Sattler’s method (Sattler, 1992). It was not possible to produce a Performance IQ for n=12 participants with ASD and n=12 controls, as the WISC-IV was used to estimate full scale IQ for these participants. Subtests of the WISC-IV that were used to calculate full scale IQ included Similarities, Block Design, Digit Span, and Coding. Subtests of the WAIS that were used to calculate full scale IQ included Similarities, Block Design, Digit Span and Matrix Reasoning.
(WISC-III and IV UK)], (Wechsler, 2004) and Wechsler Adult Intelligence Scale (WAIS-III), (Wechsler, 1997)]. Verbal IQ and performance IQ were estimated from the verbal and performance subtests of the WISC-III and WAIS-III data. Exclusion criteria included known causes for autism, e.g., tuberous sclerosis/fragile-X syndrome, current/past neurological or psychiatric conditions, serious head injuries, MR contraindications, below-average intel-ligence (full-scale IQ<80) and current use of psychoactive medi-cation. Additional exclusion criteria for controls included history of developmental delay or first-degree relatives with ASD. The study was approved by the Irish Health Services Executive Linn Dara-Beechpark Research Ethics committee and by the School of Psychology Ethics Committee, Trinity College Dublin. Written informed consent was obtained from parents (where appropriate) and participants prior to scanning. Demographics of participants are detailed inTable 1.
OVERVIEW OF METHODS
To investigate the links between brain structural connectivity and functional connectivity, diffusion MRI data, and previously analysed functional connectivity data (seeMcGrath et al., 2012) from the same participants were combined. Three questions were posed:
1. Were there WM tracts directly linking pairs of brain regions that showed abnormal functional connectivity in the ASD group?
2. If there were WM tracts that directly linked pairs of brain regions showing abnormal functional connectivity, were there structural abnormalities of this WM in the ASD group? 3. Was there evidence for relationships between structural
con-nectivity, functional connectivity and behavior?
To answer question 1, ROIs were defined from the results of a previously reported functional connectivity analysis, in which
significant abnormalities of functional connectivity were reported in the ASD group (McGrath et al., 2012). These functionally defined ROIs were then used in diffusion tractography analy-sis to determine whether WM tracts linked brain regions that were abnormally functionally connected in the ASD group. In the methods sections below, there is a brief overview of the previ-ously reported functional connectivity analysis (section Review of Functional Connectivity Analysis), a description of the dif-fusion MRI acquisition and pre-processing (section Difdif-fusion MRI Acquisition/Preprocessing), a description of how function-ally defined ROIs for tractography were selected (section Selection of Functionally Defined Seed Regions for Diffusion Tractography) and prepared for diffusion tractography (section Preparation of Functionally Defined ROIs for Tractography), and a descrip-tion of the diffusion tractography protocol (secdescrip-tion Diffusion Tractography Protocol).
To answer question 2, diffusion measures were extracted from the isolated tracts and compared between groups. Methods for this analysis are outlined in sections Dependent Measures and Between-Group Differences in White Matter Structure.
To answer question 3, a series of exploratory correlation analyses were performed to investigate the relationships between structural connectivity, functional connectivity and behavior (visuospatial processing speed). Methods for the correlation anal-yses are outlined in sections Correlation Analanal-yses and Measures of White Matter Structure, Functional Connectivity and Behavior Included in the Correlation Analyses.
REVIEW OF FUNCTIONAL CONNECTIVITY ANALYSIS
McGrath et al. (2012) for full details of the mental rotation task, functional MRI acquisition, and PPI functional connec-tivity analysis. A brief summary of the functional connecconnec-tivity analysis performed inMcGrath et al. (2012)follows. PPI anal-yses were performed separately for each ROI for the Same and Mirror trials for ASD and control groups. For each PPI analysis, a multiple regression analysis was carried out for each sub-ject. This analysis comprised seven task-related regressors (one for each experimental condition in the mental rotation task) and the motion-corrected time-series regressors to accommo-date nuisance variance (for fMRI analysis). In addition, there were two other regressors. The first regressor, the physiological variable, was the detrended subject-specific time course of activ-ity in the ROI (averaged across all voxels in the 8 mm sphere). The second regressor—the PPI term—was created by calculat-ing the product of the detrended activation time-course from the seed region and the task regressor. The parameter estimate for the interaction term was converted to a Z-score through Fisher transformation for each subject. To investigate between-group differences in functional connectivity, Z-scores from each PPI analysis were entered into a Two-Way repeated-measures ANOVA [Group (ASD/Control)× Trial-type (Same/Mirror)]. The dependent variables that result from this PPI analysis are negative and positive connectivity. Negative connectivity indi-cates that the influence the task has on activity in the seed region produces a correlated opposite effect on the correlated region, which is consistent with (but not proof of) one region suppressing the other. In contrast positive connectivity between a pair of brain regions indicates that as activity in one brain region increases, there is a correlated increase in activity in the other region.
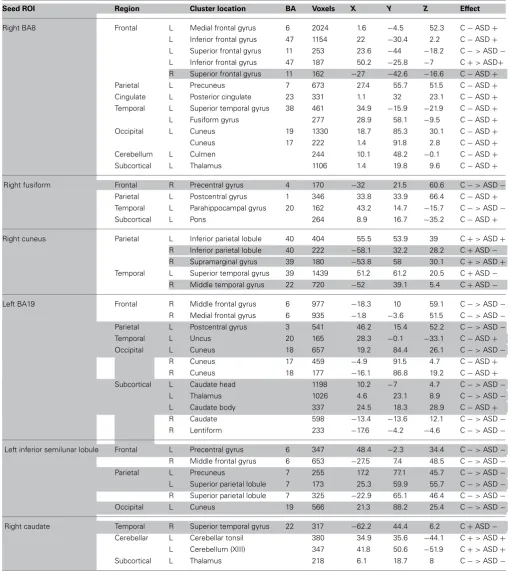
This previous study identified between-group differences in functional connectivity between all seed ROIs and numerous brain regions. These findings are summarized inTable 2, which is a modified version of Table 3 fromMcGrath et al. (2012).
DIFFUSION MRI ACQUISITION/PREPROCESSING
Whole-brain high angular resolution diffusion imaging (HARDI) data were acquired on a Philips Intera Achieva 3.0 Tesla MR system (Best, Netherlands) equipped with an eight-channel head coil. A parallel Sensitivity Encoding (SENSE) approach (Pruessmann et al., 1999) with a reduction factor of 2 was utilized for all diffusion weighted image (DWI) acquisitions. Single shot spin echo-planar imaging was used to acquire diffusion weighted data using the following parameters (Jones and Leemans, 2011): echo time (TE) 79 ms, repetition time (TR) 20,122 ms, field of view 248×248 mm2, matrix 128×128, isotropic voxel resolu-tion 2×2×2 mm3, 65 slices with 2 mm thickness with no gap between slices. Diffusion gradients were applied in 61 isotropi-cally distributed orientations withb=1500 s/mm2and also four images withb=0 s/mm2were acquired. Total DWI scan time was 24.3 min.
Pre-processing and tractography analyses were performed with the diffusion MR toolbox ExploreDTI (http://www. ExploreDTI.com;Leemans et al., 2009). Each DW-MRI dataset was corrected for eddy current induced geometric distortions and subject motion by realigning all DWIs to theb=0 images
using Elastix (Klein et al., 2010), with an affine co-registration technique (with 12 degrees of freedom) and mutual information as the cost function (Pluim et al., 2003). In this procedure, the required reorientation of the B-matrix was performed (Leemans and Jones, 2009) and the tensor model was fitted to the data using the RESTORE approach (Chang et al., 2005), which uses a pro-cess of iteratively reweighted least-square regression for outlier identification and subsequent removal, thus minimizing estima-tion errors originating from gross signal artifacts (e.g., cardiac pulsation and subject motion).
SELECTION OF FUNCTIONALLY DEFINED SEED REGIONS FOR DIFFUSION TRACTOGRAPHY
Results of the functional connectivity analysis, discussed in detail in McGrath et al. (2012), revealed that there were significant group differences in functional connectivity between a large num-ber of brain regions (seeTable 2). In the current study, pairs of brain regions showing abnormal functional connectivity in ASD were used as ROIs for diffusion tractography analysis. To mini-mize the number of tractography analyses, only ipsilateral pairs of brain regions that showed abnormal functional connectivity were selected for analysis (i.e., the pair of brain regions had to be either in right or left hemisphere). The analysis was limited to ipsilateral pairs as it was thought less likely that there would be direct long-range WM connections between left and right hemi-spheres. For example, unless the two regions showing abnormal connectivity both were in the region of the corpus callosum, it was unlikely that there would be one direct WM tract linking them. In total there were 16 ipsilateral pairs of brain regions that showed abnormal functional connectivity in ASD in this previ-ous study. These are shown shaded inTable 2, which is a modified version of Table 3 inMcGrath et al. (2012), in which the results of between-group differences in functional connectivity are summarized.
PREPARATION OF FUNCTIONALLY DEFINED ROIs FOR TRACTOGRAPHY
To prepare the 16 pairs of ROIs for tractography, each clus-ter of inclus-terest was isolated from the fcMRI analysis and was projected back from standard MNI space into the space of the original subjects’ diffusion data (native space) using the FSL TBSS Deproject tool (http://www.fmrib.ox.ac.uk/fsl/tbss/index.html). These ROIs were subsequently used to select the fiber trajectories that were computed with the constrained spherical deconvolu-tion (CSD) based tractography approach (discussed in secdeconvolu-tion Diffusion Tractography Protocol below).
Table 2 | A modified version of Table 3 inMcGrath et al. (2012), in which the results of between-group differences in functional connectivity are summarized.
Seed ROI Region Cluster location BA Voxels X Y Z Effect
Right BA8 Frontal L Medial frontal gyrus 6 2024 1.6 −4.5 52.3 C−ASD+
L Inferior frontal gyrus 47 1154 22 −30.4 2.2 C−ASD+
L Superior frontal gyrus 11 253 23.6 −44 −18.2 C−>ASD− L Inferior frontal gyrus 47 187 50.2 −25.8 −7 C+>ASD+ R Superior frontal gyrus 11 162 −27 −42.6 −16.6 C−ASD+
Parietal L Precuneus 7 673 27.4 55.7 51.5 C−ASD+
Cingulate L Posterior cingulate 23 331 1.1 32 23.1 C−ASD+
Temporal L Superior temporal gyrus 38 461 34.9 −15.9 −21.9 C−ASD+
L Fusiform gyrus 277 28.9 58.1 −9.5 C−ASD+
Occipital L Cuneus 19 1330 18.7 85.3 30.1 C−ASD+
Cuneus 17 222 1.4 91.8 2.8 C−ASD+
Cerebellum L Culmen 244 10.1 48.2 −0.1 C−ASD+
Subcortical L Thalamus 1106 1.4 19.8 9.6 C−ASD+
Right fusiform Frontal R Precentral gyrus 4 170 −32 21.5 60.6 C−>ASD−
Parietal L Postcentral gyrus 1 346 33.8 33.9 66.4 C−ASD+
Temporal L Parahippocampal gyrus 20 162 43.2 14.7 −15.7 C−>ASD−
Subcortical L Pons 264 8.9 16.7 −35.2 C−ASD+
Right cuneus Parietal L Inferior parietal lobule 40 404 55.5 53.9 39 C+>ASD+ R Inferior parietal lobule 40 222 −58.1 32.2 28.2 C+ASD− R Supramarginal gyrus 39 180 −53.8 58 30.1 C+>ASD+
Temporal L Superior temporal gyrus 39 1439 51.2 61.2 20.5 C+ASD− R Middle temporal gyrus 22 720 −52 39.1 5.4 C+ASD−
Left BA19 Frontal R Middle frontal gyrus 6 977 −18.3 10 59.1 C−>ASD−
R Medial frontal gyrus 6 935 −1.8 −3.6 51.5 C−>ASD− Parietal L Postcentral gyrus 3 541 46.2 15.4 52.2 C−>ASD−
Temporal L Uncus 20 165 28.3 −0.1 −33.1 C−ASD+
Occipital L Cuneus 18 657 19.2 84.4 26.1 C−>ASD−
R Cuneus 17 459 −4.9 91.5 4.7 C−ASD+
R Cuneus 18 177 −16.1 86.8 19.2 C−ASD+
Subcortical L Caudate head 1198 10.2 −7 4.7 C−>ASD−
L Thalamus 1026 4.6 23.1 8.9 C−>ASD−
L Caudate body 337 24.5 18.3 28.9 C−ASD+
R Caudate 598 −13.4 −13.6 12.1 C−>ASD−
R Lentiform 233 −17.6 −4.2 −4.6 C−>ASD−
Left inferior semilunar lobule Frontal L Precentral gyrus 6 347 48.4 −2.3 34.4 C−>ASD− R Middle frontal gyrus 6 653 −27.5 7.4 48.5 C−>ASD−
Parietal L Precuneus 7 255 17.2 77.1 45.7 C−>ASD−
L Superior parietal lobule 7 173 25.3 59.9 55.7 C−>ASD− R Superior parietal lobule 7 325 −22.9 65.1 46.4 C−>ASD−
Occipital L Cuneus 19 566 21.3 88.2 25.4 C−>ASD−
Right caudate Temporal R Superior temporal gyrus 22 317 −62.2 44.4 6.2 C+ASD− Cerebellar L Cerebellar tonsil 380 34.9 35.6 −44.1 C+>ASD+
L Cerebellum (XIII) 347 41.8 50.6 −51.9 C+>ASD+
Subcortical L Thalamus 218 6.1 18.7 8 C−>ASD−
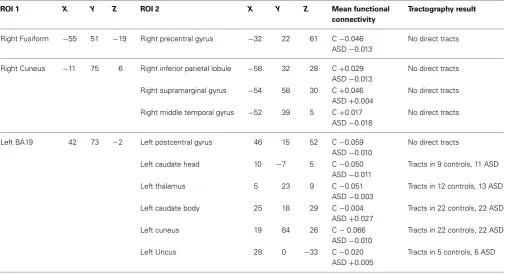
Table 3 | Summary of results from functional connectivity and tractography analysis.
ROI 1 X Y Z ROI 2 X Y Z Mean functional
connectivity
Tractography result
Right Fusiform −55 51 −19 Right precentral gyrus −32 22 61 C−0.046 ASD−0.013
No direct tracts
Right Cuneus −11 75 6 Right inferior parietal lobule −58 32 28 C+0.029 ASD−0.013
No direct tracts
Right supramarginal gyrus −54 58 30 C+0.046 ASD+0.004
No direct tracts
Right middle temporal gyrus −52 39 5 C+0.017 ASD−0.018
No direct tracts
Left BA19 42 73 −2 Left postcentral gyrus 46 15 52 C−0.059 ASD−0.010
No direct tracts
Left caudate head 10 −7 5 C−0.050 ASD−0.011
Tracts in 9 controls, 11 ASD
Left thalamus 5 23 9 C−0.051
ASD−0.003
Tracts in 12 controls, 13 ASD
Left caudate body 25 18 29 C−0.004 ASD+0.027
Tracts in 22 controls, 22 ASD
Left cuneus 19 84 26 C−0.066
ASD−0.010
Tracts in 22 controls, 22 ASD
Left Uncus 28 0 −33 C−0.020
ASD+0.005
Tracts in 5 controls, 6 ASD
ROI_1 and ROI_2 refer to the regions used in tractography analysis. [Direction of between-group difference for functional connectivity is denoted with arrows (−, Negative functional connectivity,+, Positive functional connectivity), C, Control group, ASD, Autism Spectrum Disorder group].
DIFFUSION TRACTOGRAPHY PROTOCOL
CSD based tractography was used in this study. Typically a model of diffusion tensor tractography has been used in ASD research, however in recent years it has become evident that there are significant limitations associated with this method, in particular in voxels containing more than one coherently oriented fiber population (e.g., in “crossing fibers” configura-tions;Wedeen et al., 2000; Alexander et al., 2002; Frank, 2002; Wedeen et al., 2008; Tournier et al., 2011; Jeurissen et al., 2012). The CSD method allows reliable estimation of one or more fiber orientations in the presence of intra-voxel orien-tational heterogeneity (Tournier et al., 2004, 2007, 2008), it overcomes partial volume effects associated with diffusion ten-sor imaging (Vos et al., 2011, 2012), permits fiber-tracking through regions of crossing fibers (Tournier et al., 2008), and has recently shown promising results in other clinical appli-cations (Metzler-Baddeley et al., 2012; Reijmer et al., 2012, 2013).
The WM tracts between each pair of ROIs were reconstructed using CSD based tractography (Jeurissen et al., 2011). This trac-tography procedure consisted of the following steps: (i) CSD, using a spherical harmonics model with maximum harmonic degree L=8 was used to extract the fiber orientation distri-bution (FOD) from the diffusion weighted signal in each voxel (Tournier et al., 2007), (ii) Seed points were defined on a uni-form 2×2×2 mm3grid to cover the entire brain; (iii) For each step during tract propagation, the FOD peak direction that was closest to the previous stepping direction was extracted; (iv) The
trajectory was advanced with a fixed step size (1 mm) along the peak direction obtained with step (iii). Tracking ended when the FOD peak magnitude was beneath a fixed threshold (i.e., 0.1), or when a maximum angle (30◦) was exceeded. Subsequently, from this whole-brain tractography result, WM tracts that ran directly between each pair of ROIs were identified by coding the two regions as “AND” regions (i.e., only WM tracts that passed through ROI 1 and ROI 2 were isolated).
DEPENDENT MEASURES
For each tract in each participant, microstructural measures of FA and the Westin measures of linear diffusion coefficient (CL) and planar diffusion coefficient (CP;Westin et al., 2002) were computed from the tracts. The mean values for FA, CL, and CP were extracted from all tracts using Explore DTI software (Leemans et al., 2009). FA was the primary measure of interest as it is the most widely used measure in the literature, and shows high sensitivity. In regions of complex fiber architecture how-ever, tensor derived measures such as FA are unreliable (Jones and Cercignani, 2010) and the interpretation of these measures can be ambiguous (Jeurissen et al., 2012) and seeMcGrath et al. (2013)for discussion. In order to reduce the ambiguity about the biological interpretation of FA changes, alternative measures of diffusion anisotropy are often measured in conjunction with FA. One example of such alternative tensor-based metrics are the Westin measures of CL and CP. Although these measures are indeed still based on the eigenvalues, they can describe the geometrical shape of the diffusion tensor and, therefore, can provide a more meaningful interpretation of microstructural changes that are occurring in the ASD group compared to the FA (Westin et al., 2002; Reijmer et al., 2013). A high value of CL implies that there is only one dominant fiber orientation within a voxel (Vos et al., 2012) and a high value of CP indi-cates the presence of crossing fiber configurations (Vos et al., 2012).
STATISTICAL ANALYSIS
Between-group differences in white matter structure
Statistical comparisons of the data were performed using PASW (SPSS) software version 18 (SPSS Inc., Chicago, IL). For all anal-yses the level of statistical significance was defined asp<0.05 (two-tailed) and Bonferroni corrections were used for within-test comparisons. To investigate whether there were between-group differences in the WM of tracts that directly connected a pair of brain regions, univariate ANOVA with Group (ASD/Control) as the between-subjects factor was performed for the dependent measures FA, CL, and CP in each separate set of these WM tracts.
Correlation analyses
To explore how brain WM structure, functional connectivity and behavior are related, a number of exploratory correlation analy-ses (using bivariate Pearson correlation analysis) were performed to investigate the relationships between (1) WM structure and functional connectivity, (2) WM structure and behavior, (3) func-tional connectivity and behavior. Given the extremely limited data in current literature, in both autism and healthy popu-lations, on relationships between brain structural connectivity, functional connectivity, and behavior, it was felt important that all these measures were included to comprehensively explore the possible associations. Pearson correlation analysis was used as behavioral response times, fcMRI and DTI data in this study are normally distributed, as indicated byp-values of>0.05 following Kolmgorov–Smirnov and Shapiro–Wilk tests of normality. The correlation analyses were exploratory in nature, and correction for multiple comparisons was not performed.
Measures of white matter structure, functional connectivity and behavior included in the correlation analyses.For WM struc-ture, FA was included in the correlation analysis. This measure of WM structure is the most widely used measure in the literature, and shows high sensitivity.
Four measures of functional connectivity were included in the correlation analyses; negative functional connectivity on Same trials, negative functional connectivity on Mirror trials, positive functional connectivity on Same trials and positive functional connectivity on Mirror trials. The distinction between Same and Mirror trials was included in the correlations as behavioral and functional connectivity analyses both demonstrated an inter-esting dissociation between ASD and control groups on Same vs. Mirror trials (McGrath et al., 2012). These findings may indicate that visuospatial processing in ASD is achieved using qualitatively (and quantitatively) different neural networks. A primary aim of the current study was to increase our under-standing of the structural correlates of atypical visuospatial processing in ASD. We hypothesized that correlation analyses would demonstrate differential relationships between ASD and control groups on Same and Mirror trials. A distinction was also made between negative and positive functional connectiv-ity. Unfortunately, there is very limited literature investigating the relationships between structural and functional connectiv-ity in neurotypical populations, therefore it is not possible to make specific predictions about how structural connectivity may relate differentially to these types of functional connectivity. Nevertheless, there is an important difference between these mea-sures in terms of functional interactions between brain regions (seeMcGrath et al., 2012, for discussion). While it seems plau-sible that the level of WM organization should be correlated with the overall strength of functional connectivity, it was felt that it would not be appropriate to combine negative and pos-itive functional connectivity into a composite measure as doing so might obscure important relationships between WM orga-nization and functional connectivity. Functional connectivity values were individual z-scores extracted from the PPI Main effect of Group results. These were extracted for each partici-pant for each pair of brain regions in which there were WM connections.
The behavioral data used in the correlation analyses provided a measure of visuospatial processing speed. This was calculated using mean response times (MRTs) for the Same and Mirror trials during a mental rotation task (McGrath et al., 2012).
A set of correlation analyses was performed for every set of brain regions that had direct WM connections. The groups (ASD and controls) were analysed separately for the correlation analyses.
RESULTS
OVERVIEW OF RESULTS
Section 3.1
functional connectivity, which are reported in McGrath et al. (2012).
Section 3.2
Results relate to Question 2 outlined in the Methods section Overview of Methods—if there were WM tracts that directly linked pairs of brain regions showing abnormal functional con-nectivity, were there structural abnormalities of this WM in the ASD group? This section outlines the between-group compar-isons of diffusion measures extracted from the isolated WM tracts.
Section 3.3
Results relate to Question 3 outlined in the Methods sec-tion Overview of Methods—was there evidence for relasec-tion- relation-ships between structural connectivity, functional connectivity and behavior? This section outlines the results of the correlation analyses.
[image:9.595.305.549.159.323.2]ARE THERE WHITE MATTER TRACTS BETWEEN ALL PAIRS OF ROIs THAT ARE FUNCTIONALLY CONNECTED?
Table 3 summarizes the results of the tractography analy-ses between the 10 pairs of ROIs that showed abnormal functional connectivity. In summary, there were WM tracts directly connecting the left BA19 ROI to five other ROIs including the left uncus, left cuneus, left caudate head, left caudate body, and left thalamus (see Figures 1–5). There were no WM tracts in any participants between the other five pairs of seed regions. Consequently, the subsequent analyses of diffusion measures and the correlation analyses are restricted to the five pairs of ROIs with direct WM tracts.
FIGURE 1 | (A)Regions for tractography in left BA19 (green sphere) and left caudate head (yellow sphere). The ASD group showed weaker functional connectivity relative to controls between these regions during a mental rotation task. The bar graph shows the strength of functional connectivity (FC) in the Control group (blue) and ASD group (orange) between these seed regions.(B)Example of white matter tracts that directly connect the left BA19 and left caudate head regions in one participant. The bar graph shows Fractional Anisotropy (FA) in the Control group (blue) and ASD group (orange) in these white matter tracts.∗indicates statistical significance with
p<0.05.
IF THERE WERE WHITE MATTER TRACTS THAT DIRECTLY LINKED PAIRS OF BRAIN REGIONS SHOWING ABNORMAL FUNCTIONAL CONNECTIVITY, WERE THERE STRUCTURAL ABNORMALITIES OF THIS WHITE MATTER IN THE ASD GROUP?
Changes in white matter between left BA19 and left caudate head There were WM tracts directly connecting the regions in left BA19 and left caudate head in 9 controls and 11 participants
FIGURE 2 | (A)Regions for tractography in left BA19 (green sphere) and left thalamus (yellow sphere). The ASD group showed much weaker functional connectivity relative to controls between these regions during a mental rotation task. The bar graph shows the strength of functional connectivity (FC) in the Control group (blue) and ASD group (orange) between these regions.(B)Example of white matter tracts that directly connect the left BA19 and left thalamus regions in one participant. The bar graph shows Fractional Anisotropy (FA) in the Control group (blue) and ASD group (orange) in these white matter tracts.∗indicates statistical significance withp<0.05.
FIGURE 3 | (A)Regions for tractography in left BA19 (green sphere) and left caudate body (yellow sphere). The ASD group showed increased functional connectivity relative to controls between these regions during a mental rotation task. The bar graph shows the strength of functional connectivity (FC) in the Control group (blue) and ASD group (orange) between these regions.(B)Example of white matter tracts that directly connect the left BA19 and left caudate body regions in one participant. The bar graph shows Fractional Anisotropy (FA) in the Control group (blue) and ASD group (orange) in these white matter tracts.∗indicates statistical significance with
[image:9.595.305.548.431.602.2] [image:9.595.47.289.434.602.2]FIGURE 4 | (A)Regions for tractography in left BA19 (green sphere) and left cuneus (yellow sphere). The ASD group showed weaker functional connectivity relative to controls between these regions during a mental rotation task. The bar graph shows the strength of functional connectivity (FC) in the Control group (blue) and ASD group (orange) between these regions.(B)Example of white matter tracts that directly connect the left BA19 and left cuneus regions in one participant. The bar graph shows Fractional Anisotropy (FA) in the Control group (blue) and ASD group (orange) in these white matter tracts.∗indicates statistical significance with
p<0.05.
FIGURE 5 | (A)Regions for tractography in left BA19 (green sphere) and left uncus (yellow sphere). The ASD group showed weaker functional connectivity relative to controls between these regions during a mental rotation task. The bar graph shows the strength of functional connectivity (FC) in the Control group (blue) and ASD group (orange) between these regions.(B)Example of white matter tracts that run through the left BA19 and left uncus regions in one participant. The bar graph shows Fractional Anisotropy (FA) in the Control group (blue) and ASD group (orange) in these white matter tracts.∗indicates statistical significance withp<0.05.
with ASD, and the WM tracts linking these regions formed part of the left IFOF (seeFigure 1). Univariate ANOVA of the dependent measures from diffusion analysis revealed that there was significantly reduced FA (mean FA ASD 0.38,SD0.04, con-trols 0.42,SD0.05, F=5.972,p=0.027,η2
p=0.272) and CL (mean CL ASD 0.35,SD0.04, controls 0.40,SD0.06,F=5.074, p=0.039, η2p=0.199) in the ASD group relative to controls
(Table 4), indicating that WM microstructural organization was reduced in these tracts in the ASD group.
Changes in white matter between left BA19 and left thalamus There were WM tracts directly connecting left BA19 and left tha-lamus in 12 controls and 13 participants with ASD, and this WM appeared to comprise part of the left IFOF (seeFigure 2). Univariate ANOVA revealed significantly reduced FA (mean FA ASD 0.36,SD0.04, controls 0.40,SD0.04,F=4.306,p<0.050, η2
p=0.170) and CL (mean CL ASD 0.34,SD0.04 controls 0.38, SD0.03,F=8.085,p<0.010,η2p=0.278) in the ASD group rel-ative to controls in the WM directly connecting left BA19 and left thalamus regions.
Changes in white matter between left BA19 and left caudate body There were WM tracts directly connecting left BA19 and left cau-date body in 22 controls and 22 participants with ASD, and this WM appeared to be part of the superior longitudinal fascicu-lus (seeFigure 3). There were no between-group differences in microstructural measures of the WM linking left BA19 and left caudate body.
[image:10.595.47.289.61.222.2]Changes in white matter between left BA19 and left cuneus There were WM tracts directly connecting the regions in left BA19 and left cuneus in 22 controls and 22 participants with ASD (see
Table 3). This WM tract ran intra-occipitally in the left hemi-sphere (seeFigure 4). There were no between-group differences in microstructural organization of this tract (seeTable 4).
Changes in white matter between left BA19 and left uncus
There were WM tracts directly connecting the regions in left BA19 and the left uncus in only 5 controls and 6 participants with ASD (seeTable 3). This WM appeared to be part of the left IFOF/left inferior longitudinal fasciculus (seeFigure 5). There were no between-group differences in WM microstructure in this tract (seeTable 4).
IS THERE EVIDENCE FOR RELATIONSHIPS BETWEEN STRUCTURAL CONNECTIVITY, FUNCTIONAL CONNECTIVITY AND BEHAVIOR?
Correlation analyses of behavioral measures, diffusion measure, and functional connectivity in left BA19/left caudate head region For both control and ASD groups, no significant correlations were found between the functional connectivity and mean RT mea-sures (Table 5), FA and mean RTs (Table 6), or FA and functional connectivity measures (Table 7and seeFigure 6).
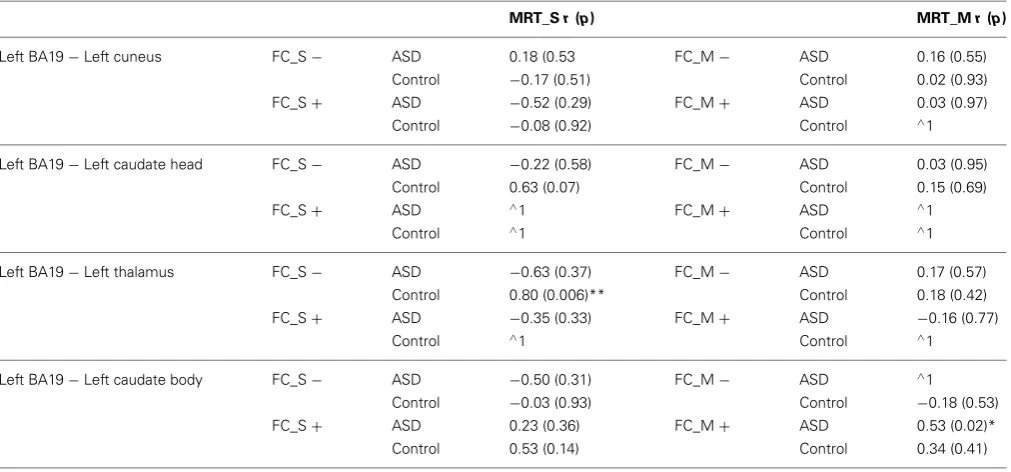
Correlation analyses of behavioral measures, diffusion measures, and functional connectivity in left BA19/left thalamus region Controls.In controls, there was a significant correlation between negative functional connectivity during Same trials, and MRT during these trials (r=0.80, p<0.006), indicating that a reduction in MRT (i.e., faster task performance) was associ-ated with stronger negative connectivity (see Table 5 and see
Figure 6).
There was no significant correlation between the diffusion measure of FA and MRT.
[image:10.595.48.291.347.513.2]Table 4 | The mean, standard deviation andp-values for the three micro-structural dependent measures (FA, CP, CL) for white matter tracts connecting functionally defined regions in the ASD and control groups.
Tract Left BA19− Left BA19− Left BA19− Left BA19− Left BA19−
Left uncus Left cuneus Left caudate head Left thalamus Left caudate body
ASDn=6 ASDn=22 ASDn=9 ASDn=12 ASDn=22
Conn=5 Conn=22 Conn=11 Conn=13 Conn=22
Measure Group Mean (SD) p Mean (SD) p Mean (SD) p Mean (SD) p Mean (SD) p
FA ASD 0.37 (0.06) 0.69 0.35 (0.04) 0.98 0.38*(0.04) 0.02* 0.36*(0.04) 0.05* 0.37 (0.03) 0.23 Con 0.37 (0.07) 0.35 (0.03) 0.42*(0.05) 0.39*(0.04) 0.38 (0.03) CP ASD 0.16 (0.03) 0.65 0.17 (0.03) 0.81 0.16 (0.02) 0.93 0.16 (0.04) 0.48 0.19 (0.03) 0.85
Con 0.17 (0.04) 0.17 (0.02) 0.16 (0.01) 0.15 (0.02) 0.19 (0.02)
[image:11.595.46.552.350.586.2]CL ASD 0.35 (0.05) 0.78 0.32 (0.05) 0.96 0.35*(0.04) 0.04* 0.34**(0.04) 0.01** 0.33 (0.03) 0.26 Con 0.34 (0.08) 0.32 (0.04) 0.40*(0.06) 0.38**(0.03) 0.34 (0.03) *Indicates statistical significance p<0.05; **indicates statistical significance p<0.01.
Table 5 | Results of correlation analysis between functional connectivity and mean response times during Same and Mirror trials of a mental
rotation task (p:p-value, r: Pearson correlation co-efficient, FC_S−Negative functional connectivity on Same trials, FC_S+Positive functional connectivity on Same trials, FC_M−Negative functional connectivity on Mirror trials, FC_M+Positive functional connectivity on Mirror trials, MRT: mean response time,∧1 Insufficient data for correlation as all functional connectivity values were negative between seed regions in left BA19 and left caudate head).
MRT_Sr(p) MRT_Mr(p)
Left BA19−Left cuneus FC_S− ASD 0.18 (0.53 FC_M− ASD 0.16 (0.55)
Control −0.17 (0.51) Control 0.02 (0.93)
FC_S+ ASD −0.52 (0.29) FC_M+ ASD 0.03 (0.97)
Control −0.08 (0.92) Control ∧1
Left BA19−Left caudate head FC_S− ASD −0.22 (0.58) FC_M− ASD 0.03 (0.95)
Control 0.63 (0.07) Control 0.15 (0.69)
FC_S+ ASD ∧1 FC_M+ ASD ∧1
Control ∧1 Control ∧1
Left BA19−Left thalamus FC_S− ASD −0.63 (0.37) FC_M− ASD 0.17 (0.57)
Control 0.80 (0.006)** Control 0.18 (0.42)
FC_S+ ASD −0.35 (0.33) FC_M+ ASD −0.16 (0.77)
Control ∧1 Control ∧1
Left BA19−Left caudate body FC_S− ASD −0.50 (0.31) FC_M− ASD ∧1
Control −0.03 (0.93) Control −0.18 (0.53)
FC_S+ ASD 0.23 (0.36) FC_M+ ASD 0.53 (0.02)*
Control 0.53 (0.14) Control 0.34 (0.41)
*Indicates statistical significance p<0.05; **indicates statistical significance p<0.01.
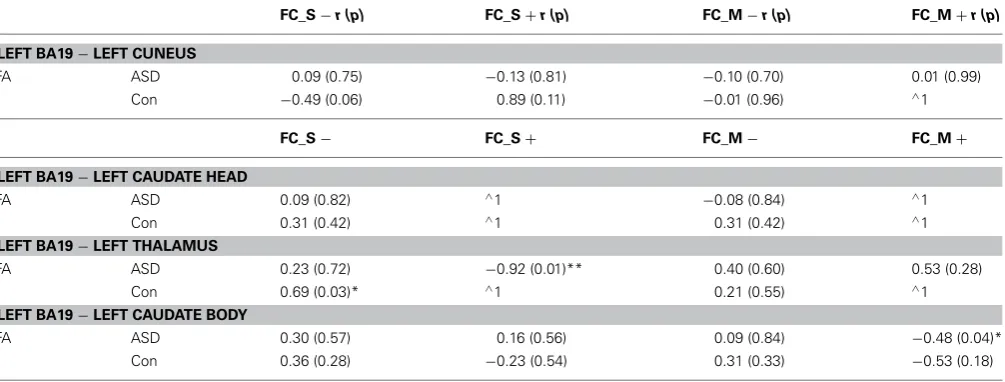
functional connectivity between these regions. FA was signifi-cantly correlated (r=0.69, p<0.03) with negative functional connectivity on Same trials in controls (see Table 7 and see
Figure 6). This correlation indicates that as WM organization increases (with increasing FA), there is a correlated reduction in the strength of negative functional connectivity.
ASD.In the ASD group, there were no correlations between mental rotation performance (MRT) and functional connectivity
Table 6 | Results of correlation analysis between mean response times during a mental rotation task and the micro-structural diffusion measure of FA extracted from the white matter tracts linking functionally defined regions.
Left BA19− Left BA19− Left BA19− Left BA19−
Left cuneus Left caudate head Left thalamus Left caudate body
MRT_Sr (p) MRT_Mr (p) MRT_Sr (p) MRT_Mr (p) MRT_Sr (p) MRT_Mr (p) MRT_Sr (p) MRT_Mr (p)
FA ASD −0.04 (0.85) 0.17 (0.44) −0.31 (0.39) −0.09 (0.80) −0.01 (0.98) −0.05 (0.89) −0.48 (0.03)* −0.57 (0.01)** Con −0.14 (0.53) −0.33 (0.13) 0.12 (0.77) −0.32 (0.39) 0.25 (0.43) 0.09 (0.79) −0.01 (0.98) 0.02 (0.94)
(p, p value; r, Pearson correlation co-efficient; MRT_S, mean response time on Same trials; MRT_M, mean response time on Mirror trials). *Indicates statistical significance p<0.05; **indicates statistical significance p<0.01.
Table 7 | Results of correlation analysis between diffusion measures in white matter tracts and functional connectivity during Same and Mirror
trials of a mental rotation task (p,p-value;r, Pearson correlation co-efficient; FC_S−Negative functional connectivity on Same trials; FC_S+ Positive functional connectivity on Same trials, FC_M−Negative functional connectivity on Mirror trials, FC_M+Positive functional
connectivity on Mirror trials, Con: Control,∧1 Insufficient data for correlation as all functional connectivity values were negative between seed regions in left BA19 and left caudate head).
FC_S−r (p) FC_S+r (p) FC_M−r (p) FC_M+r (p)
LEFT BA19−LEFT CUNEUS
FA ASD 0.09 (0.75) −0.13 (0.81) −0.10 (0.70) 0.01 (0.99)
Con −0.49 (0.06) 0.89 (0.11) −0.01 (0.96) ∧1
FC_S− FC_S+ FC_M− FC_M+
LEFT BA19−LEFT CAUDATE HEAD
FA ASD 0.09 (0.82) ∧1 −0.08 (0.84) ∧1
Con 0.31 (0.42) ∧1 0.31 (0.42) ∧1
LEFT BA19−LEFT THALAMUS
FA ASD 0.23 (0.72) −0.92 (0.01)** 0.40 (0.60) 0.53 (0.28)
Con 0.69 (0.03)* ∧1 0.21 (0.55) ∧1
LEFT BA19−LEFT CAUDATE BODY
FA ASD 0.30 (0.57) 0.16 (0.56) 0.09 (0.84) −0.48 (0.04)*
Con 0.36 (0.28) −0.23 (0.54) 0.31 (0.33) −0.53 (0.18)
*Indicates statistical significance p<0.05; **indicates statistical significance p<0.01.
Correlation analyses of behavioral measures, diffusion measures, and functional connectivity in left BA19/left caudate body region Controls.In controls, there were no correlations between the dif-fusion measure, functional connectivity, and MRT during mental rotation (seeTables 5–7and seeFigure 6).
ASD.In the ASD group there was a significant correlation between the behavioral measure of MRT during Mirror trials and positive functional connectivity (r=0.53,p<0.02; seeTable 5
and see Figure 6). This indicates that faster MRT on Mirror trials is associated with reduced strength of positive functional connectivity.
There was a significant correlation between FA and MRT on Same (r= −0.48,p<0.03) and Mirror (r= −0.57,p<0.01) trials indicating that as microstructural organization of the WM linking left BA19 and left caudate body increases (characterized by an increase in FA), there is an associated reduction in MRT (i.e., faster MRT) in the ASD group (seeTable 6and seeFigure 6).
There was also correlation between FA and functional con-nectivity in the ASD group. FA was significantly correlated with
positive functional connectivity on Mirror trials (r= −0.48,p< 0.04; see Table 7 and see Figure 6) indicating that increased structural organization of WM (increased FA) is associated with reduced strength of positive functional connectivity.
Correlation analyses of behavioral measures, diffusion measure, and functional connectivity in left BA19/left cuneus region
For both control and ASD groups, no significant correlations were found between the functional connectivity and MRT data (Table 5), the diffusion data and mean RTs (Table 6), or the diffusion data and functional connectivity data (Table 7).
Correlation analyses of behavioral measures, diffusion measure, and functional connectivity in left BA19/left uncus region
FIGURE 6 | Scatterplots of correlation analyses showing significant relationships between functional connectivity, structural connectivity and behavior.
DISCUSSION
The main finding of this study is that there are microstruc-tural abnormalities in WM tracts that directly connect brain regions showing abnormal functional connectivity in participants with ASD. In addition, there are significant correlations between measures of WM microstructure, functional connectivity and behavior, which provide insight into the relationships between brain structure, brain function, and information processing in both neurotypical controls and individuals with ASD.
This discussion focuses on the implications these results have for the original hypotheses of this study, which predicted firstly
that there would be WM tracts linking some, but not all pairs of brain regions showing abnormal functional connectivity, sec-ondly that WM structure would be abnormal in tracts directly connecting the functionally defined regions and finally that there would be relationships between microstructural organization of WM, functional connectivity and behavior.
FUNCTIONAL CONNECTIVITY IS NOT ALWAYS ASSOCIATED WITH DIRECT WHITE MATTER CONNECTIONS
tractography. These regions were generated from functional con-nectivity maps during a mental rotation task, and indicated brain regions between which there was abnormal functional connectiv-ity in ASD. Tractography analysis revealed that there were WM tracts directly connecting five of these 10 pairs of regions in most participants. For the other five region pairs there were no direct structural connections in any participants. This finding supports the first hypothesis. This finding of a direct structural connection between only half of the regions showing functional connectivity is consistent with results of imaging studies that have used a sim-ilar multimodal approach to integrate fcMRI and diffusion MRI. One of the first studies to use this approach reported that high functional and low structural connectivity can co-occur, but that low functional connectivity rarely occurs between regions where there is high structural connectivity (Koch et al., 2002). In keep-ing with this findkeep-ing, a more recent study investigatkeep-ing the links between resting state functional connectivity and structural con-nectivity revealed that functional concon-nectivity between regions is not indicative of a direct structural connection between those regions (Honey et al., 2009). This is likely to be because functional connectivity can be mediated by indirect connections or by input from a third region into the two regions, which modulates con-nectivity in the two primary regions (Koch et al., 2002; Honey et al., 2009; Behrens and Sporns, 2012).
ABNORMAL FUNCTIONAL CONNECTIVITY IS ASSOCIATED WITH ABNORMAL STRUCTURAL CONNECTIVITY
As discussed in section Evidence for a Relationship Between Brain White Matter Structure and Functional Connectivity in Neurotypical Populations of the introduction, previous studies have demonstrated a relationship between abnormal functional connectivity and abnormal structural connectivity (Quigley et al., 2003; Johnston et al., 2008; Lowe et al., 2008). Consistent with the prediction that abnormal functional connectivity would be associated with abnormal structural connectivity in the current study, there was reduced microstructural organization of WM in two of the five tracts linking regions of abnormal functional con-nectivity. In the ASD group, there was a significant reduction in the strength of functional connectivity between an occipital region (left BA19) and the left caudate head and also between this occipital seed region and the left thalamus. Analysis of diffu-sion measures in the WM directly linking these occipito-striatal and occipito-thalamic regions revealed significant microstruc-tural abnormalities in the ASD group, which were characterized by reduced FA and CL, two measures that provide an indica-tion of the level of organizaindica-tion of WM fibers. This finding of altered structural connectivity between brain regions that also show reduced functional connectivity is particularly interesting as it provides novel evidence to suggest that structural brain pathol-ogy may contribute to the abnormal functional connectivity that has been widely reported in the autism literature.
It is also noteworthy that the WM in both these tracts formed part of the left IFOF, a major WM association tract in the human brain. Interestingly, this study revealed structural abnormalities in this sub-region of the left IFOF, whereas a previous analysis of the whole left IFOF using the same data from the same study popula-tion found no abnormalities of WM (McGrath et al., 2013). This
is of relevance as it supports a concern that current whole brain or even tract-specific analyses of WM may lack sensitivity in detect-ing WM abnormalities, and may not be specific enough about the exact locations of pathology in cases where abnormalities are reported.
It is important however to note that for the remaining three of the five WM tracts directly connecting regions showing abnormal functional connectivity, there was no evidence of disrupted orga-nization of WM. In addition, in only one of these three tracts were there significant correlations between DTI and fcMRI measures (discussed in more detail in the following section). These findings are consistent with the theory that functional connectivity can be modulated by factors other than the level of microstructural orga-nization of WM connecting brain regions. Such factors include the number of WM connections between regions; Hermudstat et al. recently demonstrated that the number of WM connections is positively correlated with the strength of resting state functional connectivity (Hermundstad et al., 2013). There are numerous dif-fusion measures that could be used to infer a level of “structural connectivity” in the human brain, but to date, the impact of most of these measures on functional connectivity is poorly under-stood. Neurochemical factors may also play an important role in modulation of functional connectivity, but a detailed discussion of these factors is outside the scope of this manuscript.
CORRELATIONS BETWEEN MICROSTRUCTURAL ORGANIZATION OF WHITE MATTER, FUNCTIONAL CONNECTIVITY AND BEHAVIOR
Correlation analysis revealed intriguing links between WM microstructure, functional connectivity and behavior in two of the five pairings in which there were direct WM tract connections; between regions in left BA19 and left thalamus, and between left BA19 and left caudate.
reduced FA and faster response times, it is possible that the reduced FA in the ASD group may contribute to their relative behavioral advantage in visuospatial processing.
Functional connectivity between left BA 19 and left caudate body was significantly increased in the ASD group relative to controls, but WM organization in the tracts directly connect-ing these regions was normal. The correlation analyses however implied that there were significant between-group differences in the functional use of this tract during visuospatial processing. Controls showed no association between structural, functional, and behavioral measures, whereas structural connectivity, func-tional connectivity, and visuospatial processing speed appeared to be strongly related in the ASD group. The lack of correlations in controls is in sharp contrast to the strong relationships found in the ASD group and might indicate that the ASD group relies on connectivity between these regions during visuospatial pro-cessing, whereas the controls do not. In relation to correlations observed in the ASD group, firstly greater organization of WM (higher FA) was associated with reduced functional connectivity between left BA19 and left caudate. Secondly, reduced functional connectivity between these regions was associated with faster MRT. Finally, faster MRT was correlated with greater microstruc-tural organization of the WM between left BA19 and left caudate body. When considered together, these correlations suggest that a higher level of structural organization of this tract confers a benefit to visuospatial processing speed in ASD that may be medi-ated by increased functional suppression between left BA19 and left caudate. This finding is perplexing, as higher levels of WM organization have previously been associated with stronger rather than weaker functional connectivity; van de Heuvel reported a positive correlation between strength of functional connectivity in the default mode network and the level of FA in the cingulum (van den Heuvel et al., 2008) and another study demonstrated that increased radial diffusivity in WM connecting right and left primary sensorimotor cortices was associated with reduction of functional connectivity between these regions (Lowe et al., 2008). A recent paper specifically investigating the relationships between structural connectivity and resting state/task-based func-tional connectivity in the human brain’ (Hermundstad et al., 2013), did not investigate the degree of organization of WM, but revealed that it is a high number of connections that facil-itate strong resting state functional connectivity. In the current study, FA rather than number of connections was chosen as the measure of structural connectivity. In future studies investigat-ing relationships between structural and functional connectivity, the measure(s) used to infer structural connectivity should be carefully considered.
Correlation analyses of connectivity and behavior between left BA19 and left caudate head and between left BA19 and left cuneus regions did not yield such strong evidence for an inter-relationship of structure, function, and behavior. There were no relationships between brain structure, functional connectivity or behavior. It is difficult to speculate on the reasons for this rel-ative lack of structure/function/behavior correlations between these regions because, as discussed already, there is very little literature documenting relationships between brain WM struc-ture and functional connectivity. There is however increasing
recognition of the urgent need for research investigating links between anatomical connectivity, functional connectivity and behavior; this knowledge is crucial to understand the “capabilities of and constraints on human cognitive function” (Hermundstad et al., 2013).
DIRECT IMPLICATIONS OF THIS STUDY
Together, these findings offer a fascinating insight into the rela-tionships between brain structure, brain function, and informa-tion processing in both neurotypical controls and individuals with ASD. This multimodal imaging study has used a novel approach to integrate functional and structural neuroimaging data. It has demonstrated, for the first time in ASD research that there is reduced microstructural organization of WM in tracts that directly connect brain regions that show abnormal functional connectivity. It also reveals that in some brain regions, individ-ual differences in WM organisation are related to the level of functional connectivity during a visuospatial processing task, and further that this relationship has consequences on behavior.
There are many studies investigating functional or structural connectivity in ASD; however to date none have attempted to relate the two types of connectivity, an approach that is vital to increase understanding of the underlying neurobiology. The approach that is described in this study is rational and clinically feasible. It is hoped that future neuroimaging research in ASD will follow this type of methodology to integrate investigation of functional and structural connectivity. It will be interesting to see the impact of abnormal structural connectivity on functional connectivity during other neuropsychological paradigms and at rest.
POTENTIAL IMPLICATIONS OF FINDINGS FROM CURRENT STUDY ON THERAPEUTIC INTERVENTIONS FOR AUTISM
![Table 1 | Demographics of study participants *Full scale IQ was estimated based on four sub-scales of the WISC/WAIS [Wechsler IntelligenceScale for Children (WISC-III or IV UK), (Wechsler, 2004) and Wechsler Adult Intelligence Scale (WAIS-III), (Wechsler, 1997)].](https://thumb-us.123doks.com/thumbv2/123dok_us/889619.601433/4.595.44.552.87.216/demographics-participants-estimated-wechsler-intelligencescale-children-intelligence-wechsler.webp)