ANALYTICAL METHOD DEVELOPMENT AND VALIDATION FOR
SIMULTANEOUS ESTIMATION OF TENELIGLIPTIN AND
METFORMIN BY USING RP HPLC
R. Vasanthi*1, Nazia Begum1, M. Alagar Raja1, K. Rajeswar Dutt1, K. N. V. Rao1,
H. Ramana2 and G. Koteshwar Rao1
1
Nalanda College of Pharmacy, Charlapally, Nalgonda, T.S.
2
Venkateshwara Institute of Pharmaceutical Sciences, Charlapally, Nalgonda, T.S.
ABSTRACT
A Rapid and Precise Reverse Phase High Performance Liquid
Chromatographic method has been developed for the validated of
Teneligliptin and Metformin, in its pure form as well as in tablet
dosage form. Chromatography was carried out on X-Terra C18 (4.6 x
150mm, 5µm) column using a mixture of Methanol: TEA Buffer pH
4.5: Acetonitrile (65:15:20) as the mobile phase at a flow rate of
1.0ml/min, the detection was carried out at 243 nm. The retention time
of the Teneligliptin and Metformin was 2.090, 5.289±0.02min
respectively. The method produce linear responses in the concentration
range of 5-25mg/ml of Teneligliptin and 45-225mg/ml of Metformin. The method precision
for the determination of assay was below 2.0%RSD. The method is useful in the quality
control of bulk and pharmaceutical formulations.
KEYWORDS: Teneligliptin, Metformin, RP-HPLC, validation.
INTRODUCTION
Teneligliptin (Figure No.1) is the inhibitors of dipeptidyl peptidase-4, gliptins, are a class of
oral hypoglycemic drugs that block DPP-4. They are used for diabetes mellitus type-2.
Glucagon increases blood glucose levels and DPP-4 inhibitor which reduces glucagon and
blood glucose levels. The mechanism of action of DPP-4 inhibitors is to increase incretin
levels (GLP-1 & GIP), which inhibit glucagon release, which in turn increases insulin
secretion, decreases gastric emptying and decreases blood glucose levels.[1] Metformin
Volume 6, Issue 8, 1280-1291. Research Article ISSN 2277– 7105
*Corresponding Author
Dr. R. Vasanthi
Nalanda College of
Pharmacy, Charlapally,
Nalgonda, T.S.
Article Received on 29 May 2017,
Revised on 19 June 2017, Accepted on 10 July 2017
(Figure No.2) is a biguanide anti hyperglycemic agent used for treating
non-insulin-dependent diabetes mellitus (NIDDM). It improves glycemic control by decreasing hepatic
glucose production, glucose absorption and increasing insulin-mediated glucose uptake. This
may induce weight loss and drug of choice for obese NIDDM patients. Metformin
hydrochloride (MET) is chemically N, N dimethylimidodicarbonimidic diamide
hydrochloride (1, 1-Dimethylbiguanide hydrochloride) which acts by decreasing intestinal
absorption of glucose reducing hepatic glucose production and increasing sensitivity.[2] Teneligliptin shows effective control of blood sugar when combined with Metformin.
Literature survey reveals that few HPLC and UV spectrophotometric methods have been
reported for determination of Metformin, Teneligliptin individually and combined with
various gliptins tablet form.[3-9] A successful study is done for estimation of by. However, the development of simultaneous estimation of Teneligliptin and Metformin in combined dosage
form by RP-HPLC method has not yet been reported. Hence, this manuscript is the first to
describe the development and validation of some simpler, sensitive, precise, accurate and cost
effective UV spectroscopic methods for the simultaneous determination of Teneligliptin and
Metformin in combined tablet formulation.
MATERIALS AND METHODS
Chemicals and Reagents
Acetonitrile, Water and Methanol of HPLC grade were obtained from LICHROSOLV
(MERCK) Mumbai, India. Pharmaceutical grade Teneligliptin and Metformin were obtained
from, Hyderabad, India.
Instruments
The analysis was performed by using the weighing machine, pH meter (Lab India). The
HPLC used is of WATERS Alliance 2695seperation module with 996 PDA detector. The
output signal was monitored and integrated using Empower 2 software. A Symmetry C18,
X-bridge column, Xterra. Phenomenex Luna C18 (4.6 x 150mm, 5µm) was found to be ideal as
it gave good peak shape and resolution at 1ml/min flow.
REAGENTS AND SOLUTIONS
PREPARATION OF BUFFER AND MOBILE PHASE
Preparation of Triethylamine (TEA) buffer (pH-4.5)
Preparation of Mobile phase
Accurately weigh and transfer 10 mg of Teneligliptin and Metformin working standard into a
10ml of clean dry volumetric flasks add about 7ml of Methanol and sonicate to dissolve and
removal of air completely and make volume up to the mark with the same Methanol.
Preparation of Standard stock Solution
Accurately weigh and transfer 10 mg of Teneligliptin and 10mg of Metformin working
standard into a 10ml of clean dry volumetric flasks add about 7ml of Diluents and sonicate to
dissolve it completely and make volume up to the mark with the same solvent.
Further pipette 0.15ml of the above Teneligliptin and 1.35ml of Metformin stock solutions
into a 10ml volumetric flask and dilute up to the mark with Diluent.
Preparation of Sample Solution
Take average weight of tablet and crush in a mortor by using pestle and weight 10 mg
equivalent weight of Teneligliptin and Metformin sample into a 10ml clean dry volumetric
flask and add about 7ml of diluent and sonicate to dissolve it completely and make volume up
to the mark with the same solvent. Further pipette 1.35ml of sample stock solution into a
10ml volumetric flask and dilute up to the mark with diluent.
Assay
10µL of the standard solution was injected five times into the chromatographic system,
chromatograms were recorded and peak areas were measured. 10µL of the sample solution
was injected in five times into the chromatographic system, chromatograms were recorded
and peak areas were measured.
METHODS DEVELOPMENT[10-13]
The developed method was fully validated for the parameters as per ICH guidelines.
System Suitability
System suitability was done by replicate analysis injected for five times and measured the
area for all five injections in HPLC. The %RSD for the area of five replicate injections was
Linearity
Linearity is determined by a series of three to five injections of five or more standards. Plot a
graph of peak area (or heights) of the calibration standards are usually plotted in the Y-axis
against the nominal standard concentration, and the linearity of the plotted curve is evaluated
through the value of the co-relation coefficient (r2).The methods were linear in the range of
5ppm- 25ppm of Teneligliptin, 45-225ppm for metformin and inject each level into the
chromatographic system and measure the peak area.
Accuracy
Accuracy of the method was determined by inject the three replicate injections of individual
concentrations (50%, 100%, 150%) were made under the optimized conditions. Recorded the
chromatograms and measured the peak responses. Calculate the amount found and amount
added for Metformin and Teneligliptin and calculate the individual recovery and mean
recovery values.
Precision
To determine the precision, intra-day and inter-day analysis was performed. The standard
solution was injected for five times and measured the area for all five injections in HPLC.
The %RSD for the area of five replicate injections was found to be within the specified
limits.Solutions corresponding to each concentration level were injected in duplicate. The
precision of an analytical method is a measure of the random error and is defined as the
agreement between replicate measurements of the same sample.
Ruggedness
To evaluate the ruggedness of the method, precision was performed on different days by
maintaining same conditions. The testing of ruggedness is normally suggested when the
method is to be used in more than one laboratory. Ruggedness is normally expressed as the
lack of the influence on the test results of operational and environmental variables of the
analytical method.
Robustness
Robustness of the method was performed in different conditions to find the variability of test
results.The sample was analyzed at 0.8 ml/min and 1.1 ml/min instead of 1ml/min, remaining
recorded.Their effects on the retention time (TR), tailing factor (T), theoretical plate numbers
(N) and repeatability of peak areas (n = 6) were studied.
Limit of detection and Limit of quantification
The limit of detection and quantification were calculated using signal to noise ratio. The LOD
for Teneligliptin and Metformin were tested at specific level i.e 0.9µg/ml and 9.7µg/ml The
LOQ for Teneligliptin and Metformin were tested at specific level i.e2.0µg/ml and
29.4µg/ml.
RESULTS AND DISCUSSION
The goal of this study was to develop a new RPHPLC method, several mobile phase
compositions were tried for separation and quantification of Teneligliptin and Metformin in
bulk and pharmaceutical dosage forms. To develop an effective method for the analysis of the
drugs preliminary tests were performed in order to select adequate and optimum conditions.
Parameters such as detection wavelength, mobile phase composition and pH, mobile phase
comprising of Acetonitrile: Water in 70: 30v/v at a flow rate 0.8 ml/min to get a better
reproducibility and repeatability. Quantification was achieved with UV detection at 243 nm
and the retention time for Teneligliptin and Metformin were found to be 7.255 and 9.643
mins respectively. Typical chromatogram of Teneligliptin and Metformin is shown in Figure
No.3, 4. The optimized method was validated as per ICH guidelines.
System suitability
System suitability tests were carried out on freshly prepared standard solutions and the
parameters are summarized in Table.No.1.
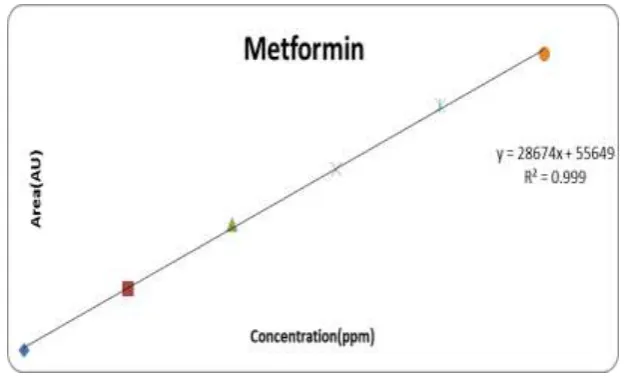
Linearity
The correlation coefficient for linear curve obtained between concentration vs. area for
standard preparations of Teneligliptin and Metformin (Figure No.5 & 6) is 0.999and 0.999
respectively. It shows that the good correlation exist between the drug and response. The
results are summarized in the Table No.2, 3.
Accuracy
The % Recovery for each level obtained for Teneligliptin was found to be within the limits
(98-102.0 %).The results obtained for recovery at 50%, 100%, 150% are within the limits.
to be within the limits (98-102%) as per the ICH guidelines the results were within the limit.
The results are shown in Table No.4, 5.
Precision
The % RSD of 6 determinations of Teneligliptin and Metformin for System precision
intraday and inter day was found to be within the acceptance criteria of not more than 2.0%.
The results are tabulated in Table No. 6, 7, 8, 9.
Limit of Detection and Limit of Quantification
Limit of detection result for Teneligliptin and Metformin was found to be 0.6 and 9.7
respectively and were within the limits. S/N ratio for Teneligliptin and Metformin were found
to be within the limits. Results are summarized in Table No.10, 11.
Robustness
The analysis was performed in different conditions to fine the variability of test results. The
conditions are checked for variation of results. Results are summarized in Table No. 12, 13.
Table No.1: System Suitability of Proposed Method
S.No Parameters Teneligliptin Metformin
1. Theoretical plates 5463 5786
2. Resolution 9.7 ---
3. Tailing Factor 1.44 1.40 4. Retention Time(min) 2.090 5.289
Table No.2: Linearity data of Teneligliptin
S.No Linearity level Concentration Area
1. I 5ppm 134436
2. II 10ppm 245571
3. III 15ppm 371548
4. IV 20ppm 499024
5. V 25ppm 619830
Correlation Coefficient (r2) 0.999
Table No.3: Linearity data of Metformin
S. No Linearity level Concentration Area
1. I 45ppm 1330054
2. II 90ppm 2728974
3. III 135ppm 3917063
4. IV 180ppm 5300022
5. V 225ppm 6412695
Table No.4: Accuracy results for Metformin
%Concentration
(at specification Level) Area
Amount Added (ppm) Amount Found (ppm) % Recovery Mean Recovery
50% 2001752 67.5 67.3 99.7
99.7%
100% 3927797 135 134.8 99.8
150% 5858665 202.5 202.1 99.8
Table No.5: Accuracy results for Teneligliptin
%Concentration
(at specification Level) Area
Amount Added (ppm) Amount Found (ppm) % Recovery Mean Recovery
50% 192446.6 7.5 7.4 98.6
98.7%
100% 374222 15 14.8 98.66
150% 555891.3 22.5 22.3 99.1
Table No.6: Results of Intra-day precision for Teneligliptin
S.No Injection Area
1. Injection- 1 362266 2. Injection-2 364902 3. Injection-3 366870 4. Injection-4 367273 5. Injection-5 368101
Mean 365882.4
Std.dev 2338.4
%RSD 0.6
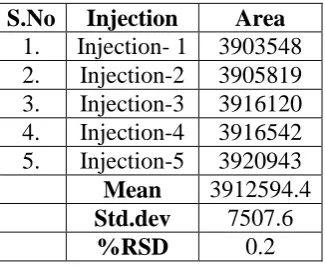
Table No.7: Results of Intra-day precision for Metformin
S.No Injection Area
1. Injection- 1 3903548 2. Injection-2 3905819 3. Injection-3 3916120 4. Injection-4 3916542 5. Injection-5 3920943
Mean 3912594.4
Std.dev 7507.6
%RSD 0.2
Table No.8: Results of Intermediate precision for Metformin
S. No Injection Area
1. Injection- 1 3743003
2. Injection-2 3845359
3. Injection-3 3885014
4. Injection-4 3743003
5. Injection-5 3722513
6. Injection-6 3728789
Mean 3777947
Std.dev 69194.4
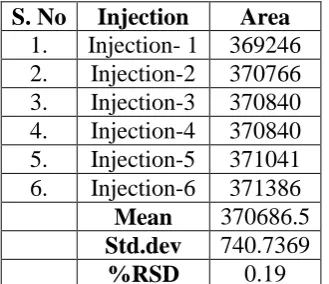
[image:7.595.218.381.467.600.2]Table No.9: Results of Intermediate precision for Teneligliptin
S. No Injection Area
1. Injection- 1 369246 2. Injection-2 370766 3. Injection-3 370840 4. Injection-4 370840 5. Injection-5 371041 6. Injection-6 371386
Mean 370686.5
Std.dev 740.7369
%RSD 0.19
Table No.10: Limit of Detection Chromatogram of Teneligliptin and Metformin
S.No Name Retention time Area s/n
1. Teneligliptin 2.090 192446.6 0.6 2. Metformin 3.202 2001752 9.7
Table No.11: Limit of Quantification Chromatogram of Teneligliptin and Metformin
S.No Name Retention time Area s/n
1. Teneligliptin 1.966 24536 2.0 2. Metformin 2.264 53443 29.4
Table No. 12: Results for Robustness
Metformin
Parameter used for sample analysis Peak Area Retention Time Theoretical plates Tailing factor Actual Flow rate of 1.0mL/min 3864998 5.289 5698 1.77 Less Flow rate of 0.9mL/min 3546737 6.746 5546 1.88 More Flow rate of 1.1mL/min 3857216 4.032 5124 1.91 Less organic phase 3810347 6.746 5034 1.88 More organic phase 3875642 4.032 5612 1.91
Table No. 13: Results for Robustness
Teneligliptin
Parameter used for sample
analysis Peak Area
Retention Time Theoretical plates Tailing factor Actual Flow rate of
1.0mL/min 372126 2.090 5587 1.70
Less Flow rate of 0.9mL/min 356765 2.736 5432 1.82 More Flow rate of
1.1mL/min 342356 1.673 5644 1.91
Table No.14: Peak results for Assay standard
Metformin
S.No Name RT Area Height USPTailing USPPlateCount
1 Metformin 5.289 3864998 231194 1.77 5628 2 Metformin 5.338 3881443 3231044 1.83 5688 3 Metformin 5.327 3896952 231969 1.86 5712
Teneligliptin
S.No Name RT Area Height USPPlateCount USP Tailing
1 Teneligliptin 2.090 348126 39690 5587 1.70 2 Teneligliptin 2.089 352564 39990 5571 1.66 3 Teneligliptin 2.089 357976 40396 5530 1.68
Table No. 15: Peak results for Assay sample
Metformin
S.No Name RT Area Height USPTTTTailingTTTailing USPPlateCount
1. Metformin 5.276 3883794 231354 1.89 5677
2. Metformin 5.268 3896493 234961 1.91 5804
3. Metformin 5.262 3900103 233541 1.95 5790
Teneligliptin
S.No Name RT Area Height USPTailing USPPlateCount
[image:9.595.65.535.277.774.2]1. Teneligliptin 2.088 352290 40269 1.69 5516 2. Teneligliptin 2.087 356547 41157 1.72 5557 3. Teneligliptin 2.085 358914 40963 1.75 5489
Figure No: 1 Teneligliptin
Figure No.3: Standard Chromatograms of Teneligliptin and Metformin
Figure No.4: Sample Chromatograms of Teneligliptin and Metformin
[image:10.595.141.454.556.743.2]Figure No.6: Linearity study of Metformin
CONCLUSION
In the present investigation, a simple, sensitive, precise and accurate RP-HPLC method was
developed for the quantitative estimation of Teneligliptin and Metformin in bulk drug and
pharmaceutical dosage forms. This method was simple, since diluted samples are directly used
without any preliminary chemical derivatisation or purification steps. Teneligliptin and
Metformin was freely soluble in ethanol, methanol and sparingly soluble in water. Methanol:
TEA Buffer pH 4.5: Acetonitrile (65:15:20) was chosen as the mobile phase. The solvent
system used in this method was economical. The %RSD values were within 2 and the method
was found to be precise. The results expressed in Tables for RP-HPLC method was promising.
The RP-HPLC method is more sensitive, accurate and precise compared to the
Spectrophotometric methods. This method can be used for the routine determination of
Teneligliptin and Metformin in bulk drug and in Pharmaceutical dosage forms.
ACKNOWLEDGEMENT
The authors are grateful to the Management of Nalanda College of Pharmacy, Nalgonda for
providing the facilities carry out the present research our work.
BIBLIOGRAPHY
1. https://en.wikipedia.org/wiki/Teneligliptin.
2. https://en.wikipedia.org/wiki/Metformin.
3. Sohan S. Chitlange, Diptee G. Rawat, SnehaChandani. Estimation of Anti-Diabetic
Teneligliptin Hydrobromide Hydrate By RP-HPLC and Derivative Spectroscopic Method
4. Chandrabatla Varaprasad, Asif Md, Ramakrishna K. RP-HPLC Method for Simultaneous
Estimation of Metformin and Linagliptin in Tablet Dosage form, 2015; 8(4): 426–432.
5. Chandana M,. PrasadRao M, Samrajyam B, Sireesha K.S.K.D, Nagapremi V.V.
Analytical Method Development And Validation of Teneligliptin In Pharmaceutical
Dosage Form By RP-HPLC Method.IJRDO-Journal of Health Sciences and Nursing,
2016; 1(12): 1-12.
6. Shrikrishna B. Baokar , Sugandha V. Mulgund , Nisharani S. Ranpise Development and
Validation of RP-HPLC Method for Simultaneous Estimation of Vildagliptin and
Metformin. J. Pharma. Dosage Forms and Tech., 2013; 5(2): 95-98.
7. Madhukar. A, Prince A, Vijaykumar, Sanjeeva R, Jagadeeshwar Y, Raghupratap KD.
Simple And Sensitive Analytical Method Development And Validation Of Metformin
Hydrochloride By Rp-Hplc.International Journal of Pharmacy and Pharmaceutical
Sciences., 2011; 3(3): 117-120.
8. Ganesh Kumar T. N. V, Vidyadhara S , Niteen Ashok Narkhede, SaiSilpa Y, Rajya
Lakshmi M. Method development, validation, and stability studies of teneligliptin by
RP-HPLC and identification of degradation products by UPLC tandem mass
spectroscopy.Journal of Analytical Science and Technology, 2016; 7: DOI
10.1186/s40543-016-0099-0.
9. AshimKumar Sen , Denish N. Hinsu, Dhanya B. Sen, Aarti S. Zanwar, Rajesh A.
Maheshwari, Vikas R. Chandrakar, Analytical method development and validation for
simultaneous estimation of Teneligliptin hydrobromide hydrate and Metformin
hydrochloride from it’s pharmaceutical dosage form by three different UV
spectrophotometric methods, Journal of Applied Pharmaceutical Science, 2016; 6(09):
157-165.
10.Validation of Analytical Procedures: Methodology, ICH Tripartite Guidelines 1996.
11.Validation of Analytical Procedures, ICH Harmonized Tripartite Guidelines, 1994.
12.ICH, Q2A Text on validation of analytical procedures, Oct, 1994.