Smart Metering for Smart Power Consumption
Mr. Mohd. Salimuddin, Mr. Devendra Kumar Pandey, Brijesh Kumar Dubey
1
Scholar, Department of Electrical & Electronics Engineering, PSIT, Kanpur, Uttar Pradesh 2, 3
Assistant Professor, Department of Electrical& Electronics Engineering, PSIT, Kanpur, Uttar Pradesh
Abstract: In recent years, the demand for electricity in households has increased with the use of various instruments. It creates a concern of many developed and developing countries with the demand for immediate increase in electricity. Consumers or people need to track their daily electricity usage in homes. In Sweden, there is a lack of energy resources during the day. Therefore, human responsibility is also important for saving and controlling these resources. This research work focuses on smart metering data to deliver electricity smartly and efficiently to consumers. The main drawback of the previously used conventional meter is that they do not provide information to consumers, which are accomplished with the help of a smart meter. A smart meter helps the consumer to know the power consumption of equipment in his respective houses. The objective of this research work is to measure and analyze power consumption by using a smart meter data by conducting case studies on different homes. In addition to saving electricity, smart meter data shows the behavior of devices in the behavior of consumers. Because the power consumption is increasing in the day because the consumption pattern should be given more attention to understanding that the consumption and analysis of consumption is required over time. In the case of developing countries, the technology to employ smart power meters is still unaware of many common people and power utilities. Therefore, there is a great need to save energy by installing these meters. Considering the behavior of consumers, reducing energy expenditure and its correlation with power spot prices have led to this research. The method used to analyze the outcome of this study has been demonstrated using case analysis, ARMMA model XLSTAT equipment and a flattening technique. Based on the valuation results provided in research, the hypothesis is achieved to change the behavior of consumers when they have better control over habits.
Keywords: Advanced Meter Infrastructure, Power consumption patterns, Smart Meters, Smart Metering, ARIMA models.
I. INTRODUCTION
In the initial phase of domestic technology, the delivery of electricity is completely dependent on conventional energy meters. These meters play an important role in measuring the consumption of electrical energy in different homes. The use of these meters is gradually decreasing with progress in technology, because rapid changes have been made to deal with problems of conventional meters. The big problem arises when residents are unaware of their daily behavior. The monthly response given to the consumers is not enough because consumers will not know how much energy the individual devices consume. Smart meters have been upgraded and developed to overcome problems of conventional electric meters. . With the use of smart meter data, energy alerts will be provided to consumers based on energy usage. The primary purpose of Smart Meter is to reduce energy consumption in households. Our thesis uses the actual meter smart meter data set obtained from the Swedish electricity company. A case study is done on hourly measurement data of 16 houses to determine the consumption pattern. Consumers' behavior can be studied and analyzed with its growing focus in the market. Energy consumption patterns can be facilitated to improve the behavior of users. With the establishment of these meters the power market can be reconstituted, as it not only preserves energy, but also reduces carbon dioxide emissions [1]. Trust and trust of these meters is established only when consumers have a positive quality of experience.
A. Motivation
B. Scope of the Thesis
This thesis work deals with hourly energy consumption values acquired from the energy provider. These standard values help energy utilities and consumers to know their energy consumption which is reported on an hourly basis. [4] In fact, behavior of the consumers can be studied and results obtained can help the consumers in changing their behavior, in particular when correlated with a potentially varying price. This work explains a gap between the consumers and energy utilities so that they can communicate more efficiently through the implementation of conservation strategies.
C. Study Prerequisites
The important prerequisites contributed in our research work are as follows:
1) The analysis of hourly measurement data of 16 households is necessitated while employing data.
2) Efficient knowledge on a calculation tool such as ―Microsoft Excel is required to execute statistical calculations while
evaluating the graphs.
II. BACKGROUND AND RELATED WORK
A. Evolution of Electricity Meters from the Past
In early years days, electricity is available only to a specific section of affluent society. The advancement in technology over time increases the encouraged meeting the demands of common people in all parts of the world. The history of electricity meter is well connected and it involves researchers from past. [5] The general usage of electricity in the early 1870‘s is only confined to telegraphs and arc lamps. With the invention of the electric bulb by Thomas Elva Edison, the power energy market became widely opened to the public in the year 1879. Oliver B. Shallenberger introduced his first AC ampere hour meter in the year 1888. Eventually, the progressive development in metering technology leads in enlightening the lives of many common people happy.
[image:2.612.194.416.390.582.2]1) Traditional Electricity Meters and Its Types: Electric appliances that can detect energy as the reading and can display them are called electric meters. Traditional meters are used in the late 19th century. They exchange data between electronic devices in computerized environments for both power generation and distribution.
Figure 2.1.2 Traditional meter
B. Smart Grid
The modern development in the smart grid power grid is. Recent electrical grids are becoming weak in relation to the electrical load variation of the equipment indoors. The increase in the population also indicates the electrical grid is getting more delicate. The higher the population, the higher the load on the grid.
C. Smart Meter
Figure 2.2 Smart Meter
D. Power Consumption
The total amount of electricity consumed in a personal house is known as power consumption. Power consumption is an important aspect of power supply. People should be aware of how to preserve energy for future use. With daily use of electricity, energy patterns are gradually changing. [7] This variation of consumption patterns can be due to the weather conditions or the unnecessary use of electricity by the residents, such as the increase in equipment in the respective houses and the careless attitude of use do not stop the lights or television for example. These factors can show more impact on the end user. Since the power supplied by energy companies is huge, most people are ignoring energy and its savings.
E. Study of People’s Behavior
People behavior is considered as behavior of consumer on appliance consumption in a household. If the consumption of the customer is more then we can say that their usage of devices is also high, which means cost is directly proportional to the product of number of uses and the corresponding durations. [8] It is important for energy companies in reaching the anticipation of the customer
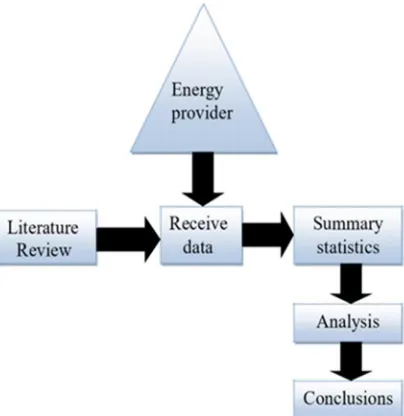
[image:3.612.150.464.474.705.2]Figure 2.7 Flow of Research Methodology
Three graphs for consumption, price-cost and cumulative cost on a particular day of a household, which are interesting for some specific reasons, are shown below. This is the first step of evaluating multiple graphs for further references
Figure 2.8 Energy Consumption, Price, Cost and Cumulative cost of household
III. DISCUSSION
With all the obtained data from the statistical analysis, the following results are implied:
A close inspection is carried out from the received data and the results confirm that the use of electricity by most homes is less during the beginning of the month and at the end of the month. Nevertheless, it strongly demonstrates the real characteristics of people's approach towards electricity. Graphs are generated to state the performance and analysis of 10 households for consumption, price-cost and cumulative cost. [9] The patterns of graphical analysis suggest consumers to serve a competitive nature among them. With the computation of price-consumption correlation results, we can observe that more negative the correlation, the lower will be the cost while as more the positive correlation higher will be the cost if hourly pricing was applied.
[image:4.612.151.455.348.529.2]IV. CONCLUSION AND FUTURE WORK
In this review work, we analyzed and interpreted different sets of consumption data of various households and their daily behavior patterns are graphed. We suggested their subjected patterns should be altered with respect to the forecasting techniques discussed in this paper. The proposed models and the study in this research can also encourage users to shift their consumption and optimize the cost constraint.
REFERENCES
[1] Benzi, N. Anglani, E. Bassi, and L. Frosini, ―Electricity Smart Meters Interfacing the Households
[2] Z. Qiu, G. Deconinck , "Smart Meter's feedback and the potential for energy savings in household sector: A survey," in IEEE International Conference on Networking, Sensing and Control (ICNSC), April 2011, pp.281-286
[3] J. Momoh, “Smart Grid Design for Efficient and Flexible Power Networks Operation and Control”, Power Systems Conference and Exposition, 2009. PSCE '09. IEEE/PES, Mar. 2009, pp. 1-8, doi:10.1109/PSCE.2009.4840074
[4] H. Farhangi“The Path of the Smart Grid”, IEEE Power &Energy Magazine, vol. 8, no. 1, Jan. 2010, pp. 18-28
[5] R. E. Brown, “Impact of Smart Grid on Distribution System Design”, Power and Energy Society General Meeting-Conversion and Delivery of Electrical Energy in the
21
st
Century,2008 IEEE, July.2008,pp.1-4,doi:10.1109.PES.2008.4596843
[6] S. N. Singh, “Electric Power Generation, Transmission and Distribution”,2nd ed. Prentice-Hall of India Private Limited, 2003. [7] Andrey and J.Morelli, “Design of a Smart Meter Techno-Economic Model for Electric
[8] K. Peter, "Smart Meter based energy management system," in 11th International Conference on Renewable Energies and Power Quality, 2011
[9] M. Mahmood, Aamir, and M. I. Anis,”Design implementation of AMR Smart Grid System,.