Abstract--- A long term prediction of future load is helpful in
better operation of power systems and its economical utilization. A number of algorithms have been suggested for solving this problem. In this paper neural networks and combined Fuzzy Logic, for long term load forecasting is proposed. In this paper the relationship between the humidity, temperature and load is identified with a case study for a particular region in Oman. The output load obtained is corrected using a correction factor from neural networks, which depends on the previous set of loads, number of customers etc. The data is taken for the three years and the results are obtained for the fourth year. It is further validated using the actual data from an electrical company.
Index Terms--- Neural Network, Fuzzy Logic, Load
Forecasting. Fuzzy Modeling, Energy consumption.
I. INTRODUCTION
oad forecasting has been an integral part in the efficient planning, operation and maintenance of a power system. Short term load forecasting is necessary for the control and scheduling operations of a power system and also acts as inputs to the power analysis functions such as load flow and contingency analysis.[1] Owing to this importance, various methods have been reported, that includes linear regression, exponential smoothing, stochastic process, ARMA models, and data mining models. [2] Of late, artificial neural networks have been widely employed for load forecasting. However, there exist large forecast errors using ANN when there are rapid fluctuations in load and temperatures. In such cases, forecasting methods using fuzzy logic approach have been employed. [3] In this paper, an approach for long term load forecasting problem, using fuzzy logic combined with ANN approach is proposed. The fuzzy logic technique has been used to classify the data's. The neural network is used to calculate the increment factor of load due to other parameters like growth in industries, increase in number of customers etc.
II. FUZZY SYSTEM
The fuzzy logic model maps the highly non-linear relationship between the weather parameters and their impact on the daily electric load peak. Here fuzzy logic model has two inputs temperature and humidity and one output load. These factors temperature, humidity has direct impact on the electric load peak. In the research it is hypothesized the temperature has the biggest impact.
Manuscript Received: March 20, 2012. Swaroop is with Department of Electrical and Computer Engineering, College of Engineering, University of Nizwa, Sultanate of Oman. P.B.33, P.C.616. ([email protected]). Hussein Ali Al Abdulqader is with the Department of Electrical and Computer Engineering, University of Nizwa, Sultanate of Oman. ([email protected]).
The first input to the Fuzzy logic module is temperature which have four membership functions (MF) and these membership functions overlap using triangular shapes to cover all possible range of temperatures.
The shape of membership functions and the degree of overlap were chosen by trial and error. The second input to the FL module is humidity which is classified into three membership functions.
III. NEURO-FUZZY MODEL
In the area of fuzzy- neural collaborations, several forms have surfaced, including fuzzy reprocessing of neural network inputs, fuzzy post- processing of neural network outputs, integrated fuzzy-neural networks and parallel fuzzy neural forecasters. Depending on the fuzzy-neural model, the selection of input/output variables and the amount of data used, forecasting errors can be very low range. Fuzzy logic and neural networks are complementary technologies in the design of intelligent systems. Each method has merits and demerits.[4] Neural networks are essentially low-level computational structures and algorithms that offer good performance in dealing with sensory data. On the other hand, fuzzy logic techniques often deal with issues, such as reasoning, on a higher level than neural networks. However, since fuzzy systems do not have much learning capability, it is difficult for a human operator to tune the fuzzy rules and membership functions from the training data set. Also, because the internal layers of neural networks are always opaque to the user, the mapping rules in the network are not visible and are difficult to understand. Furthermore, the convergence of learning is usually very slow and not guaranteed.[8] Thus, a promising approach for getting the benefits of both the fuzzy systems and neural networks is to merge them in to an integrated system. This collaboration posses the advantage of both neural networks and fuzzy systems.[10] Each of these modules applied to the aspect of the problem for which it is best suited in order to produce better overall forecasting results.[9,11] The variation of the temperature variable results in a significant variation in the load. Load demand always increases as the temperature increases demand decreases as the humidity increases.
IV. METHODOLOGY
The Figure 1 shows the block diagram representation of the proposed paper. Here two parameters are considered one is the temperature and the other is the humidity. In this project the humidity and the temperature data is fed to the fuzzy logic system and the output is the load proportional to these two parameters. This is further fed to the neural networks for training and comparing the set of past load to predict the future. This is done because the load not just depends on the temperature and humidity but also depends on the other
Swaroop R,
Member
IAENG
Hussein Ali Al Abdulqader
Load Forecasting for Power System Planning
using Fuzzy-Neural Networks
data's like number of customers increase in the city and also various other environmental factors.
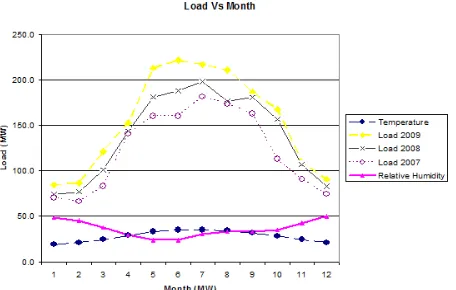
The figure 2 shows the variation of load for the year 2008, 2009 and 2010 for a particular region (Al Dhakhlia region) in Oman. It also gives the variation of temperature and humidity at the bottom.
To make a detailed analysis figure 3 shows that the load increase linearly with the increase in temperature and the figure 4 shows that the load decreases with increase in humidity. Hence it is clear that the maximum temperature has low humidity and hence the load is maximum. It has also been observed that the minimum temperature has maximum humidity and the load is minimum. There is an intersection point as where the load is medium. These data's are fed to the Fuzzy system for classifying the data and to get the output.
A. Fuzzification of Input and the Outputs
In this paper the load is classified as very Low, Low, Medium and High Load. It is seen from the figure 5 and 6 that the load falls between 50 and 250 MW. From the graph
it is clearly seen that the data can be classified as (50-100), (100-150), (150-200) and (200-250). The corresponding
temperature and humidity can be seen from the x-axis, which are used to classify the humidity and temperature ranges for fuzzification.
[image:2.595.322.536.62.209.2] [image:2.595.49.250.95.171.2]The Table I below shows how the temperature and humidity Fig.1. Block Diagram Representation
[image:2.595.56.284.268.413.2]Fig. 2. Load Vs Temperature, Humidity and Load Curve
Fig. 3.Load Vs Temperature
[image:2.595.321.536.307.454.2]Fig. 4. Load Vs Humidity
[image:2.595.319.535.528.698.2]Fig. 5. Load Vs Temperature
[image:2.595.57.275.606.751.2]various classification of load the corresponding temperature and humidity are taken. Then the ranges of fuzzification are obtained as shown in the second part of the table.
The figure 7 and 8 shows how the inputs are classified for fuzzification. It is observed that the temperatures are classified with the ranges (20-24), (23-27), (26-32), (31-40) as Very Low, Low, Medium and high respectively. The humidity is classified as (20-33), (30-42), (40-50) as Low, Medium and High respectively. The outputs are classified as
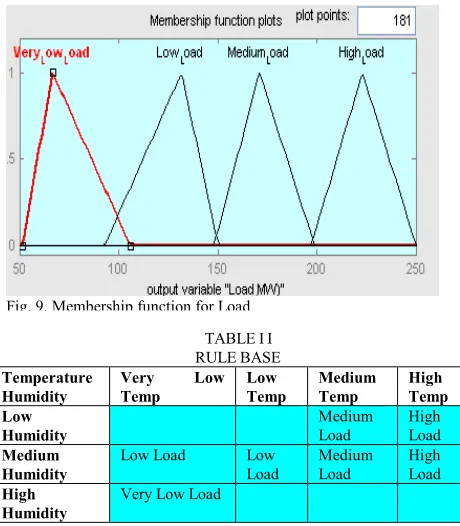
(50-110), (100-160), (150-200), and (200-250) as Very Low, Low, Medium and High Loads respectively as shown in figure 9.
The table II shows the rule base for mapping various ranges of inputs to the outputs.
The figure 10 shows the Simulink used to simulate the inputs
and to get the outputs. It is observed from the simulation that for a temperature of 340C and 33% relative humidity the load is 223MW.
The figure 11 shows how the fuzzy system in MATLAB toolbox which works for the sample inputs.
TABLEI
CLASSIFICATION OF TEMPERATURE, HUMIDITY WITH RESPECT TO THE LOAD FOR FUZZIFICATION AND
DEFUZZIFICATION.
Load 50-100
100-150
150-200 200-250
Temperature 19.2,20.7, 20.9
24.3, 24.1
28.8, 32, 28.3
32.8, 35, 35.2, 34.4
Humidity 48.4, 45,
49.7
37.7, 29.4, 42.4
34.8, 33, 29.4
23.9, 23.4, 30.4, 33.3 Ranges for Fuzzification
Classification Very Low
Low Medium High
Temperature 19-21 24-27 28-32 32-36
[image:3.595.310.540.67.330.2]Humidity 45-50 30-42 23-33
[image:3.595.43.254.363.514.2]Fig. 8. Membership function for Temperature Fig. 7. Membership function for Relative Humidity
Fig. 9. Membership function for Load TABLEII RULEBASE Temperature
Humidity
Very Low
Temp
Low Temp
Medium Temp
High Temp Low
Humidity
Medium Load
High Load Medium
Humidity
Low Load Low Load
Medium Load
High Load High
Humidity
[image:3.595.323.516.405.516.2]Very Low Load
[image:3.595.41.261.590.743.2]Fig. 10. Simulation of Data using Simulink
[image:3.595.318.530.612.754.2]It can also be also observed from the figure 11 that for a temperature of 340C and 33% relative humidity gives an output of 223MW load. For example it is seen that the high temperature and low humidity gives an output of high load, similarly for low temperature and high humidity the output is Very Low Load. This can be cross checked with the actual load in table III which shows that the load is 210MW which
is very close to the actual value..
B. Neural Network for correction Factor
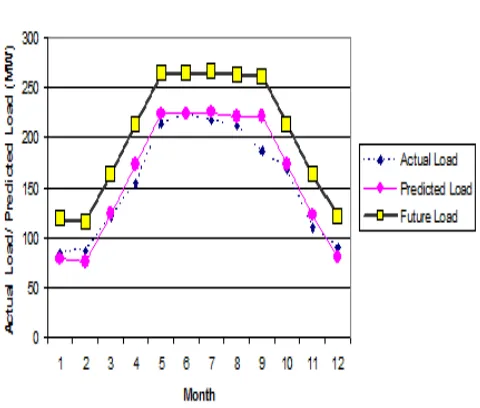
For Multilayer perceptron networks, training is normally achieved through back-propagation learning. Supervised learning involves comparing the output of a network exposed to specific input with the desired output and changing the weights of the network to achieve a proper mapping. [5] This is done by first stimulating the input nodes with a specific pattern and letting the network propagate this input through the layers. The output of the network is then compared to the desired output (i.e. the output expected for that particular input pattern).[7]The error is then back-propagated through the network, changing the internal weights along the way to produce a better match between the network predictions and the `real’ data. To facilitate this process a number of techniques can be used which include the delta-rule method.[6] Once the approximate load is obtained it has to be corrected using a correction factor which depends on the number of industries over the area and also the number of houses built and increase in the customers. Here back propagation algorithm is used to compare the previous set of data to correct the load for future. It is also validated using the actual data available from the Mazoon Electrical Company. The figure 12 represents the actual load for 2010, predicted load for 2010 using fuzzy system and the predicted future load for 2012 using neural networks.
V. CONCLUSION
In this paper a methodology for long term load forecasting using Neuro-Fuzzy approach is presented. A new temperature and humidity relation ship with load is obtained using mamdani fuzzy logic system. The Fuzzy Logic system is used to obtain the variation of load and a correction factor is derived from an artificial neural network back propagation algorithm to predict the future load. It has been observed that the variation of predicted load from actual load has an average percentage error of 7.8%.
REFERENCES
[1]. E. Srinivas, Amit Jain "A Methodology for Short Term Load Forecasting Using Fuzzy Logic and Similarity" The National Conference on Advances in Computational Intelligence Applications in Power, Control, Signal Processing and Telecommunications
(NCACI-2009), Bhubaneswar, India, March 20-22, 2009.
[2]. Gaddam.mallesham; A.N.Jha, "A Fine Load Forecasting using Neural Networks and Fuzzy Neural Networks", Int. Conf. on Power Systems and Electromagnetic Compatibility, Corfu, Greece, August 23-25, 2005 (pp224-229)
[3]. Jagadish H. Pujar, Fuzzy Ideology based Long Term Load Forecasting, World Academy of Science, Engineering and Technology 64 2010
[4]. K. Metaxiotis, A. Kagiannas, D. Askounis, J. Psarras, “Artificial intelligence in short term electric load forecasting: a state-of-the-art survey for the research”, Energy Conversion and Management 44, 2003, pp.1525-1534.
[5]. Tomonoobu senjyu, hitoshi takara,katsumi ueezato,toshihisa funabashi, “One-hour ahead load forecasting using neural network”,
IEEE Trans. power syst., vol.17, no.1, February 2002, pp.113-118. [6]. Mohsen Hayati, Yazdan Shirvany, “Artificial neural network
approach for short term load forecasting for Illam region”,
International journal of electrical, computer, and system engineering, vol.1, no.2, pp.121-125.
[7]. G.A.Adepoju, S.O.A.ogaunjuyigbe, and K.O.Alawode, “Application of neural network to load forecasting in nigerian electrical power system”, The pacific journal of science and technology, vol.8, no.1, May 2007, pp.68-72.
[8]. Bhavesh kumar chauha, amit sharma, and m.hanmandlu, “Neuro-fuzzy approach based short term electric load forecasting”, 2005
IEEE/PES Transmission and Distribution Conference & Exhibition, Asia and Pacific Dalian, China.
[9]. Swaroop.R, Hussein Ali Al Abdulqader, A Case study on Load Forecasting for power system planning and operation in Al Batinah Region in Oman using Neural Networks,. Journal of Engineering
TABLEIII
TEPERATURE,HUMIDITYVSACTUAL/PREDICTEDLOAD
Tempera -ture
Relative Humidity
Predicted
Load Actual Load %Error Future Load (After ANN)
19.2 48.4% 78 84.35 7.50 128.85
20.7 45.0% 75 86.8 13.50 131.3
24.3 37.7% 123 120.65 1.95 165.15
28.8 29.4% 172 152.8 12.57 197.3 32.8 23.9% 223 213.15 4.62 257.65 35.0 23.4% 223 221.775 0.55 266.27
35.2 30.4% 224 216.7 3.37 261.2
34.4 33.1% 221 210.7 4.89 255.2
32.0 33.0% 220 186.4 18.03 230.9
28.3 34.8% 173 167.8 3.10 212.3
24.1 42.4% 122 109.15 11.77 153.65
20.9 49.7% 80 90.8 11.80 135.3
Average
[image:4.595.309.549.73.277.2]% Error 7.80
[image:4.595.42.289.165.413.2]Science and Technology (JESTEC). (Accepted and will be published in August 2012, Volume 7, Issue 4)
[10]. Cuiru wang, Zhikun cui , Qi chen, “Short term load forecasting based on fuzzy neural network”, Intelligent Information Technology Application, Workshop on 2-3 Dec. 2007, pp:335 – 338.