Abstract— Promise of actually realizing and delivering the
unanimously committed quality of service (QoS) is a big challenge, given the explosive growth in usage of real-time based multimedia applications online. The queuing strategies do critically affect the bandwidth allocation of packets while making critical selection for packets to be dropped. This also have an effect on latency. Resource Reservation Protocol (RSVP) in concurrence with weighted fair queuing (WFQ) attempts to accomplish bandwidth reservation with intention to predetermine and guarantee of improved QoS. At peak traffic with impending congestion, this scheme fails to cap different QoS parameters within premeditated limits. We propose an innovative solution by combining priority queuing scheme with RSVP instead of WFQ. Using Kohonen’s Self Organizing Map (SOM) & K-Means clustering techniques as analysis tool, we come across that this strategy allows us to sustain a better quality of service for extremely high precedence real-time video traffic. We are further able to demonstrate that the delegated QoS by this strategy is immune to different firewall implementation schemes, across the network.
Index Terms—Self Organizing Map, K-Means, weighted fair
queuing, resource reservation protocol, principal component analysis.
I. INTRODUCTION
HE expectations from real-time based video applications have increased exponentially over the course of time. Different attributes like ftp, http, upload & download response time play significant part in success of these online applications. Application performance has on the large lagged to keep pace with user expectations. This all transcend down to QoS parameters. Discrete assessment and evaluation of application response time, media access delay, latency, jitter; packet loss, retransmission, throughput, congestion & queuing delay and
Manuscript received May 22, 2012; revised July 30, 2012.
Hartinder Singh Johal is working as Associate Professor at School of Computing & Information Technology, Lovely Professional University, Phagwara 144022, India (+919988231936; [email protected])
Balraj Singh is Working as Assistant Professor at School of Computer Science, Lovely Professional University, Phagwara 144022, India (+919779147567; [email protected])
Harwant Singh is Working as Assistant Professor at School of Computer Enginerring, Lovely Professional University, Phagwara 144022, India (+919888508412; [email protected])
Amandeep Nagpal is working as Associate Professor at School of Computer Engineering, Lovely Professional University, Phagwara 144022, India (+919878649550; [email protected])
Harjot Singh Virdi is graduate student at School of Computer Science, Lovely Professional University, Phagwara 144022, India.
network utilization generate considerable impact on the ultimately delivered experience. Efficient resource allocation is the key if we deem to make an estimate about how the buffering of packets must happen while awaiting transmission. The queuing strategies do critically affect the bandwidth allocation of packets while making critical selection for packets to be dropped [1]. RSVP strategy when used in conjunction with different queuing schemes allows multimedia based real-time data transfer to identify & set aside the resources required for making realistic assumptions about latency accumulations [2]. RSVP works in tandem with WFQ by assigning weights to every transfer queue which in turn quantifies the proportion of bandwidth for those queues. We start with assessing the effect of realizing different queuing profiles on utilization, throughput, queuing & end to end delay for voice and video. Subsequent to this we apply queuing disciplines with RSVP & record observations about different QoS parameters. We use Kohonen’s Self Organizing Map (SOM) to visualize the effects of different queuing strategies mutually exclusively & with RSVP [3]. Visualization is used to better predict & analyze the traffic patterns generated by discretely capturing the nonlinear attributes of the traffic flow. Along with this physical meaning of clusters is explored with reflection on evolving vectors of traffic flow [4]. Subsequently we perform comparison of the results with Principal Component Analysis (PCA) algorithm & with K-Means [5]. Eventually we realize the amalgamation of SOM with Hierarchical Agglomerative Clustering (HAC) to further justify the results.
II. EXPERIMENTAL SETUP
We use network structure in fig 1, for mutually exclusive application of WFQ, PQ, PQ with RSVP & WFQ with RSVP. The scenario consists of extending different voice; video & ftp applications to end users. We apply WFQ, PQ, PQ with RSVP & WFQ with RSVP one after another & assess what affect it has on these applications concurrent to network utilization and throughput. We employ token bucket rate as measurement for flow. In this method once the choice about diverse resources to be reserved has been achieved the protocol invokes different modules for setup of reservation. We record the dataset encompassing observations about average end to end delay for video conferencing & voice, average point to point queuing delay, throughput & utilization. For implementing WFQ based RSVP with firewall & PQ based RSVP with firewall we use net map in fig 2, for generating corresponding observations.
Using Kohonen-SOM & K-Means Clustering
Techniques to Analyze QoS Parameters of
RSVP
Hartinder Singh Johal, Balraj Singh, Harwant Singh, Amandeep Nagpal and Harjot Singh Virdi
Fig 1. Net-map for Queuing Profiles Application with RSVP. We record data for following attributes:
PQ: PQ Profile without RSVP & Firewall. WFQ: WFQ Profile without RSVP & Firewall PQ/RSP: PQ profile with RSVP
WFQ/RSP: WFQ profile with RSVP PQ/RSP/FW: PQ/RSVP with Firewall WFQ/RSP/FW: WFQ/RSVP with Firewall
Fig 2. Net-map for Queuing Profiles Application with Firewall.
III. METHODOLOGY
For analysis an artificial neural network based self organizing map is used to generate a primitive level of discrete representation of different QoS parameters from training set [6]. It helps us in grouping data into clusters which can be further introspected for eventual analysis [7]. When achieving clustering with Kohonen-SOM the precondition is that at least one input attribute in data set (V1, V2, V3,…Vn ) must have continuous distribution. On
successful realization of this technique, a new attribute is added to the data set which encompasses the cluster information. Best fit unit is arrived by
[9]. Similar for K-Means at least one input attribute must have continuous distribution & it involves portioning n recordings (x1, x2, x3,..xn, each being d-dimensional vector)
into different k sets (S1, S2, S3, ….Sk) for k ≤ n. The objective
is to minimize the within cluster sum of squares (WSS). Subsequently we make efforts to perform comparison analysis with Principal Component Analysis (PCA) technique [10]. To get hold of best cluster size we use Hierarchical Agglomerative Clustering (HCA) to further justify our findings.
IV. RESULTS
We generate Univariate statistics for average end to end delay for video conferencing, voice communication, point to point queuing delay, point to point throughput & point to point utilization. For all datasets there are 6 descriptors with 41 instances. All the variables are in continuous distribution & hence qualify for operation of Kohonen-SOM algorithm. After computing continuous statistics we encounter that the dataset is free from constants & all variables are precisely defined on common scale.
TABLEI
UNIVARIATESTATISTICS FOR AVERAGE END TO END DELAY (SEC) FOR
VIDEO CONFERENCING
Attribute Min Max Average Std-dev Std-dev/avg
PQ 0.146869 0.347665 0.3212 0.0416 0.1295 WFQ 0.149548 3.28567 1.6891 0.9544 0.5650 PQ/RSP 0.148653 0.640598 0.5624 0.1181 0.2099 WFQ/RSP 0.149548 3.28567 1.6891 0.9544 0.5650 PQ/RSP/FW 0.383232 16.3513 8.3012 4.8140 0.5799 WFQ/RSP/FW 0.149548 3.27347 1.6868 0.9502 0.5633
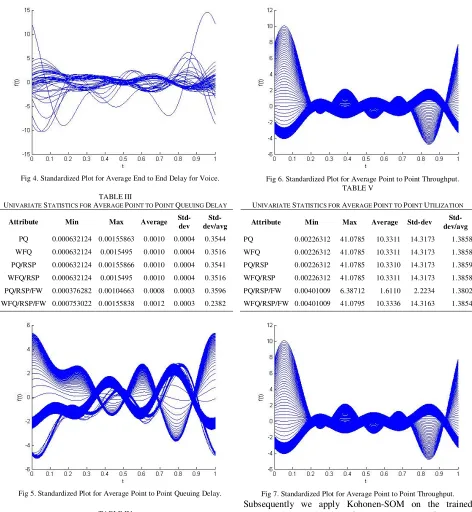
Fig 3. Standardized Plot for Average End to End Delay for Video. TABLEII
UNIVARIATE STATISTICS FOR AVERAGE END TO END DELAY (SEC) FOR
VOICE COMMUNICATION
Attribute Min Max Average Std-dev
Std-dev/avg
PQ 0.00439167 0.00442628 0.0044 0.0000 0.0021 WFQ 0.00438368 0.00441336 0.0044 0.0000 0.0009
FTP User
Video User
VOIP User
Server FTP
Server Video
Server VOIP
Server Router
Client Router
Joining Router
ISP
Web Server
FTP User
Video User
VOIP User
Server FTP
Server Video
Server VOIP
Server Router
Client Router
Joining Router
ISP
Fig 4. Standardized Plot for Average End to End Delay for Voice.
TABLEIII
UNIVARIATE STATISTICS FOR AVERAGE POINT TO POINT QUEUING DELAY
Attribute Min Max Average Std-dev
Std-dev/avg
[image:3.612.69.541.51.563.2]PQ 0.000632124 0.00155863 0.0010 0.0004 0.3544 WFQ 0.000632124 0.0015495 0.0010 0.0004 0.3516 PQ/RSP 0.000632124 0.00155866 0.0010 0.0004 0.3541 WFQ/RSP 0.000632124 0.0015495 0.0010 0.0004 0.3516 PQ/RSP/FW 0.000376282 0.00104663 0.0008 0.0003 0.3596 WFQ/RSP/FW 0.000753022 0.00155838 0.0012 0.0003 0.2382
Fig 5. Standardized Plot for Average Point to Point Queuing Delay.
TABLEIV
UNIVARIATE STATISTICS FOR AVERAGE POINT TO POINT THROUGHPUT
Attribute Min Max Average Std-dev Std-dev/avg
PQ 0.0287356 254.332 63.9997 88.6374 1.3850 WFQ 0.0287356 255.896 64.3972 89.1948 1.3851 PQ/RSP 0.0287356 254.326 63.9391 88.5829 1.3854 WFQ/RSP 0.0287356 255.896 64.3972 89.1948 1.3851 PQ/RSP/FW 0.0383142 205.398 51.6933 71.5641 1.3844 WFQ/RSP/FW 0.0383142 255.43 64.3565 89.0874 1.3843
Fig 6. Standardized Plot for Average Point to Point Throughput. TABLEV
UNIVARIATE STATISTICS FOR AVERAGE POINT TO POINT UTILIZATION
Attribute Min Max Average Std-dev Std-dev/avg
[image:3.612.318.535.263.540.2]PQ 0.00226312 41.0785 10.3311 14.3173 1.3858 WFQ 0.00226312 41.0785 10.3311 14.3173 1.3858 PQ/RSP 0.00226312 41.0785 10.3310 14.3173 1.3859 WFQ/RSP 0.00226312 41.0785 10.3311 14.3173 1.3858 PQ/RSP/FW 0.00401009 6.38712 1.6110 2.2234 1.3802 WFQ/RSP/FW 0.00401009 41.0795 10.3336 14.3163 1.3854
Fig 7. Standardized Plot for Average Point to Point Throughput.
Subsequently we apply Kohonen-SOM on the trained dataset using a grid size of 2 & 3 with classification of instances into 6 groups (clusters). The learning rate is 0.20 with standard seed generator we observe following record. The data is standardized by division of each variable by their standard deviation.
TABLEVI
MAPTOPOLOGY –AVERAGE VIDEO DELAY
1 2 3 1 12 4 3
TABLEVII
MAPTOPOLOGY –AVERAGE VOICE DELAY
1 2 3 1 0 0 0
2 41 0 0 TABLEVIII
MAPTOPOLOGY –QUEUING DELAY
1 2 3 1 25 12 1
2 0 3 56 TABLEXI
MAPTOPOLOGY -THROUGHPUT
1 2 3 1 8 8 3
2 13 7 58 \
TABLEX MAP TOPOLOGY -UTILIZATION
1 2 3 1 8 7 57
2 14 8 3 TABLE XI
NUMBER OF INSTANCES IN EACH CLUSTER –VIDEO DELAY
Attribute n°1 n°2 n°3 n°4 n°5 n°6
PQ: 0.307169 0.332701 0.197014 0.339538 0.346099 0.343106
WFQ: 0.767492 1.391036 0.214426 1.794713 2.895606 2.243338 PQ/RSVP: 0.512892 0.598909 0.220326 0.616879 0.636727 0.628506
WFQ/RSVP: 0.767492 1.391036 0.214426 1.794713 2.895606 2.243338
PQ/RSVP/FW: 3.665622 6.881338 0.723996 8.897137 14.337231 11.114409
WFQ/RSVP/FW: 0.767517 1.393029 0.214426 1.798952 2.883873 2.243455
n* clusters
TABLEXII
NUMBER OF INSTANCES IN EACH CLUSTER –VOICE DELAY
Attribute n°1 n°2 n°3 n°4 n°5 n°6
PQ -99999 -99999 -99999 0.004419 -99999 -99999 WFQ -99999 -99999 -99999 0.004393 -99999 -99999 PQ/RSP -99999 -99999 -99999 0.004426 -99999 -99999 WFQ/RSP -99999 -99999 -99999 0.004393 -99999 -99999 PQ/RSVP/FW -99999 -99999 -99999 0.000696 -99999 -99999 WFQ/RSP/FW -99999 -99999 -99999 0.004397 -99999 -99999
n* clusters
TABLEXIII
NUMBER OF INSTANCES IN EACH CLUSTER –QUEUING DELAY
Attribute n°1 n°2 n°3 n°4 n°5 n°6
PQ .001533 .001417 .000993 -99999 .001192 .000741 WFQ .001524 .001410 .000992 -99999 .001189 .000741 PQ/RSP .001534 .001419 .000993 -99999 .001192 .000742 WFQ/RSP .001524 .001410 .000992 -99999 .001189 .000741 PQ/RSP/FW .000405 .000527 .000899 -99999 .000737 .000970 WFQ/RSP/FW .001535 .001441 .001159 -99999 .001282 .000963
n* clusters
TABLEXIV
NUMBER OF INSTANCES IN EACH CLUSTER -THROUGHPUT
Attribute n°1 n°2 n°3 n°4 n°5 n°6
PQ 181.06 133.92 36.58 230.18 79.66 0.4859 WFQ 182.20 134.77 36.75 231.63 80.13 0.4876 PQ/RSP 180.90 133.61 36.55 230.12 79.51 0.4839 WFQ/RSP 182.20 134.77 36.75 231.63 80.13 0.4876 PQ/RSP/FW 146.20 108.14 29.50 185.88 64.30 0.4192 WFQ/RSP/FW 182.07 134.75 36.76 231.31 80.14 0.5090
n* clusters
TABLEXV
NUMBER OF INSTANCES IN EACH CLUSTER -UTILIZATION
Attribute n°1 n°2 n°3 n°4 n°5 n°6
PQ 28.36 11.53 0.024 36.81 20.55 4.356 WFQ 28.36 11.53 0.024 36.81 20.55 4.356 PQ/RSP 28.36 11.53 0.024 36.81 20.55 4.356 WFQ/RSP 28.36 11.53 0.024 36.81 20.55 4.356 PQ/RSP/FW 4.412 1.796 0.010 5.724 3.198 0.6842 WFQ/RSP/FW 28.37 11.53 0.028 36.81 20.56 4.357 n* clusters
Applying K-Means clustering approach for 6 clusters & 10 maximum iterations with 5 trials we observe following cluster size with WSS.
TABLEXVI
CLUSTER SIZE &WSS–VIDEO DELAY
Cluster Description Size WSS
cluster n°1 c_kmeans_1 5 1.8420 cluster n°2 c_kmeans_2 11 3.0898 cluster n°3 c_kmeans_3 9 1.7600 cluster n°4 c_kmeans_4 6 0.7075 cluster n°5 c_kmeans_5 3 3.6356 cluster n°6 c_kmeans_6 7 0.8780
TABLEXVII
CLUSTER SIZE &WSS–VOICE DELAY
Cluster Description Size WSS
cluster n°1 c_kmeans_1 5 2.3632 cluster n°2 c_kmeans_2 14 4.6022 cluster n°3 c_kmeans_3 9 1.7048 cluster n°4 c_kmeans_4 1 0.0000 cluster n°5 c_kmeans_5 3 6.2459 cluster n°6 c_kmeans_6 9 5.4025
TABLEXVIII
CLUSTER SIZE &WSS–QUEUING DELAY
Cluster Description Size WSS
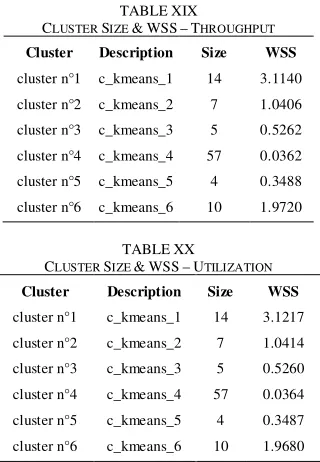
TABLEXIX
CLUSTER SIZE &WSS–THROUGHPUT
Cluster Description Size WSS
cluster n°1 c_kmeans_1 14 3.1140 cluster n°2 c_kmeans_2 7 1.0406 cluster n°3 c_kmeans_3 5 0.5262 cluster n°4 c_kmeans_4 57 0.0362 cluster n°5 c_kmeans_5 4 0.3488 cluster n°6 c_kmeans_6 10 1.9720
TABLEXX
CLUSTER SIZE &WSS–UTILIZATION
Cluster Description Size WSS
cluster n°1 c_kmeans_1 14 3.1217 cluster n°2 c_kmeans_2 7 1.0414 cluster n°3 c_kmeans_3 5 0.5260 cluster n°4 c_kmeans_4 57 0.0364 cluster n°5 c_kmeans_5 4 0.3487 cluster n°6 c_kmeans_6 10 1.9680
Further using Hierarchical Clustering Approach (HCA) we record the best cluster [11].
TABLEXXI
BEST CLUSTER SELECTION –VIDEO DELAY
Clusters BSS ratio Gap
1 0.0000 0.0000
2 0.6189 2.8412
3 0.7643 0.0923
4 0.8944 0.6411
5 0.9175 0.0931
6 0.9252 0.0460
TABLEXXII
BEST CLUSTER SELECTION –VOICE DELAY
Clusters BSS ratio Gap
1 0.0000 0.0000
2 0.3576 0.0191
3 0.7121 1.3689
4 0.8384 0.4567
5 0.8886 0.1613
6 0.9118 0.0199
TABLEXXIII
BEST CLUSTER SELECTION –QUEUING DELAY
Clusters BSS ratio Gap
1 0.0000 0.0000
2 0.8887 4.9762
3 0.9480 0.1606
4 0.9806 0.1365
5 0.9904 0.0445
6 0.9928 0.0006
TABLEXXIV
BEST CLUSTER SELECTION –THROUGHPUT
Clusters BSS ratio Gap
1 0.0000 0.0000
2 0.8306 4.3694
3 0.9329 0.3792
4 0.9720 0.1640
5 0.9838 0.0413
6 0.9887 0.0295
TABLEXXV
BEST CLUSTER SELECTION –UTILIZATION
Clusters BSS ratio Gap
1 0.0000 0.0000
2 0.8739 4.8959
3 0.9318 0.1038
4 0.9724 0.1693
5 0.9848 0.0582
6 0.9876 0.0163
Fig 8. Dendrogram for Average End to End Delay (sec) for Video.
[image:5.612.105.265.64.295.2]Fig 9. Dendrogram for Average End to End Delay (sec) for Voice.
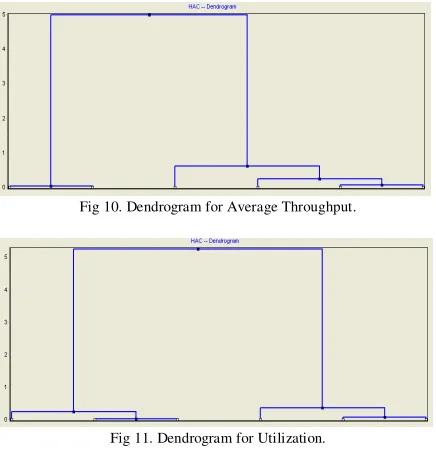
[image:5.612.316.557.76.678.2]Fig 10. Dendrogram for Average Throughput.
Fig 11. Dendrogram for Utilization.
V. DISCUSSION
After reviewing univariate statistics for video conferencing, voice, queuing delay, throughput & utilization we observe that combination of PQ with RSVP gives the best result. Mean delay in case of PQ is least for video & if we combine it with RSVP we are further able to add to its performance. Further standard deviation is lowest in case of PQ. While analyzing Kohonen-SOM statistics for end to end video delay we observe number of instances for PQ/RSP cluster is the least as compared with WQ/RSP. Firewall based PQ/RSP shows better performance than Firewall based WQ/RSP strategy. In case of queuing delay observations, we come across that PQ/RSP/FW combination has marked better results than WFQ/RSP/FW combination. In case of end to end delay for video conferencing, we observe that 88.11% of total sum of squares (TSS) is encompassed over 6 classes. When we compare it using Principle Component Analysis (PCA) we encounter that PQ & WFQ accounts for 99.78% of variability [12].
From KMeans statistics for video conferencing we observe that the qualified part of the TSS comprehended by the partitioning is 95.157%. There is some discreet variation with SOM which is at 88.11%. The delay in case of PQ is the least which is closely followed by WFQ. Comparison of Kohonen-SOM & K-Means demonstrates that PQ with RSVP will be better able to capture the video delay within acceptable limits. For voice communication TSS for Kohonen-SOM is -167.13% with PCA value of 92.28% while K-Means statistics for voice stand at 91.74%. Hence for voice there is large relative predication error & hence we are unable to state with confidence about the voice communication outcomes with PQ/RSP/FW method. For Queuing delay the TSS for Kohonen-SOM is 93.77% with PCA value of 99.95% while K-Means statistics for same stands out at 99.10%. The variation is less when compared with video conferencing case. In case of throughput TSS value for Kohonen-SOM is 98.45% with PCA for PQ is 100%. KMeans statistics for same is 98.79%,
hence our analysis shows better agreement for utilization factor. K-Means cluster size & WSS statistics demonstrates that for PQ based RSVP scheme the queuing delay is 0 which clearly reflects that this scheme is efficient as compared to WFQ based RSVP.
VI. CONCLUSION
Our analysis reflects that on the large for most of QoS parameters, PQ combination with RSVP is better able to address the requirements. We used Kohonen-SOM & K-Means clustering techniques to quantify the agreement between results for voice & video delay along with queuing delay, throughput and utilization. We used principle component analysis & hierarchical clustering approach to better visualize the expectations from different queuing disciplines along with RSVP. The experimental setup and strategy presented is competent enough to ratify the conclusion even under firewall implementations.
REFERENCES
[1] R. Balmer, F. Baumgarter, and T. Braun, “A concept for RSVP over diffserv,” in Proc. Nineth ICCCN’2000, (Las Vagas, NV), October 2000.
[2] T. Chahed, G. Hebuterne, and C. Fayet, “On mapping of QoS
between Integrated services and Differentiated services,” in
International Workshop on Quality of Service, pp. 173–175, (Pittsburgh), June 5-7, 2000.
[3] Cox, T.F., Cox, M.A.A.: Multidimensional Scaling. Monographs on Statistics and Applied Probability. Chapman & Hall (1995). [4] Jolliffe, I.T., Principal Component Analysis. Springer Verlag (1986). [5] Zanero, S., Improving self organizing map performance for network
intrusion detection, In: SDM 2005 Workshop on “Clustering High Dimensional Data and its Applications”, submitted for publication. (2004).
[6] Yamanishi, K., Jichi Takeuchi, J., Williams, G.J., Milne, P, On-line unsupervised outlier detection using finite mixtures with discounting learning algorithms. In: Proc. of the 6th ACM SIGKDD Int’l Conf. on Knowledge Discovery and Data Mining. (2000) 320–324. [7] Bandyopadhyay S., Giannella C., Maulik U., Kargupta H., Liu K.,
and Datta S. Clustering Distributed Data Streams in Peer-to-Peer Environments. Information Sciences (in press), 2005.
[8] Han J. and Kamber M. Data Mining, Concepts and Techniques. Morgan Kaufman Publishers, San Francisco, CA, 2001.
[9] S. Haykin, “Neural Networks: A comprehensive Foundation”, Prentice- Hall, USA, 2nd edit.
[10] A. Ultsch, “Data Mining and Knowledge Discovery with Emergent
SOFMs for Multivariate Time Series”, In Kohonen Maps, (1999), pp.
33-46.
[11] A. Ultsch, “Maps for Visualization of High-Dimensional Data
Spaces”, Proc. WSOM, Kyushu, Japan, (2003), pp. 225-230.
[12] Wolff R. and Schuster A, Association Rule Mining in Peer-to-Peer Systems. IEEE Transactions on Systems, Man and Cybernetics - Part B, 34(6):2426–2438, 2004.
[13] P. Tamayo, D. Slonim, J. Mesirov, Q. Zhu, S. Kitareewan, E. Dmitrovsky, E. Lander, and T. Golub. “Interpreting patterns of gene expression with self-organizing maps: Methods and application to
hematopoietic differentiation”, Proceedings of the National Academy
of Science, 1999.
[14] J. MacQueen, “Some methods for classification and analysis of
multivariate observations”, In L. M. Le Cam and J. Neyman, editors,
Proceedings of the Fifth Berkeley Symposium on Mathematical Statistics and Probability, Berkeley, CA, 1967. University of California Press.
[15] P. Demartines and J. Herault, “Curvilinear component analysis: A self-organizing neural network for nonlinear mapping of data sets”, IEEE Transactions on Neural Networks, 1997.