An Optimization of Welding Process
Parameters :To Maximize the Ultimate Tensile
Strength of Lap Welding Joint by using Orthogonal
Array and Taguchi Method followed by ANOVA
Techniques
Akshay Kumar1, Anand Swaroop Verma2
1
Student, 2Professor, Department of ME, Kanpur Institute of Technology, Kanpur
Abstract:Research has focused in the field of Welding that can be analysed by destructive testing & Taguchi Method. This thesis is devoted to “An optimization of welding process parameters: To maximize the Ultimate Tensile Strength of lap welding joint by using Orthogonal Array and Taguchi method followed by ANOVA techniques.” This topic presents the influence of welding
parameters like welding current, welding speed and grove angle and obtained maximum tensile welding strength of work-piece. A plan of experiments based on Taguchi technique will be used. An Orthogonal array, signal to noise (S/N) ratio and analysis of
variance (ANOVA) are employed to study the welding characteristics of material & optimize the welding parameters. The result will computed is in form of contribution from each parameter, through which optimal parameters are identified for maximum tensile strength. From this study, it will observe that which parameters influence on the tensile strength of welded joint.
Keyword: TIG Welding, Mild Steel, Orthogonal array, Signal to noise (S/N) ratio and Analysis of variance (ANOVA).
I. INTRODUCTION
Welding is the procedure for joining of the similar or dissimilar material with the utilization of the heat, without pressure or with the pressure by application of fillers material or without filler material. Presently welding technology utilized in different field like automobile assembly, building structure, railroad industries, Pressure vessels and tank (barrels), aircraft designing, storage tank, pipeline industries, petrochemical enterprises, earth moving machine, shipbuilding industries and so on [1]. It may be said that the welding process have two major function in the industries: (i) as means of fabrication and (ii) for maintenance and repair. In the welding there is the many process variable which are very important to get a good weld joint , quality of welding and weld rate of deposition are effect by some welding parameter i.e. shielding gas, welding current, power source, current polarity (DCSP, DCRP), arc voltage weld travel speed (welding speed), weld joint geometry, size of electrode (diameter), chemical composition of shielding gas and rate of flow as the selection of filler material greatly influences the service life of weldment. During the welding there is the lot of consideration required for the fixturing of work piece which can caused the distortion mechanism in the specimen i.e. thermal distortion and formation of residual stress in the welded specimen.
Tungsten inert gas welding, [2] in which electrode is made up of tungsten, we can use filler metal as per requirement for decent welding. This welding is done by producing the arc between electrode and workpiece. In this welding process we utilize shielding gas generally heliam or argon (Ar) or mixture of both for shield the weld bead from atmosphere. TIG was grown during 2nd world war, this make easy to weld difficult material such as magnesium and aluminum. Nowadays the application of TIG has increased for welding of various kinds of metals such as high tensile steel, titanium alloy, mild steel, stainless steel, and Al alloy. The power source of TIG welding has advanced from basic transformer to highly electronic controlled power source in present day.
II. LITERATURE REVIEW
welding was superior in comparison to both.in this study 51% strength reduction were found by welding of GMAW, 37%reductuion by GTAW and 34% reduction in the strength by FSW welding.
M. Temmar et.al (2010) [4] Had investigated difficulty of welding aluminum material related to the like incomplete penetration, lack of fusion , porosity and crack they were trying to study the these effect against the AA7075 T6 material of thickness 2.5mm the post weld aging treatment T=1400C and used the welding variable current range 100- 140ampere and have taken voltage and speed 12.5 volt,12.7mm\second respectively argon gas used as protective gas .they have establish that yield and tensile strength of unwelded material was 404 and 508 MPa and TIG joint have 200,248MPa that is 50%reduction in weight due to the microstructure changes after post weld aging treatment have found that joint strength 216 and 268 MPa by the heat treatment of workpiece 9% strength have been increased.
Anand Rao et.al. (2014) [5] Have investigated of welding condition of stainless steel of tungsten inert gas welding. [5] They have used 310 SS because of excellent corrosion resistant properties on good weld ability and high temperature service factor with good ductility, they have taken 50×50×3 of dimension plate for butt joint with groove angle 450 and root gap was 1mm welding had performed with single pass direct current electrode negative (DCEN) with argon as shielding gas. To study they have prepared 9 sample (A to I) have taken 3 different electrode namely 316L 347 and 309 L.
III.WELDING GEOMETRY OF SPECIMEN AND MATERIAL PROPERTIES
A. Welding geometry
[image:2.612.89.511.334.435.2]The two plates are welded by a single V-groove butt weld joint with different groove angles and 2 mm bevel heights. The geometry of butt weld joint is as follow [6]. The workpiece have 150×30×8 mm dimension.
Figure: 1 Welding geometry with groove angle 300.
[image:2.612.38.573.492.574.2]B. Chemical Composition AISI 1030 mild steel
Table 1: Chemical composition of AISI 1030 mild steel [7]
Element Wt.% of content
Carbon (C) 0.270
Phosphorous (P) 0.040
Iron (Fe) 98.67
Sulfur (S) 0.050
Manganese (Mn) 0.60
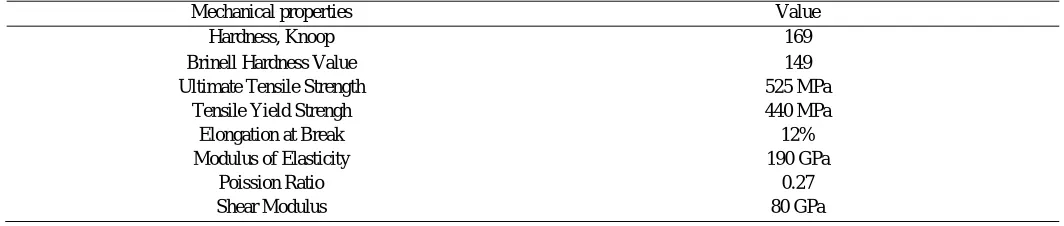
C. Mechanical Properties
Mechanical properties AISI 1030 mild steel [8]
Table 2: Mechanical properties of AISI 1030 mild steel
Mechanical properties Value
Hardness, Knoop 169
Brinell Hardness Value 149
Ultimate Tensile Strength 525 MPa
Tensile Yield Strengh 440 MPa
Elongation at Break 12%
Modulus of Elasticity 190 GPa
[image:2.612.37.569.627.740.2]IV. CALCULATION FOR TAGUCHI DESIGN METHOD AND ANOVA
A Japanese researcher, Dr Genechi Taguchi who spent a great deal of his master life investigating ways to deal with extend the idea of produced items. By this way job can be make continuous and at the minimum cost .without eliminating the cause quality of product can be enhance by this robust design method and compensate the outcome variation. Taguchi method focused on, to quality control connected to the complete whole procedure of creating and assembling an item from introductory idea through plan and engineering to assembling and generation extraordinarily expands designing productivity. By deliberately considering the noise factors, (environmental variety through the item's use, fabricating variety, and part deterioration) and failure cost in the field of the Robust Design procedure ensures purchaser achievements. Robust design effort on refining the central limit of the thing or procedure, such as helping versatile plans and concurrent engineering. Surely, this technique is generally used to limit the expense of item and item quality and during these compensate the interval of development [9].
This method follows the three main stage procedure
A. Design of system
B. Experiment Parameter design C. Tolerance design.
[image:3.612.43.570.367.422.2]1) Selection Of Control Factor And Levels: This experiment consist of two process parameters with three levels are select as the control parameters so That the levels are suitably distant hence they encompass wider range. The process parameter and their ranges of parameter are finalized by the literature review, books, testing experience of welder’s. The two control factors are selected such as, welding speed, and welding current [10].
Table 3: Control factor and levels
Variables Unit Level 1 Level 2 Level 3
Current (I) Amp. 110 130 150
Welding speed (S) mm/s 3 7 11
Groove angle () degree 30 45 60
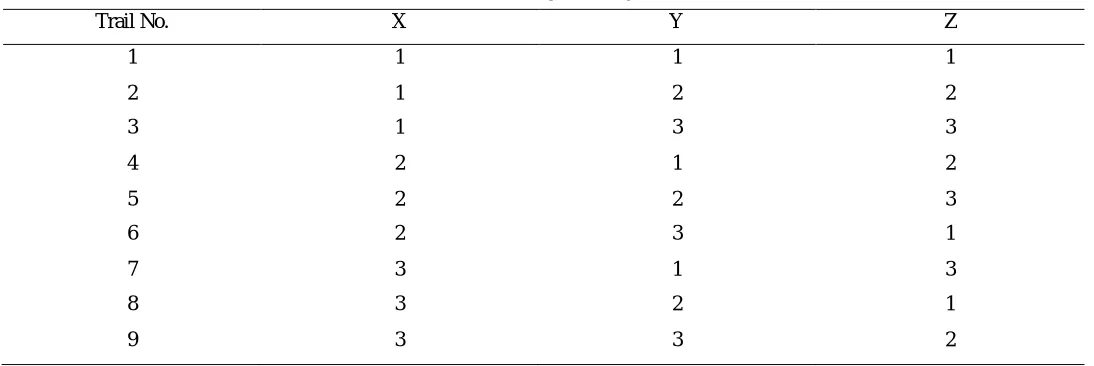
2) Selection Of Orthogonal Array: The experimental designs have been created with the help orthogonal arrays. The numbers of arrays are available for the purpose of each array can be used, to suit a number of possible experimental situations. In this work L9 is adequate. Taguchi experiment design of analyses proposes L9 orthogonal array, where 9 tests are adequate to optimize the parameters. Based on the principle factor, the variables are allocated at columns, as stipulated by the orthogonal array. When the orthogonal array is assigned, the analyses are chosen as each the level arrangement. It is significant that all analyses are conducted. The exhibition factor (output) is eminent for each investigational kept running for study [11].
Table 4: Orthogonal array L-9
Trail No. X Y Z
1 1 1 1
2 1 2 2
3 1 3 3
4 2 1 2
5 2 2 3
6 2 3 1
7 3 1 3
8 3 2 1
[image:3.612.34.581.537.720.2]3) Experimental Orthogonal Array: Experimental orthogonal array is prepared by the help of parameter table and table of orthogonal array L9.This table contributes in finding the optimal solution under which the ultimate welding strength are maximized. This table also give a set of parameters which are taken under the experiments day to day. This table is given below
Table 5: Experimental design data
Trail No. X Y Z
Current (amp) Welding speed (mm/s) Groove angle
(degree)
1 110 3 30
2 110 7 45
3 110 11 60
4 130 3 45
5 130 7 60
6 130 11 30
7 150 3 60
8 150 7 30
9 150 11 45
[image:4.612.36.578.360.523.2]4) Observation Table
Table 6: Taguchi orthogonal arrays design for S/N ratio: Ultimate tensile strength
Trail No. X Y Z Ultimate tensile strength S/N ratio
Current (amp) Welding speed (mm/s) Groove angle (degree)
MPa
1 110 3 30 302 49.60
2 110 7 45 298 49.48
3 110 11 60 236 47.46
4 130 3 45 359 51.10
5 130 7 60 371 51.39
6 130 11 30 336 50.53
7 150 3 60 315 49.97
8 150 7 30 382 51.64
9 150 11 45 306 49.71
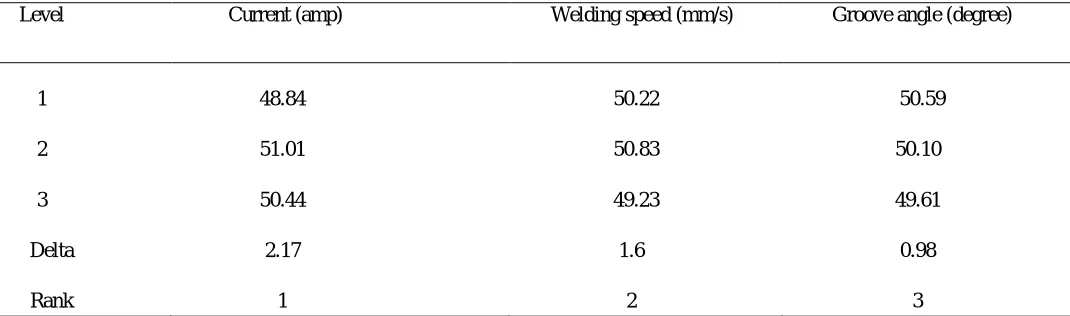
5) Main effect plot for S/N ratio: (Table response for Signal to Noise Ratios, Larger is better) [12]
Table 7: Main effect plot table for S\N Ratio
Level Current (amp) Welding speed (mm/s) Groove angle (degree)
1 48.84 50.22 50.59
2 51.01 50.83 50.10
3 50.44 49.23 49.61
Delta 2.17 1.6 0.98
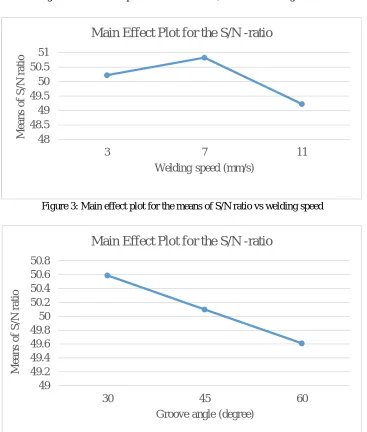
[image:4.612.42.577.572.730.2]Figure 2: Main effect plot for the means of S/N ratio vs welding current
Figure 3: Main effect plot for the means of S/N ratio vs welding speed
Figure 4: Main effect plot for the means of S/N ratio vs Groove angle 49
49.2 49.4 49.6 49.8 50 50.2 50.4 50.6 50.8
30 45 60
M
ea
n
s
o
f
S
/N
r
a
ti
o
Groove angle (degree)
Main Effect Plot for the S/N -ratio
48 48.5 49 49.5 50 50.5 51
3 7 11
M
ea
n
s
o
f
S
/N
r
a
ti
o
Welding speed (mm/s)
6) Computation Scheme Of Pareto Anova For Three Level Parameters: The general scheme of computation of Pareto ANOVA was given in the Table 5.4 Pareto ANOVA computation was done by using the S/N ratios of the process parameters to predict the optimal parameter level combination as well to determine the most influencing process parameter involved in this study [11].
Table 8: General Scheme for Pareto ANOVA computation:
Parameters X Y Z Total
1 ΣX1 ΣY1 ΣZ1 T= ΣX1+ ΣX2+
ΣX3
2 ΣX2 ΣY2 ΣZ2
3 ΣX3 ΣY3 ΣZ3
SSD SX SY SZ ST= SX+ SY+ SZ
Degree of Freedom 2 2 2 8
Contribution Ratio (SX/ST)*100 (SY/ST)*100 (SZ/ST)*100 100
Where SSD stand for the sum of square of differences and its values is given as Sx = (ΣX1- ΣX2)2 + ( ΣX2- ΣX3)2 + ( ΣX3- ΣX1)2
Similarly we can calculate the values of SY and SZ.
[image:6.612.42.577.155.263.2]7) Pareto ANOVA computation for UTS
Table 9: Pareto ANOVA Computation for UTS
V. RESULTS
I have calculated two types of results coming from the methods of Taguchi as well as followed by the help of ANOVA techniques. These two methods are sufficient to provide the complete information for the analysis of an objective. The two type of results, one for optimized parameter and other for contribution ratio on performance, are coming from these two different approaches are as follows:
A. Result By Taguchi Approach
From the method of Taguchi, I have calculated the value of S/N ratio for the different set of parameters for the each trial by the help of maximization function in terms of casting defect parameters, therefore the optimized results can be given by taking the larger the better type of characteristics, hence the optimal values for the parameters for maximum S/N ratio is
1) Welding current (amp) – level 2 – 130 2) Welding speed (mm/s) – level 2 – 7 3) Groove angle (degree) – level 1 – 30
B. Result followed by ANOVA Approach
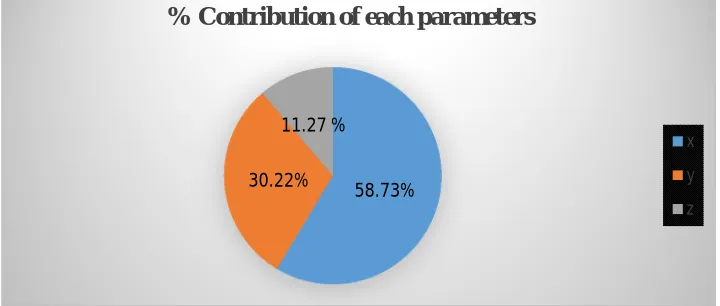
From the ANOVA techniques, I have calculated that the most affecting factor in UTS is welding current, which contributes about the 58.73%. The second most affecting parameter on the UTS is welding speed, which contributes the 30.22% and third affecting parameter is groove angle, which is 11.27%.
Parameters X Y Z Total
Sum at parameters levels 1 146.54 150.49 151.77 448.80
2 153.02 152.51 150.29
3 151.32 147.7 148.82
SSD 67.73 35.00 13.05 115.78
Degree of Freedom 2 2 2 8
Figure 5: Contribution of each parameters
VI. CONCLUSION
This experimental investigation were decide the ideal state of welding technique process parameters, total nine workpiece have been weld by TIG welding according to the design of experiment. After mechanical testing, concluded that for ultimate tensile strength from all selected parameters, welding current is most significant input ingredient affecting the ultimate tensile strength (UTS) of AISI 1030 mild steel.
The optimum welding parameter is 130 A Current, 7 mm\second weld speed and groove angle 30 degree.
REFERENCES
[1] S.P. Tiwari, S.A. Rizvi, wajahat Ali “Advanced welding technology” S.K Kataria & sons 4, edition, 2012
[2] Ahmed Khalid, Abdul Lateef ,Mohd Javed, Pramesh.T “Influence of welding speed on tensile strength of welded joint in TIG welding process” International journal of applied engineering research volume 1, 2010.
[3] A.K.Lakshminarayanan, V. Balasubramanian , K. Elangovan “Effect of welding process on tensile properties of AA6061 aluminum alloy joints’’ Journal of Advanced Manufacturing Technology 40:286–296, 2007
[4] M.Temmar ,M.Hadji, T. sahraoui “Effect of post –weld aging treatment on mechanical properties of tungsten inert gas welded low thickness 7075 aluminum alloy joints” journals of material and design 32(2011), 3532-3536
[5] V.Anand Rao, R. Deivanathan, Experimental Investigation for Welding Aspects of Stainless Steel310 for the Process of TIG Welding” Procedia Engineering 97 (2014) 902– 908.
[6] Mrs. Deepali Sanap, D. S. Galhe and R. M. Burkul, “A review paper on effect of welding speed and groove angle on strength of butt weld joint using TIG welding”, International journal of Engineering Science and Research and Technology, May, 2015, ISSN: 2277-9655.
[7] S. R. Patil and C. A. Waghmare, “Optimazation of MIG welding parameters for improving strength of welded joints”, International Journal of Advanced Engineering Research and Studies/ II/ IV/ July-Sept., 2013/14-16, E-ISSN2249-8974.
[8] AZO materials, “AISI 1030 Carbon Steel (UNS G10300)”, Article ID = 6531.
[9] Roy, Ranjit Quality control--Statistical methods, Taguchi methods (Quality control), Experimental design. Wiley interscience, 2001.
[10] Rishi Kumar, N Ramesh Mevada, “Experimental Investigation and Optimization of TIG Welding Parameters on Aluminum 6061 Alloy Using Firefly Algorithm” Materials Science and Engineering 225 (2017) 012153.
[11] Abhishek Nigam, Anand Swaroop Verma and Smita Dwivedi, “An optimization of process parameters: To minimize the casting defects of mild steel product in green sand casting process by using orthogonal array and taguchi method”,IJSART, vol. 3, Feb. 2017, ISSN 2395-1052.
[12] Akash Chand and Sunil Kumar Yadav, “Experimental investigation of weld joint of TIG welding on aluminium alloy”, Thesis, MMM Gorakhpur, 2018.
58.73% 30.22%
11.27 %
% Contribution of each parameters
x
y