Original Article
Serum fibronectin combined with urine α1-MG in
the diagnosis, treatment outcomes prediction
and prognosis of chronic glomerulonephritis
Yun Zou1,2,3,4, Chaoyang Ye1,2,3,4
1Department of Nephrology, Shuguang Hospital Affiliated to Shanghai University of Traditional Chinese Medicine, Shanghai, China; 2TCM Institute of Kidney Disease, Shanghai University of Traditional Chinese Medicine, Shang -hai, China; 3Key Laboratory of Liver and Kidney Diseases (Shanghai University of Traditional Chinese Medicine), Ministry of Education, Shanghai, China; 4Shanghai Key Laboratory of Traditional Chinese Clinical Medicine, Shanghai, China
Received June 10, 2019; Accepted August 7, 2019; Epub September 15, 2019; Published September 30, 2019
Abstract: Purpose: To investigate the predictive value of serum fibronectin (FN) and urine α1-microglobulin (α1-MG) in the diagnosis of chronic glomerulonephritis (CG). Methods: A total of 119 CG patients in our hospital were select-ed for our study cohort. 80 healthy people receiving a physical examination in our hospital during the same period were selected for the control group. ELISA and immunoturbidimetric assays were used to detect the serum FN and α1-MG levels. The clinical efficacy of each patient was recorded. Results: When the cut-off value was 0.541, the sen-sitivity of the CG diagnosis detected by FN combined with α1-MG was 92.16%, and the specificity was 88.00%. After treatment, the FN of the study group was higher than it was before the treatment (P< 0.001), and the urine α1-MG of the study group was lower than it was before treatment (P<0.001). After examining an ROC analysis curve, when the cut-off value was 0.701, the sensitivity of predicting the efficacy determined by FN and α1-MG was 88.00%, and the specificity was 88.00%. Conclusion: Due to the significant difference between CG patients and healthy people in terms of their serum and urine levels of FN and α1-MG, the combined diagnosis of FN and α1-MG is very valuable in diagnosing CG and predicting the treatment efficacy of CG.
Keywords: Serum fibronectin, urine α1-microglobulin, chronic glomerulonephritis, diagnosis
Introduction
Chronic glomerulonephritis (CG) is an allergic
reaction which mainly manifests as glomerular damage. It is one of the most common chronic
diseases in clinical practice [1]. Data from Wetmore et al. [2] also show that the current CG rate is increased year by year. As there are no obvious symptoms in early CG, most CG
patients are diagnosed when the disease reaches an advanced stage, even chronic renal failure, making successful treatment even
more difficult [3, 4]. At present, in clinical prac
-tice, the main diagnostic method for CG is to evaluate the glomerular filtration rate and the
renal injury indicator [5]. Although there are
many tools that can be used to reflect renal
injury, and the tools are convenient, they
usu-ally do not have sufficient sensitivity or detec
-tion ability in early renal injury [6]. Because of the growing threat of CG, it has been treated as
a key serious disease in clinical practice. In recent years, scholars at home and abroad
have been researching how to treat CG more
effectively [7-9].
Serum fibronectin (FN) is a complex protein with
a polysaccharide binding to proteins. The
exit-ing research has shown that FN is important in
the diagnosis and disease course of liver and
kidney diseases [10-12]. Urine α1-microglobulin (α1-MG) is a glycoprotein, which is synthesized
in the liver and the lymphoid tissues. The patho-logical increase can be seen in renal tubular damage, which is widely used as an early sensi-tive indicator for evaluating renal injury [13].
However, no studies have confirmed that FN combined with urine α1-MG has a good diag
-nostic effect on CG. We speculate that that FN combined with urine α1-MG can have a good
predictive value for the diagnosis, treatment,
Materials and methods
General information
A total of 119 CG patients in our hospital were
selected as the study subjects of our study cohort, including 108 males and 11 females,
and ranging in age from 26 to 64 years. The mean age was (34.68 ± 15.33) years, and the mean course of disease was (6.22 ± 3.27)
months. 80 healthy subjects receiving a physi-cal examination were placed into the control group, including 73 males and 7 females, and
ranging in age from 25 to 65 years. The mean age was (35.16 ± 16.52) years old. This study
was approved by the Ethics Committee of our hospital, and the above subjects signed informed consents.
Inclusion and exclusion criteria
Inclusion criteria: all patients in the study group
met the clinical manifestations of CG [14]; patients diagnosed with CG in our hospital;
after the diagnosis, the patients received regu-lar follow-up and routine treatment in our hospi-tal; patients with complete medical records; patients who participated in the investigation work of our hospital; patients ranging in age from 20 to 70 years old. Exclusion criteria: patients with tumors; patients with other car-diovascular diseases; patients with organ fail-ure; patients with other diseases of the liver and kidneys; patients who had other chronic diseases or who had urinary system diseases; patients who received other drugs before admission; patients with a mental illness; patients transferred halfway.
Inclusion criteria for the control group: people aged from 20 to 70 years, people who under-went a physical examination in our hospital and
were confirmed to be healthy. Exclusion criteria
for the control group: people who refused to participate in this experiment.
Methods
In the study group, the patients were given the
conventional treatment for CG in our hospital.
The therapeutic schedule was as follows: anti-coagulant therapy was conducted, infection was prevented, and strenuous exercise was
avoided. 10 mg benazepril was taken orally before meals, with 1 d/time (Beijing Novartis Pharmaceutical Co., Ltd., GYZZ H20030514). A
2.4 g nephritis rehabilitation tablet was also taken, with 3 d/time (Tianjin Tongrentang
Group Co., Ltd., GYZZ Z10940034). The course
of treatment was one month. 4 mL of fasting venous blood and 10 mL of morning urine were collected before and after the treatment. They were placed at room temperature for 30 min, and centrifuged (4000 rpm/min) for 10 min to obtain upper serum and supernatant. Serum
FN concentration (Human Fibronectin ELISA Kit Abcam, USA, ab219046) of the blood samples was determined using ELISA. The α1-MG con -centration of the urine samples was measured
using immunoturbidimetry (α1-microglobulin Assay Kit, Shanghai Xinfan Biotechnology Co., Ltd., XFSW251B). The evaluation of the CG patients by Kou [15] was referred. The treat
-ment efficacy was evaluated and rated. A prog -nosis follow-up was conducted on the patients for 3 years. The patients come back to the hos-pital once every quarter for follow-up and any
CG recurrence was recorded.
Outcome measures
The concentrations of FN and α1-MG in the
study group before and after the treatment were compared with those in the control group.
We wanted to determine the diagnostic value of the combination of FN and α1-MG to detect CG
before the treatment, the predictive value of
the combination of FN and α1-MG in the treat -ment outcome after the treat-ment, and the
pre-dictive value of FN and α1-MG in the recurrence of CG.
Statistical method
All the experimental results were statistically calculated using SPSS 24.0 statistical software
(Beijing Strong Vinda Information Technology
Co., Ltd.). All the graphs were drawn using
Graphpad 8 software (Shenzhen Tianruiqi
Software Technology Co., Ltd.), and the results
were confirmed by a secondary proof. The enu -meration data such as patient gender, place of residence, etc. were expressed in the form of a rate, and a chi-square test was used for com-parisons between groups. The measurement
data such as FN and α1-MG were expressed in the form of mean ± standard deviation (mean ± SD). An independent-samples t test was used for comparisons between groups, and a paired t test was used for comparisons within a group,
and an ROC curve was used for the predictive
analysis was performed for the prediction of the com-bined detection, and then
the ROC curve analysis fol -lowed. P<0.05 was consid
-ered statistically significant.
Results
General data comparison
There were no differences
in age, BMI, white blood
cells, red blood cells, plate-let count, gender, mari- tal status, education level, smoking habits, exercise habits, living environment, or ethnicity between the study and control groups (P>0.050). This meant that the two groups of patients were comparable (Table 1).
Comparison of FN and α1-MG concentrations
The serum FN of the study
group before treatment was
205.62 ± 32.83 mg/L,
which was lower than the
level of 248.63 ± 15.59
mg/L in the control group,
and P<0.001. The urine α1-MG of the study group
be-Table 1. Comparison of the clinical data between the study and
control groups [n (%)]
Study group
(n=119) Control group (n=80) t or X2 P
Age 34.68 ± 15.33 35.16 ± 16.52 0.210 0.834
BMI (KG/cm2) 22.16±5.69 22.76 ± 5.27 0.739 0.461 White blood cells (×109/L) 5.05±1.27 5.28 ± 1.05 1.341 0.182 Red blood cells (×1012/L) 4.16±0.64 4.22 ± 0.73 1633 0.104 Platelet count (×109/L) 227.31 ± 42.63 235.16 ± 46.83 1.224 0.222
Gender 0.014 0.905
Male 108 (90.76) 73 (91.25)
Female 11 (9.24) 7 (8.75)
Marital status 1.164 0.281
Married 112 (94.12) 72 (90.00)
Unmarried 7 (5.88) 8 (10.00)
Education level 0.246 0.620
<High school 42 (35.29) 31 (38.75) ≥High school 77 (64.71) 49 (61.25)
Smoking habits 0.538 0.463
Yes 98 (82.35) 69 (86.25)
No 21 (17.65) 11 (13.75)
Exercise habits 0.821 0.365
Yes 14 (11.76) 13 (16.25)
No 105 (88.24) 67 (83.75)
Place of residence 0.687 0.407
Town 86 (72.27) 62 (77.50)
Rural 33 (27.73) 18 (22.50)
Ethnicity 0.134 0.715
Han 113 (94.96) 75 (93.75)
Minority 6 (5.04) 5 (6.25)
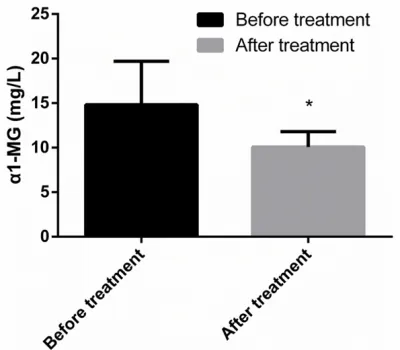
fore treatment was 14.83 ± 4.86 mg/L, which was higher than the level of 8.53 ± 2.08 mg/L in the control group, and P<0.001 (Figures 1,
2).
Diagnostic value of combined detection of FN and α1-MG for CG
The combined predictive probability values of
FN and α1MG in the two groups were obtained
using an SPSS binary logistic regression
analy-sis. After the ROC curve analysis, when the cut-off value was 0.541, the sensitivity of the CG diagnosis determined by FN and α1-MG was 92.16%, and the specificity was 88.00% (Figure
3, Table 2).
Comparison of FN and α1-MG concentrations before and after treatment
[image:3.612.90.386.96.465.2]The FN of the study group after treatment was (238.17 ± 12.97) mg/L, which was higher than
[image:3.612.91.287.487.680.2]the level (205.62 ± 32.83) mg/L of the control
group before treatment, and P<0.001. The urine α1-MG of the study group after treatment was (10.08 ± 1.73) mg/L, which was lower than the level (14.83 ± 4.86) mg/L of the control group before treatment, and P<0.001 (Figures
4 and 5).
Predictive value of the combined detection of FN and α1-MG for CG therapeutic outcomes
After treatment, 13 of the 119 patients in the study group were cured, the treatment in 71
patients was markedly effective, and the treat-ment in 35 patients was ineffective. The patients who were cured or who had markedly effective outcomes were placed into group A (n=84). The patients with an ineffective
out-come were divided into group B (n=35). The serum FN of group A was (242.36 ± 12.57)
mg/L, which was higher than the level (215.94
± 18.54) mg/L of group B, and P<0.001. The urine α1-MG of group A was (9.28 ± 1.66) mg/L, which was lower than the level (12.87 ± 2.04) mg/L of group B, and P<0.001. The com
-bined predictive probability values of FN and α1-MG in the group A and B were obtained
through an SPSS binary logistic regression
analysis. After the ROC analysis curve, when
the cut-off value was 0.701, the predictive
[image:4.612.90.289.71.249.2]sen-sitivity of the CG diagnosis detected by FN and α1-MG was 88.00%, and the specificity was 88.00% (Figures 6-8 and Table 3).
Figure 2. The urine α1-MG concentration of the study group before treatment was compared with the con-centration of the control group. *represented that it was compared with the urine α1-MG concentration of the study group before treatment, and P < 0.001.
Figure 3. Diagnostic value of the combined detection of FN and α1-MG for CG. After the ROC curve analy-sis, the sensitivity of the CG diagnosis detected by FN and α1-MG was 92.16%, and the specificity was 88.00%.
Table 2. The diagnostic value of the
com-bined detection of FN and α1-MG for CG
Indicator Numerical value
Area under curve 0.899
Std. error 0.037
95% CI 0.826~0.971
Cut-off 0.541
Sensitivity (%) 92.16
Specificity (%) 88.00
[image:4.612.322.524.92.415.2]P <0.001
[image:4.612.90.287.331.492.2]Predictive value of FN and α1-MG in the recur
-rence of CG
Among the 119 patients, 114 patients were successfully followed up, so the success rate
was 95.80%. Among them, 72 cases were sta -ble and no prognosis was reviewed. This cohort
was treated as group C. CG recurrence occurred
in another 42 patients and that cohort was
[image:5.612.89.289.71.246.2]treated as group D. The serum FN of group C was (240.96 ± 18.93) mg/L, which was higher than the level (209.81 ± 26.87) mg/L of group D, and P<0.001. The urine α1-MG of group C was (9.82 ± 2.28) mg/L, which was lower than the level (14.83 ± 5.29) mg/L of group D, and
[image:5.612.323.522.73.230.2]Figure 5. The urine α1-MG concentration in the study group was compared before and after treatment. *represented that it was compared with the urine α1-MG concentration of the study group before treat-ment, and P < 0.001.
Figure 6. The serum FN concentration was compared between group A and group B. *represented that it was compared with the serum FN concentration of group A, and P < 0.001.
Figure 7. The urine α1-MG concentration was com-pared between group A and group B. *represented that it was compared with the urine α1-MG concen-tration of group B, and P < 0.001.
P<0.001. The prediction probabilities of FN combined with α1-MG in group A and group B
were learned from the SPSS binary logistic
regression analysis. According to the ROC curve, when the cut-off value hit 0.487, FN combined with α1-MG had a predictive sensitiv
-ity of 95.83% and a specific-ity of 70.31% in the prognosis recurrence of CG (Figure 9 and Tables 4, 5).
Discussion
[image:5.612.323.521.301.464.2] [image:5.612.90.289.329.487.2]lesions. CG may also have varying degrees of renal tubulointerstitial inflammation and fibro
-sis, which has a great impact on patients [16].
Moreover, as the kidneys have a strong reserve capacity and compensatory ability, the damage
manifestation of early CG to the kidney is not
obvious. Therefore, there are still major
obsta-cles to diagnosing early CG in clinical practice [17]. At present, for the current diagnosis of CG,
the most common indicators are creatinine (SCr), cystatin C (Cys-C), urea (SUrea), etc. However, these indicators are easily affected in the human environment. They may not accu-rately respond to the renal injury, or to the
occurrence and development of CG [18]. α1-MG
in the urine is an excellent laboratory
monitor-ing indicator to reflect the slight functional dam -age of the proximal renal tubular. It has played a very notable role in the diagnosis and treat-ment of various renal diseases [19, 20]. As a complex protein widely distributed in human
tissues, FN usually plays a role in maintaining homeostasis. Once the concentration changes, it indicates that the disease or inflammation
will occur [22]. At present, it has been a long
time since the relationship between α1-MG and FN for CG has been confirmed [24, 25]. The exact mechanism of action on CG is not clear.
There are few studies on the diagnosis and
treatment significance of the combined mea
-surement of α1-MG and FN for CG at home and abroad. This study analyzed the value of FN combined with α1-MG in the diagnosis, treat
-ment outcome, and prognosis of CG, in the
hope of providing a more accurate guidance for
the future diagnosis and treatment of CG.
The results of this experiment showed that the
serum FN concentration in the study group was
lower than the concentration in the control
group, but the α1-MG concentration in the urine
was higher than it was in the control group. This
suggests that FN and α1-MG may be involved in the occurrence and development of CG, which is consistent with the results of Dabla et al. [26] and Abrass et al. [27]. FN is usually distributed
in the human environment in the form of tissue
or plasma [28]. After CG occurs, during the pro -cess of continuous damage and repair of vas-cular endothelial cells and mesangial cells, the
cell type FN is consumed in a large amount. At this time, the plasma type FN is converted into
a cell type and supplemented to the repair pro-cess to maintain the homeostasis of the entire
body. Therefore, the serum FN concentration of CG patients is greatly reduced. Moreover, α1-MG is mainly produced by hepatocytes and
lymphocytes. It needs to pass through the
glo-merular filtration membrane during its secre -tion into the urine. It will be reabsorbed and degraded by a large amount of the renal tubules
during the filtration process [29]. In this study, the urine α1-MG concentration of the study
group before treatment was higher than of the concentration in the control group, which indi-cated that the proximal kidney tubules had been damaged. Therefore, the reabsorption
capacity of the kidney was reduced. During the filtration process, a large amount of α1-MG was not absorbed by the glomerular filtration mem -brane and released into the urine. The study
done by Renke et al. [30] stated that α1-MG can arouse CG through oxidative stress, which
serves as evidence for the results of this study.
Through the ROC curve analysis, it was found that the combined detection of FN and α1-MG had a good diagnostic efficiency for the occur -Figure 9. The predictive value of FN and α1-MG in
[image:6.612.89.287.109.395.2]the recurrence of CG. According to the ROC curve, when the cut-off value hit 0.487, FN combined with α1-MG had a predictive sensitivity of 95.83% and a specificity of 70.31% in the prognosis recurrence of CG.
Table 3. The predictive value of the combined
detection of FN and α1-MG for CG treatment
outcomes
Indicator Numerical value
Area under curve 0.917
Std. error 0.031
95% CI 0.856~0.978
Cut-off 0.701
Sensitivity (%) 88.00
Specificity (%) 88.00
rence of CG. It was suggested that the com -bined detection can be used as a screening
method for early CG in clinical practice. Donadio
et al. [31] revealed the valuable sensitivity of
α1-MG for diagnosing CG in their study. But they just found a moderate specificity of α1-MG
due to the lack of combined detection with
other indexes. Further analysis of the changes of FN and α1-MG before and after treatment,
and the predictive value of combined detection
for CG therapy, showed that the FN of the study
group was higher than it was before treatment.
The α1-MG of the study group was lower than it was before the treatment. The ROC curve anal -ysis also showed that the combined detection
had a better sensitivity and specificity for the
prediction of therapeutic outcomes. It was sug-gested that the patient’s rehabilitation and cur-ing condition can be judged b monitorcur-ing the
FN and α1-MG concentrations of CG patients. However, in this study, the FN concentration of
the study group was lower than Yang et al. found [32]. The differences [32] may be caused by the different therapy methods. The course of nephropathy included in Yang’s study was 2 to 3 years, but the course of the subjects in
this study was only (6.22 ± 3.27) months. Differences in FN concentrations may be
caused by the different development degree of a patient’s condition. As the effect of the
cur-rent course of disease on FN has not been con
-firmed, we will conduct more in-depth research
to verify our results as soon as possible.
According to the ROC curve of patients with the prognosis of the recurrence of CG, the combi
-nation of FN and α1-MG enjoys a good predic -Table 4. Univariate analysis of CG recurrence by FN and α1-MG
[image:7.612.90.324.97.137.2]Group C (n=72) Group D (n=42) t P FN 240.96 ± 18.93 209.81 ± 26.87 7.237 <0.001 α1-MG 9.82 ± 2.28 14.83 ± 5.29 7.013 <0.001
Table 5. The predictive value of FN and α
1-MG for CG recurrence
Index Numerical value
Area under curve 0.875
Std. error 0.039
95% CI 0.798~0.952
Cut-off 0.487
Sensitivity (%) 95.83%
Specificity (%) 70.73%
tive value, suggesting the feasibility of
pre-venting against CG recurrence via mo-nitoring the FN and α1-MG expressions to
improve the prognosis of patients.
The purpose of this experiment was to investigate the diagnosis and treatment
significance of the combined detection of FN and α1-MG for CG. However, there are
still some shortcomings due to the limited
experimental conditions. For example, the influ
-encing mechanism of FN and α1-MG on CG occurrence still needs to be verified by further
research. A statistical analysis with big data cannot be performed due to limited experimen-tal subjects and the short course of disease. It is possible that there may be differences in the
expression of FN and α1-MG in different races and ethnic groups. We will conduct a longer
follow-up study on the subjects of this experi-ment. In order to obtain more valuable guid-ance, we will also continue to explore the
effects of FN and α1-MG on GG.
In summary, the serum FN of CG patients is
lower than that of normal people. The urine
α1-MG of CG patients is higher than that of nor
-mal people. The combined detection of FN and α1-MG has a good sensitivity and specificity for the diagnosis and treatment of CG. It is expect
-ed to be a reliable indicator for clinical CG diag -nosis and treatment in the future.
Acknowledgements
This work was supported by the Construction
of Key Disciplines of the Health System in
Pudong New Area, Shanghai (grant number:
PWZxq2017-07).
Disclosure of conflict of interest
None.
Address correspondence to: Chaoyang Ye, Depart- ment of Nephrology, Shuguang Hospital Affiliated to Shanghai University of Traditional Chinese Medicine, No. 528, Zhangheng Road, Shanghai 200000, China. Tel: +86-18721305639; E-mail: yeyanglo@ 163.com
References
[image:7.612.89.290.184.277.2]para-neoplastic syndrome in a young man with chronic myeloid leukemia. Leuk Lymphoma 2016; 57: 483-485.
[2] Wetmore JB, Guo H, Liu J, Collins AJ and Gilb-ertson DT. The incidence, prevalence, and out-comes of glomerulonephritis derived from a large retrospective analysis. Kidney Int 2016; 90: 853-860.
[3] Berti A, Cornec-Le Gall E, Cornec D, Casal Mou-ra M, Matteson EL, Crowson CS, RavindMou-ran A, Sethi S, Fervenza FC, Specks U. Incidence, prevalence, mortality and chronic renal dam-age of anti-neutrophil cytoplasmic antibody-associated glomerulonephritis in a 20-year population-based cohort. Nephrol Dial Trans-plant 2018.
[4] Zhang L, Long J, Jiang W, Shi Y, He X, Zhou Z, Li Y, Yeung RO, Wang J, Matsushita K, Coresh J, Zhao MH and Wang H. Trends in chronic kidney disease in China. N Engl J Med 2016; 375: 905-906.
[5] L’Imperio V, Smith A, Chinello C, Pagni F and Magni F. Proteomics and glomerulonephritis: a complementary approach in renal pathology for the identification of chronic kidney disease related markers. Proteomics Clin Appl 2016; 10: 371-383.
[6] Serwin NM, Wisniewska M, Jesionowska A, Skwirczynska E, Marcinowska Z and Dolegows-ka B. Serum levels of 12 renal function and injury markers in patients with glomerulone-phritis. Pol Arch Med Wewn 2016; 126: 483-493.
[7] Smith A, L’Imperio V, De Sio G, Ferrario F, Scal-ia C, Dell’Antonio G, Pieruzzi F, Pontillo C, Filip S, Markoska K, Granata A, Spasovski G, Jankowski J, Capasso G, Pagni F and Magni F. Alpha-1-antitrypsin detected by MALDI imaging in the study of glomerulonephritis: its rele-vance in chronic kidney disease progression. Proteomics 2016; 16: 1759-1766.
[8] Kamyshova ES, Shvetsov MY, Kutyrina IM, Bur-dennyi AM, Zheng A, Nosikov VV and Bobkova IN. [Clinical value of TNF, IL-6, and IL-10 gene polymorphic markers in chronic glomerulone-phritis]. Ter Arkh 2016; 88: 45-50.
[9] Steubl D, Block M, Herbst V, Nockher WA, Sch-lumberger W, Satanovskij R, Angermann S, Hasenau AL, Stecher L, Heemann U, Renders L and Scherberich J. Plasma uromodulin corre-lates with kidney function and identifies early stages in chronic kidney disease patients. Medicine (Baltimore) 2016; 95: e3011. [10] Su Y, Gu H, Weng D, Zhou Y, Li Q, Zhang F,
Zhang Y, Shen L, Hu Y and Li H. Association of serum levels of laminin, type IV collagen, procollagen III N-terminal peptide, and hyal-uronic acid with the progression of interstitial lung disease. Medicine (Baltimore) 2017; 96: e6617.
[11] Kiyokawa H, Yasuda H, Oikawa R, Okuse C, Matsumoto N, Ikeda H, Watanabe T, Yamamo-to H, IYamamo-toh F, Otsubo T, Yoshimura T, Yoshida E, Nakagawa M, Koshikawa N and Seiki M. Se-rum monomeric laminin-gamma2 as a novel biomarker for hepatocellular carcinoma. Can-cer Sci 2017; 108: 1432-1439.
[12] Mak KM and Mei R. Basement membrane type IV collagen and laminin: an overview of their biology and value as fibrosis biomarkers of liv-er disease. Anat Rec (Hoboken) 2017; 300: 1371-1390.
[13] Zhang H, Wang F, Xiao H, Yao Y. The ratio of urinary α1-microglobulin to microalbumin can be used as a diagnostic criterion for tubulopro-teinuria. Intractable Rare Dis Res 2018; 7: 46-50.
[14] Alchi B and Jayne D. Membranoproliferative glomerulonephritis. Pediatr Nephrol 2010; 25: 1409-1418.
[15] Kou J, Wu J, Yang HT, He YN, Fang JA, Deng YY, Xie YS, Nie LF, Lin HL, Cai GY and Chen XM. Ef-ficacy and safety of shenyankangfu tablets for primary glomerulonephritis: study protocol for a randomized controlled trial. Trials 2014; 15: 479.
[16] Lertrit A, Worawichawong S, Vanavanan S, Chittamma A, Muntham D, Radinahamed P, Nampoon A and Kitiyakara C. Independent as-sociations of urine neutrophil gelatinase-asso-ciated lipocalin and serum uric acid with inter-stitial fibrosis and tubular atrophy in primary glomerulonephritis. Int J Nephrol Renovasc Dis 2016; 9: 111-118.
[17] Kishore L, Kaur N and Singh R. Distinct bio-markers for early diagnosis of diabetic ne-phropathy. Curr Diabetes Rev 2017; 13: 598-605.
[18] Hanna M, Brophy PD, Giannone PJ, Joshi MS, Bauer JA and RamachandraRao S. Early uri-nary biomarkers of acute kidney injury in pre-term infants. Pediatr Res 2016; 80: 218-223. [19] Bech AP, Hoogendijk JM and Wetzels JF.
Uri-nary excretion of alpha1-microglobulin does not predict graft loss in stable kidney trans-plant recipients. Am J Kidney Dis 2017; 70: 151.
[20] Zhang X, Zhou H and Li Y. Combined detection of urinary micro albumin, alpha1-microglobulin and n-acetyl-beta-d-glucosaminidase in the early diagnosis of diabetic nephropathy. Pak J Med Sci 2017; 33: 1324-1327.
[21] Donadio C and Bozzoli L. Urinary beta-trace protein: a unique biomarker to screen early glomerular filtration rate impairment. Medicine (Baltimore) 2016; 95: e5553.
serum and urinary biomarkers. Early Hum Dev 2017; 105: 57-61.
[23] Fabris A, Bruschi M, Santucci L, Candiano G, Granata S, Dalla Gassa A, Antonucci N, Petret-to A, Ghiggeri GM, Gambaro G, Lupo A and Zaza G. Proteomic-based research strategy identified laminin subunit alpha 2 as a poten-tial urinary-specific biomarker for the medul-lary sponge kidney disease. Kidney Int 2017; 91: 459-468.
[24] Yang DH, McKee KK, Chen ZL, Mernaugh G, Strickland S, Zent R and Yurchenco PD. Renal collecting system growth and function depend upon embryonic gamma1 laminin expression. Development 2011; 138: 4535-4544. [25] Riaz S, Alam SS, Srai SK, Skinner V, Riaz A and
Akhtar MW. Proteomic identification of human urinary biomarkers in diabetes mellitus type 2. Diabetes Technol Ther 2010; 12: 979-988. [26] Dabla PK. Renal function in diabetic
nephropa-thy. World J Diabetes 2010; 1: 48-56. [27] Abrass CK, Hansen KM and Patton BL.
Lam-inin alpha4-null mutant mice develop chronic kidney disease with persistent overexpression of platelet-derived growth factor. Am J Pathol 2010; 176: 839-849.
[28] Chen YM, Kikkawa Y and Miner JH. A missense LAMB2 mutation causes congenital nephrotic syndrome by impairing laminin secretion. J Am Soc Nephrol 2011; 22: 849-858.
[29] Liakos CI, Vyssoulis GP, Markou MI, Kafkas NV, Toutouzas KP and Tousoulis D. Twenty-four-hour urine alpha1 -microglobulin as a marker of hypertension-induced renal impairment and its response on different blood pressure-lower-ing drugs. J Clin Hypertens (Greenwich) 2016; 18: 1000-1006.
[30] Renke M, Tylicki L, Rutkowski P, et al. Effect of pentoxifylline on proteinuria, markers of tubu-lar injury and oxidative stress in non-diabetic patients with chronic kidney disease-placebo controlled, randomized, cross-over study. Acta Biochimica Polonica 2010; 57: 119-123. [31] Donadio C, Bozzoli L. Urinary β-trace protein: a
unique biomarker to screen early glomerular filtration rate impairment. Medicine 2016; 95: e5553.
![Table 1. Comparison of the clinical data between the study and control groups [n (%)]](https://thumb-us.123doks.com/thumbv2/123dok_us/1268162.654812/3.612.91.287.487.680/table-comparison-clinical-data-study-control-groups-n.webp)