Abstract—Implicit Media Knowledge aims to provide relevant information related to visual media without effort. It is based on the analysis of media usage from several users (e.g. a community). Algorithms based on clustering methods that extract relevant information (e.g. tags, taxonomy trees) related to a media from its usage are detailed. To validate our new approach, we propose to apply our concept and algorithms on a specific media use such as the analysis of how multiple users organize their media files. Significant results of this first experimentation will be highlighted. Perspectives of our work will be finally presented.
Index Terms—Clustering Methods, Implicit Tags, Media Indexing, Media Usage.
I. INTRODUCTION
Video is widely used to promote professional or personal works at an individual, social or collaborative level. Paradoxically, relevant information (e.g. metadata) related to a video is frequently poorly described. The quantity of visual media (especially video) is abundant. Finding or retrieving a specific visual media becomes a major issue. Many existing visual media indexing/retrieval systems extract relevant information from visual media content to improve search engine efficiency but there are still limitations (cf. [1]). Implicit Media Knowledge (e.g. IMK) is a new approach that efficiently provides relevant information (e.g. metadata) related to a media. In the first part of this paper, an overall description of the IMK concept will be introduced (cf. [1]) and algorithms will be detailed. In the second part, we apply our algorithms on a case study (e.g. on a specific media usage such as files organization analysis over several users) to validate our new approach. Relevant results of the first experimentation will be highlighted. In the third part, challenges and next steps of our work will be detailed.
II. IMPLICIT MEDIA KNOWLEDGE
This chapter introduces the Implicit Media Knowledge concept and model that is detailed in [1]. Algorithms that deduce implicit clusters of resources (e.g. most common tags) and a taxonomy tree (e.g. a most common organization tree) are also presented.
Manuscript submission date: July 16th, 2010. Alcatel-Lucent France, Bell Labs, Centre de Villarceaux, Route de Villejust, 91620-Nozay, France.
*Muy-Chu Ly is with Alcatel-Lucent Bell Labs France (e-mail: Muy-Chu.Ly@ Alcatel-Lucent.com).
**Alexis Germaneau is with Alcatel-Lucent Bell Labs France (e-mail: [email protected]).
A. Concept & Model
Implicit Media Knowledge is a new approach that provides relevant information (e.g. metadata) for visual media by analyzing its use (e.g. visualize, copy, edit, rename, remove, share, upload, download, discussion…) from several users or a community (cf. Figure 1). Media usage information is collected and sent to a centralized server. Consolidation data (based on a statistical engine) provides some relevant information related to the media such as implicit tags or taxonomy trees.
Implicit Media Knowledge Collect
Media Usage
Extract
Relevant Info
Implicit tags
[image:1.595.306.548.311.502.2]Implicit Graph
Figure 1: Implicit Media Knowledge Concept
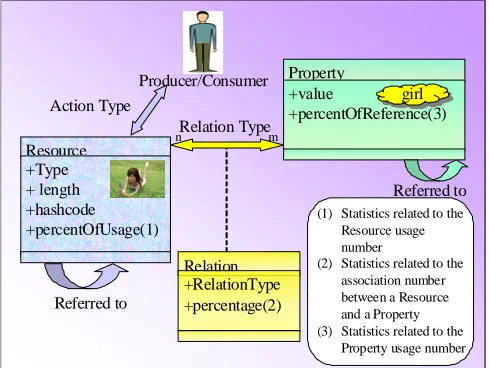
The following figure illustrates the Media Usage model that enables relevant information (e.g. metadata) extraction from implicit user actions on media over several users (cf. [1] for more details):
Resource +Type + length +hashcode +percentOfUsage(1)
Relation +RelationType +percentage(2) n
Property +value
+percentOfReference(3) m
Action Type
Relation Type Producer/Consumer
Referred to
Referred to girl
(1) Statistics related to the Resource usage number
(2) Statistics related to the association number between a Resource and a Property (3) Statistics related to the
Property usage number
Figure 2: Media Usage Model
Implicit Media Knowledge
Experimentation & Results
[image:1.595.305.550.574.758.2]B. An algorithm to deduce implicit clusters of resources
[image:2.595.47.292.137.407.2]In our algorithm that deduces implicit tags (cf. Figure 3), we consider that two files are adjacent when they are put in the same directory by a user. The adjacency between two files represents the number of users that put two files in the same directory. The following algorithm enables to extract a set of resources statistically adjacent to a resource A.
Figure 3: Algorithm to deduce implicit clusters of resources
The algorithm is based on a minimum average adjacency (also called “adjacency_threshold”) expected to add a resource in the set around A (also previously noted SET in Figure 3 line 01). Line 07 and 08 iterate over on all resources R that are not already in the set around A. From line 09 to 13, the average adjacency between R and all elements of the set around A is calculated. From line 14 to 17, we check that the average adjacency between R and elements in the set around A is greater than their predecessor. In line 20, “MAXR” is the most adjacent element to the set around A and its adjacency is “max”. We check that the average adjacency between MAXR and SET is greater than a given threshold (for instance, it can be 70%). We notice that the “adjacency_threshold” is homogeneous to a percentage of users. In line 21, we add the most adjacent element to the set around A. We finish the procedure in line 23 when there is no remaining adjacent sufficient in the set of resource.
The algorithm finds a set of adjacent resources to a given resource: it gives preponderance to the greatest adjacency sets. Thus, we can split a resource set based on the greatest adjacency set and its complementary set. We reiterate the algorithm in the complementary set. The mechanism will then create a partition of adjacency sets. However, the resulting partition risks to be composed of a big set and many little ones. Although, we expect that this will not be significant in initial experiments. Thanks to the algorithm, we can check if a resource set related to a resource A is similar or different from a resource set related to a resource B. These checks will enable to create a partition of adjacency sets.
C. An algorithm to deduce a most common organization
tree
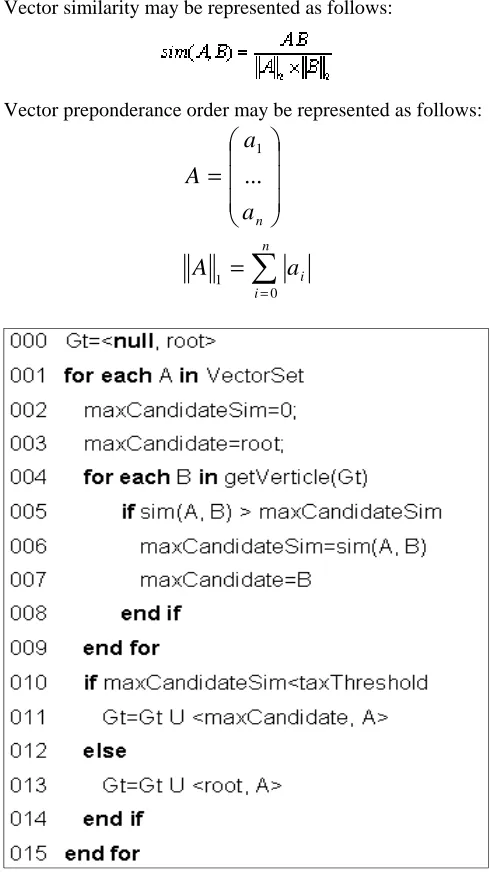
The purpose of this algorithm is to reproduce in average the mean organisation (e.g. a most common organisation) that people have in their local file system for a specific set of media items. We used an algorithm based on similarity vector to deduce a taxonomy tree. Each word is associated with a vector and each coordinate of the vector represents the number of times a word is associated with a media or another tag corresponding to this coordinate.
Vector similarity may be represented as follows:
Vector preponderance order may be represented as follows:
∑
=
=
=
n
i i n
a
A
a
a
A
0 1
1
[image:2.595.303.548.190.626.2]...
Figure 4: Algorithm to deduce a most common organization tree
Each visual media is tagged with a direct folder name of its full path and each folder is tagged with the folder name that contains it. For instance, using the Windows® system, “c:\\image\\humour\\001.png”, the image is tagged with ‘humour’, ‘humour’ is tagged with ‘image’ and ‘image’ is tagged with ‘c:’. In this tagging system, we observe the tag “c:” appears for a lot of resources but it is spread over several dimensions.
seen as preponderance of the word ‘c:’ can be relatively lower than other words (e.g. ‘image’, ‘humor’…). As consequence, the word “c:” is focused into small groups of media and is not placed in the root of the taxonomy tree. As we want to reproduce an average tree organisation, we compensate the spread of words in roots of directories by using norm 1 that simply count the number of occurrences. The effect is then that the most used word such as “c:” will be placed in the root of taxonomy tree.
Figure 4 details the algorithm that deduces a taxonomy tree based on cosine similarity of tag vectors. From line 000 to 004, let’s define a taxonomy tree (Gt). <A, B> is a verticle between vector A and vector B. getVerticle(Gt) returns the list of vectors already in the taxonomy tree. In line 001, VectorSet is ordered by preponderance in norm one: the first is the most preponderant and the last is the least. In line 002 and 003, the Max similarity is defined (“maxCandidateSim”) and the corresponding vector (“maxCandidate”) found in the vectors of the taxonomy. Lines 004 to 009 enable us to find the vector of (Gt) that is the most similar to “B”. In line 010 and 011, if the most similar vector is similar enough, then “B” is added in a branch below that vector (“B” is a specialized concept of “maxCandidate”). In line 013, a new conceptual branch is created as B is not similar to other concept in the tree.
Note that the iMK (Implicit Media Knowledge) vector is defined by its coordinate in a base of resource. A resource can be a media file or a property (when one property tags another). For instance, let us look at “c:\Movies\SciFi\matrix.avi”, where “c:” is a property that tags the resource “Movies”, “Movies” is a property that tags the resource “SciFi”, and “SciFi” is a property that tags the raw resource “matrix.avi”. The vector space of this single example contains three resources, “Movies”, “SciFi”, and “matrix.avi”. An iMK vector is a textual property (e.g. “matrix”). iMK coordinates represent for each resource the number of times that text is associated with a resource. iMK preponderance (in norm one) measures the number of times the text has been used to qualify a resource or another property. iMK similarity measures in proportion how much a property is associated with a set of resources is comparable to another one.
Here is an example: let’s have 3 resources “matrix.avi”, “total_recall.avi” and “bridget_jones.avi”. “SciFi” has been associated 3 times with “matrix.avi”, 2 times with “total_recall.avi” and 0 times for “bridget_jones.avi”. “Movies” has been associated 6 times with “matrix.avi” and “total_recall.avi” and 4 times for “bridget_jones.avi”. “Movies” is more preponderant than “SciFi” so it is intuitively the most abstract concept. The similarity between “SciFi” and “Movies” is 0,89. So the two concepts are relatively similar (e.g. if “taxThreshold” is less than 0,8). In that case, the taxonomy tree will contain a branch: (ROOT)→(Movies)→(SciFi).
=
→
=
→
4
6
6
,
0
2
3
Movies SciFi
III. EXPERIMENTATION
For our first experimental research, we focus on a specific media usage to validate our algorithms described above: media file organization analysis on several computers.
A. Context
In order to validate our new approach, we built a randomly chosen test collection that contains 200 files. This collection covers different support types such as video, photo, image, audio, document and it covers different domains such as politics, travels, news...
According to J. Nielsen ([3]), it’s sufficient to test with a handful of users when collecting usability metrics. For our experimentation, we selected a panel of 15 users, aged from 23 to 46 years old with various profiles such as PhD students on sociology, experts on experimentation, students, designers, engineers, computer science PhDs. These users were required to organize/classify the proposed media collection on their computer in order to have an overview of the expected results (e.g. detection of media usages and extraction of relevant information related to a media). To complete the experiment, users were asked to answer a survey.
B. Results
Thanks to the algorithm based on clustering methods (cf. II.B), we get the following results. We consider files to be sorted when there are in an adjacency set with more than 4 elements (cf. algorithm in Figure 3). We notice that on 7 users, only 56% of files are sorted with a strong relationship between sorted files as the threshold (e.g. “adjacency_threshold”) is set to 57%. On 15 users, 76% of files are sorted with a light relationship between sorted files as the threshold (e.g. “adjacency_threshold”) is set to 36%. It means that the more users are increasing, the more files are sorted but the relationship between sorted files are less significant. In both cases, most of people don’t dare to delete some files and store them in a directory name such as “others”, “images”, “icons”.
Percentage of sorted files
Sorted 59% Unsorted
41%
Sorted Unsorted
Sorted 76% Unsorted
24%
With 7 Users With 15 Users
Figure 5: Percentage of Sorting files
0 2 4 6 8 10 12 14 16 h u m o u r i c o n s d iv e rs i m a g e s l o g o (R o o t d ir e c to ry ) p o u r p o w e rp o in t i c o n s _ lo g o i c o n e i c o n i c o n e s i c o n e s u s e fu ll_ ic o n s m e s i m a g e s s p o rt r e s o u rc e s n a tu re p e in tu re f o n d e c ra n Tag % o f a ff e c ta ti o n
Figure 6: Implicit Tags deduced from file organization
On average, about 3% of files were renamed. Among renaming files, three categories emerged: explicit names, personal names (e.g. person names) and short names for convenience. In most cases, it is sufficient to create directories to sort the media and some of these contain semantic information such as “humour”, “sport”, and “nature”.
Repartition of renaming types
72% 23% 5% Explicit Convenience Personal
Figure 7: Renaming Types
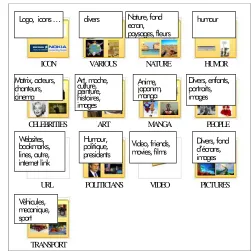
Few people added their own media files during the experiment. With the algorithm described in II.B, we get 13 relevant thematic sets from file organization. It is interested to notice that we roughly get the same number of relevant thematic sets with 7 users or 15 users. The following Figure shows tags associated with the 13 sets by order of the most popular (e.g. set_0 or “ICON” is the greatest set). About 3 tags are associated with each set. We notice that there are some tags such as “ugly” in Set_5 (e.g. “ART”) that indicate user emotions. This information type is rarely provided by existing visual media indexing methods.
Logo, icons … divers Nature, fond
[image:4.595.46.291.49.319.2]ecran, paysages, fleurs humour Matrix, acteurs, chanteurs, cinema Art, moche, culture, peinture, histoires, images Anime, japanim, manga Divers, enfants, portraits, images Websites, bookmarks, lines, autre, internet link Humour, politique, presidents Video, friends, movies, films Divers, fond d’écrans, images Véhicules, mecanique, sport ICON VIDEO NATURE HUMOR CELEBRITIES ART URL POLITICIANS TRANSPORT VARIOUS PICTURES PEOPLE MANGA
Figure 8: Implicit Themes deduced from file organization
From these file organizations, a taxonomy based on directory names can be also deduced with our algorithm described in II.C. Figure 9 is an example result. The algorithm doesn’t currently detect synonyms such as “Children”, “Child” and “Baby”. In this first experiment, synonymy detection is difficult with too few people but in a larger scale, we can guess that our algorithm will be able to implicitly deduce synonymy. The taxonomy tree in Figure 9 represents the statistical repartition of concept associated with resources. For instance, the algorithm considers the concept of “Children” as more general than the concept of “Faces” as “Children” is largely used. From the taxonomy tree, we deduced the early emergence of thematic branches where a common sense abstraction relationship matches with the discovered one. But results remain mitigated as synonymy has not been yet studied. With another experiment with more users and using explicit dictionaries, synonymy should be detected in order to prove that the more concept is general the more it will be used as tag and that the abstraction-specialization hierarchical relationship will be usually respected.
Children
Baby
F aces
Fa mi ly
Wife
Chil d
Child
Most Used
Less Used
[image:4.595.49.288.430.573.2] [image:4.595.303.550.577.756.2]C. Survey
A survey followed this first experiment in order to reveal insights into the real media usage of tested users at their home and at their office. The 4 most popular used equipments are respectively: the computer, the mobile phone, the digital camera and the USB key. Visual media usage at an office computer is different from home computer. In a professional environment, media is principally stored on computers in order to be reused in a document/presentation or for wallpapers. At home or in personal spheres, media is stored for an indeterminate period and can be mainly divided into 2 categories: personal photos and media related to users hobbies. Personal media is more likely to be retrieved, visualized, archived and/or transmitted to others.
Renaming files on videos or photos mainly happens when there is a strong interest in the media for the user. The user provides explicit/semantic information in the media name in order to more easily retrieve and visualize it later. Nobody tags their own video and very few people (especially among young users) comment photos/videos on the WEB: is that an action specific to the profile of a research engineer or a PhD? Or maybe is there no adapted tool (like for photos) to enable users to comment on their own video?
Organising media files can be a boring task for the majority of tested users: an average of 30 minutes has been needed to sort the collection of files and nobody wants to spend more time on it!!! Many users (8 of the 15 persons tested) would like to install an application on their computers when it is useful for them. For example, some users would be interested in a useful tool that performs automatic renaming and sorting files according to content or tags. Others are interested by a tool that provides more information (e.g. summary, author, associated book or music…) for each media file.
D. Limitations
The first experimental results are encouraging as relevant categories and tags on media can be implicitly and effortlessly deduced only from file organization provided from several users. The experimentation context should be improved to fully validate our new approach by increasing the number and variety of tested users. Most of tested users are research engineers and have roughly the same experience in computers and media files: other user profiles will likely have different experiences and reveal different insights. The test collection doesn’t contain many video and music, and the collection should contain more variety and the associated follow-up survey should be more elaborate. The experimental environment was in a workplace and users required frequent reminders to perform the tasks and answer the survey. Although users express interest in tools that automatically rename and organize media files, they are not willing to spend time on performing this task manually.
IV. PERSPECTIVES
In this chapter, we focus on challenges and next steps of our work.
A. Technological Challenge
Our new approach requires a lot of data to deduce relevant information related to a specific media. For that, new APIs will be proposed to extract relevant information (such as implicit tags, taxonomy trees) related to a visual media. These APIs will be used to validate our algorithm and enrich any media applications. This first experiment revealed other technological challenges to be solved: how can we detect that renamed files are similar to the same visual media content? How can we semantically rationalize identical or similar tags (e.g. “big” and “BIG”)? How can we implicitly recognize visual media content when the visual media has been truncated or converted to another format?
B. Usage Challenge
For the first experiment, we only focused on a specific usage that is file organization in computers storage. To enlarge this first experiment, we recently put together a new service called “I-Media Card” (cf. [4]) as a public experiment which enables users to donate their file organization to feed and validate our algorithm. The end-user will need to install the service on their computer in spite of certain privacy issues. It is therefore advisable that the end-user be able to locally visualize media log contents that will be used for the implicit media indexing. The end-user may then feel better by seeing that logs are only focused on media. The service enables users to have more information from the WEB on their media files (e.g. summary, implicit tags, other implicit similar media). Other tools that integrate high-scores, games or/and bonuses can also be proposed later to motivate users to install the service. Many other experiments should be later extended to other media usages (such as uploading or downloading or emailing or other sharing and so on), to other devices (such as mobile phone or TV), and to other media types (such as documents or music or post-it).
C. Next Steps
To meet these technological challenges, we intend to propose new APIs that can be used by other existing media applications or retrieval systems to enrich their databases. Secondly, we will extend and validate our model and algorithm to other media usages such as mail or bookmark organization. The analysis of media usage then provides relevant information related to a media and also enables us to discover new media usages or interaction types.
V. CONCLUSION
REFERENCES
[1] Muy-Chu Ly, Alexis Germaneau and Olivier Martinot. 2009. “Implicit Media Knowledge”. Eightth International Conference on Networks (ICN).
[2] Paul Heymann and Hector Garcia-Molina. “Collaborative Creation of Communal Hierarchical Taxonomies in Social Tagging Systems.” Stanford University Stanford, CA 94305, April 2006.
[3] Jakob Nielsen, June 2006. User testing at Usability Week 2009 conference in Washington DC, San Fanscisco, London and Sydney. ”Quantitave Studies: How many Users to Test?”. Available on:
http://www.useit.com/alertbox/quantitative_testing.html
[4] Experimentation available on http://www.imediacard.com/
[5] Luis Von Ahn and Laura Dabbish. “Labeling Images with a Computer Game.” Pittsburgh 2004.
[6] Ben Markines, Lubomira Stoilova, Filippo Menczer. “Implicit tagging using Donated Bookmarks.” Bloomington 2006.
[7] Murat Yakici and Fabio Crestani. “Design and Implementation of a Cross-Media Indexing System for the Reveal-This System”. University of Strathclyde Glasgow UK 2006.
[8] Svenonius, Elaine. 1994. “Access to Non book Materials: The Limits of Subject Indexing for Visual and Aural Languages”. Journal of the American Society for Information Science 45, no 8: 600-606. [9] Shatford, Sara. 1984. “Describing a picture: a thousand words are
seldom cost effective”. Cataloging & Classification Quarterly 4, no 4 (Summer): 13-30.
[10] Karen Kent, Murugiah Souppaya. “Guide to Computer Security Log Management. ” NIST Special Publication 800-92 Gaithersburg, 2006. [11] Fabien Gandon, Alain Giboin. “Vers des ontologies à l’état sauvage.
” Sophia Inria, 2008.
[12] W.H. Adams, G. Iyengar, C.-Y. Lin, M.R. Naphade, C. Neti, H.J. Nock and J.R. Smith. “Semantic indexing of multimedia content using visual, audio and text cues”. Journal on Applied Signal Processing, 2003(2):170-185, 2003.
[13] C. Snoek and M. Worring. Multimodal video indexing: A review of the state-of-the-art. Multimedia Tools and Applications, 25(1):5-35, 2005. [14] K. Bernard, P. Duygulu, N. de Freitas, D. Forsyth, D. Beli and M.I. Jordan. Matching words and pictures. Journal of Machine Learning Research, 3:1107-1135, 2003.