Reading behavior predicts syntactic categories
Maria Barrett and Anders Søgaard
University of Copenhagen Njalsgade 140 DK-2300 Copenhagen S
{dtq912,soegaard}@hum.ku.dk
Abstract
It is well-known that readers are less likely to fixate their gaze on closed class syn-tactic categories such as prepositions and pronouns. This paper investigates to what extent the syntactic category of a word in context can be predicted from gaze fea-tures obtained using eye-tracking equip-ment. If syntax can be reliably predicted from eye movements of readers, it can speed up linguistic annotation substan-tially, since reading is considerably faster than doing linguistic annotation by hand. Our results show that gaze features do dis-criminate between most pairs of syntactic categories, and we show how we can use this to annotate words with part of speech across domains, when tag dictionaries en-able us to narrow down the set of potential categories.
1 Introduction
Eye movements during reading is a well-established proxy for cognitive processing, and it is well-known that readers are more likely to fixate on words from open syntactic categories (verbs, nouns, adjectives) than on closed category items like prepositions and conjunctions (Rayner, 1998; Nilsson and Nivre, 2009). Generally, readers seem to be most likely to fixate and re-fixate on nouns (Furtner et al., 2009). If reading behavior is af-fected by syntactic category, maybe reading be-havior can, conversely, also tell us about the syn-tax of words in context.
This paper investigates to what extent gaze data
can be used to predict syntactic categories. We
show that gaze data can effectively be used to dis-criminate between a wide range of part of speech
(POS) pairs, and gaze data can therefore be used to significantly improve type-constrained POS tag-gers. This is potentially useful, since eye-tracking data becomes more and more readily available with the emergence of eye trackers in mainstream consumer products (San Agustin et al., 2010). With the development of robust eye-tracking in laptops, it is easy to imagine digital text providers storing gaze data, which could then be used to im-prove automated analysis of their publications.
ContributionsWe are, to the best of our
knowl-edge, the first to study reading behavior of syntac-tically annotated, natural text across domains, and how gaze correlates with a complete set of syntac-tic categories. We use logissyntac-tic regression to show that gaze features discriminate between POS pairs, even across domains. We then show how gaze fea-tures can improve a cross-domain supervised POS tagger. We show that gaze-based predictions are robust, not only across domains, but also across subjects.
2 Experiment
In our experiment, 10 subjects read syntactically annotated sentences from five domains.
Data The data consists of 250 sentences: 50
sentences (min. 3 tokens, max. 120 characters), randomly sampled from each of five different, manually annotated corpora: Wall Street Jour-nal articles (WSJ), Wall Street JourJour-nal headlines (HDL), emails (MAI), weblogs (WBL), and Twit-ter (TWI). WSJ and HDL syntactically annotated sentences come from the OntoNotes 4.0 release of
the English Penn Treebank.1 The MAI and WBL
sections come from the English Web Treebank.2
1catalog.ldc.upenn.edu/LDC2011T03 2catalog.ldc.upenn.edu/LDC2012T13
. ADJ ADP AD
V
CONJ DET NOUN NUM PR ON PRT
VERB
0.0 0.2 0.4 0.6 0.8 1.0
WSJ Fixation probability. n = 858
probability
.
ADJ ADP AD
V
CONJ DET NOUN NUM PR ON PRT
VERB
0.0 0.2 0.4 0.6 0.8 1.0
HDL Fixation probability. n = 461
probability
.
ADJ ADP AD
V
CONJ DET NOUN NUM PR ON PRT
VERB
0.0 0.2 0.4 0.6 0.8 1.0
TWI Fixation probability. n = 610
probability
.
ADJ ADP AD
V
CONJ DET NOUN NUM PR ON PRT
VERB
0.0 0.2 0.4 0.6 0.8 1.0
MAI Fixation probability. n = 575
probability
.
ADJ ADP AD
V
CONJ DET NOUN NUM PR ON PRT
VERB
0.0 0.2 0.4 0.6 0.8 1.0
WBL Fixation probability. n = 716
[image:2.595.88.270.61.327.2]probability
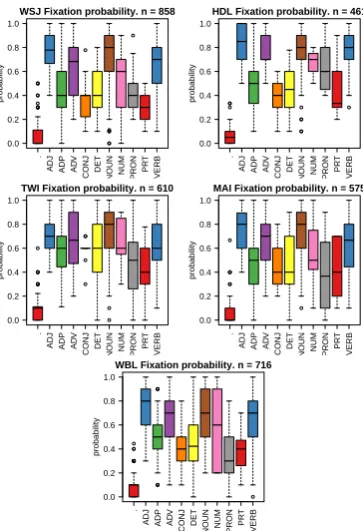
Figure 1: Fixation probability boxplots across five domains
The TWI data comes from the work of Foster et al. (2011). We mapped the gold labels to the 12 Universal POS (Petrov et al., 2011), but discarded the category X due to data sparsity.
Experimental design The 250 items were read
by all 10 participants, but participants read the items in one of five randomized orders. Neither the source domain for the sentence, nor the POS tags were revealed to the participant at any time. One sentence was presented at a time in black on a light gray background. Font face was Verdana and font size was 25 pixels. Sentences were centered vertically, and all sentences could fit into one line. All sentences were preceded by a fixation cross. The experiment was self-paced. To switch to a new sentence and to ensure that the sentence was actually processed by the participant, participants rated the immediate interest towards the sentence on a scale from 1-6 by pressing the corresponding number on the numeric keypad. Participants were instructed to read and continue to the next sentence as quickly as possible. The actual experiment was preceded by 25 practice sentences to familiarize the participant with the experimental setup.
Our apparatus was a Tobii X120 eye tracker with a 15” monitor. Sampling rate was 120 Hz binocular. Participants were seated on a chair ap-proximately 65 cm from the display. We recruited
10 participants (7 male, mean age 31.30±4.74))
from campus. All were native English speakers. Their vision was normal or corrected to normal, and none were diagnosed with dyslexia. All were skilled readers. Minimum educational level was an ongoing MA. Each session lasted around 40 minutes. One participant had no fixations on a few sentences. We believe that erroneous key strokes caused the participant to skip a few sentences.
Features There are many different features for
exploring cognitive load during reading (Rayner, 1998). We extracted a broad selection of cognitive effort features from the raw eye-tracking data in order to determine which are more fit for the task. The features are inspired by Saloj¨arvi et al. (2003), who used a similarly exploratory approach. We wanted to cover both oculomotor features, such as fixations on previous and subsequent words, and measures relating to early (e.g. first fixation du-ration) and late processing (e.g. regression desti-nations / departure points and total fixation time). We also included reading speed and reading depth features, such as fixation probability and total fix-ation time per word. In total, we have 32 gaze features, where some are highly correlated (such as number of fixations on a word and total fixation time per sentence).
Dundee CorpusThe main weakness of the
exper-iment is the small dataset. As future work, we plan to replicate the experiment with a $99 eye tracker for subjects to use at home. This will make it easy to collect thousands of sentences, leading to more robust gaze-based POS models. Here, instead, we include an experiment with the Dundee corpus (Kennedy and Pynte, 2005). The Dundee corpus is a widely used dataset in re-search on reading and consists of gaze data for 10 subjects reading 20 newswire articles (about 51,000 words). We extracted the same word-based features as above, except probability for 1st and 2nd fixation, and sentence-level features (in the Dundee corpus, subjects are exposed to multiple sentences per screen window), and used them as
features in our POS tagging experiments (§3).
Learning experiments In our experiments, we
Rank Feature % of votes
0 Fixation prob 19.0
1 Previous word fixated binary 13.7 2 Next word fixated binary 13.2
3 nFixations 12.2
4 First fixation duration on every word 9.1 5 Previous fixation duration 7.0 6 Mean fixation duration per word 6.6
7 Re-read prob 5.7
8 Next fixation duration 2.0
[image:3.595.71.298.66.185.2]9 Total fixation duration per word 2.0
Table 1: 10 most used features by stability selec-tion from logistic regression classificaselec-tion of all POS pairs on all domains, 5-fold cross validation.
0.50 0.55 0.60 0.65
Frequency 0.68
0.70 0.72 0.74 0.76 0.78
Fix. prob.
HDL MAI TWI WBL WSJ
(a) Content words
0.15 0.20 0.25 0.30
Frequency 0.42
0.44 0.46 0.48 0.50
Fix. prob.
HDL MAI TWI WBL WSJ
[image:3.595.75.286.248.334.2](b) Function words
Figure 2: Scatter plot of frequency and fixation probability for content words (NOUN, VERB, ADJ, NUM) and function words (PRON, CONJ, ADP, DET, PRT)
characteristics of a specific domain. Our tag
dic-tionary is from Wikdic-tionary3and covers 95% of all
tokens. 3 Results
Domain differences Our first observation is that
the gaze characteristics differ slightly across do-mains, but more across POS. Figure 1 presents the
3https://code.google.com/p/
wikily-supervised-pos-tagger/downloads/ list
NOUN VERB ADJ ADV NUM PRT ADP PRON CONJ DET . NOUNVERB
ADJ ADV NUMPRT ADP PRONCONJ DET.
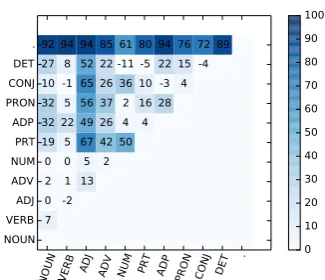
7 0 -2 2 1 13 0 0 5 2 19 5 67 42 50 32 22 49 26 4 4 32 5 56 37 2 16 28 10 -1 65 26 36 10 -3 4 27 8 52 22 -11 -5 22 15 -4 92 94 94 85 61 80 94 76 72 89
0 10 20 30 40 50 60 70 80 90 100
Figure 3: Error reduction of logistic regression over a majority baseline. All domains
fixation probabilities across the 11 parts of speech. While the overall pattern is similar across the five domains (open category items are more likely to be fixated), we see domain differences. For ex-ample, pronouns are more likely to be fixated in headlines. The explanation could lie in the dif-ferent distributions of function words and content words. It is established and unchallenged that function words are fixated on about 35% of the time and content words are fixated on about 85% of the time (Rayner and Duffy, 1988). In our data, these numbers vary among the domains according to frequency of that word class, see Figure 2. Fig-ure 2a shows that there is a strong linear correla-tion between content word frequency and content word fixation probability among the different
do-mains: Pearson’s ρ = 0.909. From Figure 2b,
there is a negative correlation between function word frequency and function word fixation
proba-bility: Pearson’sρ=−0.702.
Predictive gaze features To investigate which
gaze features were more predictive of part of speech, we used stability selection (Meinshausen and B¨uhlmann, 2010) with logistic regression classification on all binary POS classifications. Fixation probability was the most informative fea-ture, but also whether the words around the word is fixated is important along with number of fixa-tions. In our binary discrimination and POS tag-ging experiments, using L2-regularization or av-eraging with all features was superior (on Twitter data) to using stability selection for feature selec-tion. We also asked a psycholinguist to select a small set of relatively independent gaze features fit for the task (first fixation duration, fixation proba-bility and re-read probaproba-bility), but again, using all features with L2-regularization led to better per-formance on the Twitter data.
Binary discrimination First, we trained
L2-regularized logistic regression models to discrim-inate between all pairs of POS tags only using gaze features. In other words, for example we selected all words annotated as NOUN or VERB, and trained a logistic regression model to discrim-inate between the two in a five-fold cross
valida-tion setup. We report error reducvalida-tion acc−baseline
1−baseline
in Figure 3.
POS tagging We also tried evaluating our gaze
features directly in a supervised POS tagger.4 We
4https://github.com/coastalcph/
[image:3.595.105.268.588.728.2]SP +GAZE +DGAZE +FREQLEN +DGAZE+FREQLEN
HDL 0.807 0.822 0.822 0.826 0.843
MAI 0.791 0.831 0.834 0.795 0.831
TWI 0.771 0.787 0.800 0.772 0.793
WBL 0.836 0.854 0.858 0.850 0.861
WSJ 0.831 0.837 0.838 0.831 0.859
Macro-av 0.807 0.826 0.830 0.815 0.837
Table 2: POS tagging results on different test sets using 200 out-of-domain sentences for training.
DGAZEis using gaze features from Dundee. Best result for each row in bold face
trained a type-constrained (averaged) perceptron model with drop-out and a standard feature model (from Owoputi et al. (2013)) augmented with the above gaze features. The POS tagger was trained on a very small seed of data (200 sentences), doing 20 passes over the data, and evaluated on out-of-domain test data; training on four out-of-domains, testing on one. For the gaze features, instead of using to-ken gaze features, we first built a lexicon with av-erage word type statistics from the training data. We normalize the gaze matrix by dividing with its standard deviation. This is the normalizer in
Turian et al. (2010) withσ = 1.0. We condition
on the gaze features of the current word, only. We compare performance using gaze features to us-ing only word frequency, estimatus-ing from the (un-labeled) English Web Treebank corpus, and word
length (FREQLEN).
The first three columns in Table 2 show, that gaze features help POS tagging, at least when trained on very small seeds of data. Error reduc-tion using gaze features from the Dundee corpus
(DGAZE) is 12%. We know that gaze features
cor-relate with word frequency and word length, but using these features directly leads to much smaller performance gains. Concatenating the two fea-tures sets leads to the best performance, with an error reduction of 16%.
In follow-up experiments, we observe that aver-aging over 10 subjects when collecting gaze fea-tures does not seem as important as we expected. Tagging accuracies on raw (non-averaged) data are only about 1% lower. Finally, we also tried run-ning logistic regression experiments across sub-jects rather than domains. Here, tagging accura-cies were again comparable to our set-up, suggest-ing that gaze features are also robust across sub-jects.
4 Related work
Matthies and Søgaard (2013) present results that suggest that individual variation among (academ-ically trained) subjects’ reading behavior was not a greater source of error than variation within sub-jects, showing that it is possible to predict fixations across readers. Our work relates to such work, studying the robustness of reading models across domains and readers, but it also relates in spirit to research on using weak supervision in NLP, e.g., work on using HTML markup to improve depen-dency parsers (Spitkovsky, 2013) or using click-through data to improve POS taggers (Ganchev et al., 2012).
5 Conclusions
We have shown that it is possible to use gaze features to discriminate between many POS pairs across domains, even with only a small dataset and a small set of subjects. We also showed that gaze features can improve the performance of a POS tagger trained on small seeds of data.
References
Michael Collins. 2002. Discriminative training meth-ods for Hidden Markov Models. InEMNLP. Jennifer Foster, Ozlem Cetinoglu, Joachim Wagner,
Josef Le Roux, Joakim Nivre, Deirde Hogan, and Josef van Genabith. 2011. From news to comments: Resources and benchmarks for parsing the language of Web 2.0. InIJCNLP.
Marco R Furtner, John F Rauthmann, and Pierre Sachse. 2009. Nomen est omen: Investigating the dominance of nouns in word comprehension with eye movement analyses. Advances in Cognitive Psy-chology, 5:91.
Alan Kennedy and Jo¨el Pynte. 2005. Parafoveal-on-foveal effects in normal reading. Vision research, 45(2):153–168.
Franz Matthies and Anders Søgaard. 2013. With blinkers on: Robust prediction of eye movements across readers. In EMNLP, Seattle, Washington, USA.
Nicolai Meinshausen and Peter B¨uhlmann. 2010. Stability selection. Journal of the Royal Statis-tical Society: Series B (StatisStatis-tical Methodology), 72(4):417–473.
Matthias Nilsson and Joakim Nivre. 2009. Learning where to look: Modeling eye movements in reading. InCoNLL.
Olutobi Owoputi, Brendan O’Connor, Chris Dyer, Kevin Gimpel, Nathan Schneider, and Noah A Smith. 2013. Improved part-of-speech tagging for online conversational text with word clusters. In NAACL.
Slav Petrov, Dipanjan Das, and Ryan McDonald. 2011. A universal part-of-speech tagset. arXiv preprint arXiv:1104.2086.
K.; Rayner and S. A. Duffy. 1988. On-line compre-hension processes and eye movements in reading. In G. E. MacKinnon M. Daneman and T. G. Waller, editors, Reading research: Advances in theory and practice, pages 13–66. Academic Press, New York. Keith Rayner. 1998. Eye movements in reading and
information processing: 20 years of research. Psy-chological bulletin, 124(3):372.
Jarkko Saloj¨arvi, Ilpo Kojo, Jaana Simola, and Samuel Kaski. 2003. Can relevance be inferred from eye movements in information retrieval. InProceedings of WSOM, volume 3, pages 261–266.
Javier San Agustin, Henrik Skovsgaard, Emilie Mol-lenbach, Maria Barret, Martin Tall, Dan Witzner Hansen, and John Paulin Hansen. 2010. Evalua-tion of a low-cost open-source gaze tracker. In Pro-ceedings of the 2010 Symposium on Eye-Tracking Research & Applications, pages 77–80. ACM. Valentin Ilyich Spitkovsky. 2013.Grammar Induction
and Parsing with Dependency-and-Boundary Mod-els. Ph.D. thesis, STANFORD UNIVERSITY. Oscar T¨ackstr¨om, Dipanjan Das, Slav Petrov, Ryan
McDonald, and Joakim Nivre. 2013. Token and type constraints for cross-lingual part-of-speech tag-ging. TACL, 1:1–12.