Abstract—Single Nucleotide Polymorphisms (SNPs) are confirmed as a major factor in human genome polymorphisms, and are found to be suitable as a genetic marker for disease characteristics. Determining the relationship between disease complexity and SNPs requires complex genotyping for large SNP data sets, and is thus very expensive and labor-intensive. Tag-SNP selection is a useful technique for selecting the SNP subset from the original dataset with minimal errors, thus reducing the cost of genotyping. We propose a new method that combining strategy particle swarm optimization (SPSO) and Linkage Disequilibrium (LD) to select highly correlated SNPs. We use this strategy in PSO to select more optimal solutions and replace less accurate particles. The method is demonstrated using the HapMap dataset through evaluating the leave-one-out-cross-validation (LOOCV) and K-nearest neighbor (KNN) method. Experimental results show that our proposed method results in a smaller subset of tag SNPs and provides improved accuracy over PSO and other tag SNP selection methods.
Index Terms—Single Nucleotide Polymorphism, Particle
Swarm Optimization, Linkage Disequilibrium.
I. INTRODUCTION
ingle nucleotide polymorphisms (SNPs) are single changed nucleotides in a human gene. They also called the third DNA genetic marker, and are defined as the part of the nucleotide disparity between different groups with a distribution percentage greater than one percent [1]. In humans, three billion single nucleotides contain over fourteen million SNPs, with an average of two to three hundred single nucleotides producing an SNP. The existence of SNPs can be used to quantify diversity in human genetics. Studying complex diseases and the connections between SNPs requires genotyping the genome, a very complex process which can be very expensive for large SNP data sets. However, selecting a smaller useful subset of SNPs from the original SNP set (i.e., the tag SNP selection problem) can reduce the cost of the genotyping process.
Many methods exist for selecting tag SNPs, including MLR tagging [2], STAMPA [3], RLRP [4] and SVM/STSA [5]. Zhang et al. [6] proposed the genome body block, in
L. Y. Chuang is with the Chemical Engineering Department, I-Shou University, 84001, Kaohsiung, Taiwan. (e-mail: [email protected]).
W. L. Huang is with the Department of Electronic Engineering, National Kaohsiung University of Applied Sciences, 80778, Kaohsiung, Taiwan. (e-mail:[email protected]).
C. H. Yang is with the Network Systems Department, Toko University, 61363, Chiayi, Taiwan.
C. H. Yang is also with the Electronic Engineering Department, National Kaohsiung University of Applied Sciences, 80778, Kaohsiung, Taiwan. (corresponding author to provide phone: 886-7-3814526#5639; e-mail: [email protected]).
which the genome is split into mutually exclusive blocks, each with a haplotype block that defines 80 percent of variation in the swarm. This decreases the variability of each block resulting in a high degree of duplicate information in the blocks. This problem can be improved upon by placing all common haplotype SNPs in the block [7]. Lewontin et al. used linkage disequilibrium relationships between genomes [8], with the numerical disequilibrium (r2), calculated as the level of similarity between the SNPs, thus determining SNP relevance. For example r2 >= 0.8 [9, 10], signifies relevance, and this relevance is used to select SNPs. The advantages of these methods for SNP selection are deduced from the SNP relevance with genetic disease.
We propose a strategy particle swarm optimization (SPSO) to select tag SNPs. In the tag SNP selection problem, we search for the best SNP combination by increasing the number of tag SNPs. We find that some SNP combinations appear in the best solution when the number of tag SNPs increases but given its incapability of remembering the best solution in the next selection, general PSO may miss some SNP combinations in the next selection, thus reducing accuracy. Therefore we integrate into PSO a strategy to retain the latest search results for an optimal solution and replace less accurate particle. The SBPSO computational results demonstrate that the predictive ability of this approach is superior to PSO and other methods of tag SNP selection mentioned in the literature.
II. METHODOLOGY
A. Particle Swarm Optimization
Proposed by Kennedy and Eberhart in 1995 [11], particle swarm optimization (PSO) simulates the social behavior of organisms. For example, it models the behavior of birds as they randomly search for food in the search space, then optimizing their search direction based on experience and information shared among group members. In the search space, the search for the location of each particle will calculate the fitness value by a designed function. Particles are randomly generated and do not repeat through multiple iterations to determine the optimal goal. Each iteration considers particle speed and best fitness value (pbest) to date, and the group searches for the best fitness (gbest) value to date. This continues until the particle swarm finds the best solution or reaches the termination condition.
An Improved Particle Swarm Optimization for
Tag Single Nucleotide Polymorphism Selection
Li-Yeh Chuang, Wei-Li Huang, and Cheng-Hong Yang, Member, IAENG
Pseudo code for PSO
1: For each particles
2: Initialize particle 3: Do
4: For each particle 5: Calculate fitness value
6: If the fitness is better than pbest to date 7: Set the value as the new pbest
8: If the fitness is better than gbest to date 9: Set the value as the new gbest
10: End For 11: For each particle
12: Calculate particle velocity according to equation (1)
13: Update particle position according to equation (2)
14: End For
15: While maximum iterations or find the best solution
where, in dimension D, old id
x is the current position of particle i, old
id
v is the current speed of particle i, xidnew is the updated position of particle i, vidnew is the updated speed of particle i, (Pid−xidold) is the distance between pbest and gbest, and (Pgd−xidold) is the distance between gbest and
old id
x .
B. Strategy Particle Swarm Optimization
This strategy allows PSO to retain the optimal solution which can then be used to replace low accuracy particles as the number of tag SNPs increases. The strategy calculates the new combination in the iteration limit.
Figure 1. SPSO flow chart
C. Encoding
The data is constructed of Adenine (A), Cytosine (C), Guanine (G) and Thymine (T). Thus we conduct the conversion of major and minor as shown in Fig. 2.
Figure 2. Data set conversion
D. Linkage Disequilibrium
Linkage disequilibrium (LD) describes the correlation between different SNPs impacted by chromosomal rearrangements. Figure 3 shows no chromosomal recombination occurring between SNP1 and SNP2. This phenomenon is referred to as high LD, while an apparent chromosomal recombination between SNP1 and SNP5 is called low LD. Generally, low LD occurs more frequently when the distance between two SNPs is reduced. The LD test can determine the level of LD between the SNPs using r2, which is calculated as follows:
(
A) (
B B)
A P P P
P D r − − = 1 1 2 2 (3)
where PA and PB are two SNPs on the proportion of major single nucleotides, PAB is the proportion of a major single nucleotide for PA and PB, and D= PAB
−
PAPB.(
)
(
) (
)
1 6 1 6 5 6 1 6 5 6 5 6 5 6 5 1 1 2 2 2 12 = × + × × − = − − − = B B A A B A AB P P P P P P Pr
(
)
(
) (
)
2 . 0 6 3 6 3 6 1 6 5 6 3 6 5 6 3 1 1 2 2 2 15 = × × × × − = − − − = B B A A B A AB P P P P P P P r Figure 3. Linkage disequilibrium calculation diagram The value calculated by Eq. (1) is between 0 and 1. The closer the value is to 1, the higher the LD between the two SNPs. Figure 3 shows the calculation of the LD level(
)
(
old)
id gd old id id old id new
id w v c r P x c r P x
v = × + 1× 1× − + 2× 2× − (1)
new id old id new
id
x
v
x
=
+
(2)2 12
r is the LD value of SNP1 and SNP2 2
15
between different SNPs. A value of r2>=0.8 indicates a high LD between two SNPs. LD is used to filter the data, and the five SNPs displayed in Fig. 3 are thus reduced to the three SNPs shown in Fig. 4.
Figure 4. Filtered data
E. Initialization
This study uses decimal encoding to design particles. During initialization, half of the swarm particles are created based on LD, while the other half is randomly generated. At initialization, each particle’s tag SNP is unique, as shown in Fig. 5.
Figure 5. Particle initialitation
F. K-nearest neighbor
The K-nearest-neighbor (K-NN) method was proposed by Fix and Hodges in 1951 [12]. In this study, all data were used as test data in the fitness evaluation, then classified according to the particles' SNP, and K-NN was used to select the K data nearest to the test data. These K data were used to produce the new data set following the majority decision diagram (as shown in Fig. 6).
Figure 6. Majority decision diagram for K=3 G.Fitness function
In this study, the fitness function uses the 3-NN with
leave-one-out-cross-validation (LOOCV) to obtain the correct number of each test data set by K-NN until all data have been tested. By summing the number of correct times of each data set, we obtain the fitness value by Eq. (4):
% 100 )
( ×
× − × =
c r c r
total i
D T D D
M F
P (4)
where P(Fi) is the fitness of each particle, Mtotal is total correct number, Dr is the column number of the data sets, Dc is the row number of the data sets, and Tr represents the selected tag SNP.
H.Updating particle location and speed
Particles update their locations using the inertia weight, previously speed, pbest, gbest, c1 and c2, as in Eq. (1) and Eq. (2).
III. RESULTS AND DISCUSSION
A.Data set description
Four published experimental SNP data sets were downloaded from HAPMAP (http://www.hapmap.org) for evaluation.
A.) ENCODE Regions from HAPMAP
We used regions ENr123 and EMm010 from two populations of the ENCODE project (2005): the Chinese and Japanese populations of Beijing (HCB) and the Japanese population of Tokyo (JPT) [13]. We used 90 genotypes of the parents for regions ENm013, ENr112 and ENr113 from 30 CEPH family trios obtained from HapMap. The data was collected from chromosomes 7q21.13, 2p16.3 and 4q26. The number of SNPs genotyped in each region was 376, 439 and 523, respectively.
B.) Chromosome 5q31
Data sets from Daly et al. (2001) [14] were derived from the 616 kilobase regions of human chromosome 5q31 from 129 family trios.
C.) Other Gene Regions from HAPMAP
We used two sets of SNPs spanning the two genes STEAP and TRPM8 collected from 30 CEPH family trios. The number of SNPs in each region was 37 and 101, respectively. B.Parameter setting
The termination condition of the SPSO in this study was 300 iterations. Parameters of the particle swarm optimization algorithms were as follows: particle size 50, inertia weight 0.9, maximum speed 6, and minimum speed 6. For the acceleration (learning) factors c1=c2=2.
C.Results and discussion
TABLEI
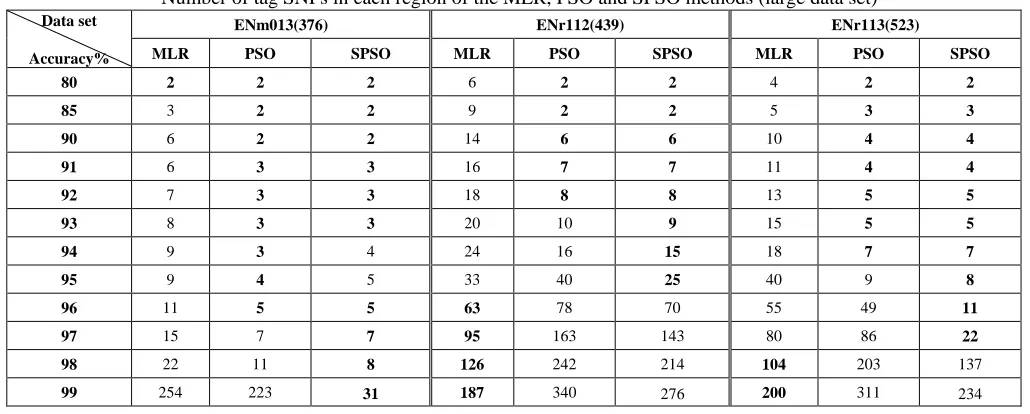
NUMBER OF TAG SNPS IN EACH REGION OF THE MLR,PSO AND SPSO METHODS (LARGE DATA SET)
These six data sets can be divided into two Tables. Table I contains the three smaller data sets (STEAP, TRPM8 and 5q31), and four methods were applied to test these data sets. When only one SNP was selected, the prediction accuracy of the proposed method reached 97%, 91% and 90%, respectively for STEAP, TRPM and 5q31, a clear improvement over the SVM/STSA method. In our experiment, the proposed method outperformed SVM/STSA for equal numbers of tag SNPs.
Table II presents the three larger data sets: ENm013, ENr112 and ENr113. Since no data was provided for the SVM/STSA method, only the SPSO, PSO and MLR-tagging methods were applied to these test data sets. The number of tag SNPs selected by the proposed method was much smaller than those selected for MLR-tagging. The prediction accuracy of the proposed method for thirty-one SNPs was 99%, 93% and 95%, respectively for ENm013, ENr112 and ENr113.
Tables III and IV show the average prediction accuracy for the regions ENr123 and ENm010 from two populations (Chinese and Japanese) obtained by four different methods,
(MLR, STAMPA, PSO and SPSO), for fixed numbers of tag SNPs (2, 5, 10, 15, 20 and 25). The proposed method outperformed the average MLR and STANPA predictions for ENr123 and ENm010. In most cases the proposed method obtained the highest prediction accuracy.. Exceptions included tag SNP number 25 (MLR) for the ENm010 data set of the Chinese population, and tag numbers 20 and 25 (MLR) for the ENm010 data set of the Japanese population. However the differences in the accuracy obtained in these cases were marginal at about 0.3%. Tables III and IV also indicate that, given a small number of tag SNPs, the proposed method achieves prediction accuracy significantly better than that of the MLR and STAMPA methods, with MLR again outperforming STAMPA in both populations. With only two tag SNPs, the prediction accuracy of the proposed method reached 97% and was generally much higher than that obtained by the other methods. Selecting a higher number of tag SNPs increased the higher prediction accuracy for all three methods. Given a small number of tag SNPs, STAMPA returned the lowest the prediction accuracy of all the methods tested.
TABLEII
Number of tag SNPs in each region of the MLR, PSO and SPSO methods (large data set)
ENm013(376) ENr112(439) ENr113(523)
Data set
Accuracy% MLR PSO SPSO MLR PSO SPSO MLR PSO SPSO
80 2 2 2 6 2 2 4 2 2
85 3 2 2 9 2 2 5 3 3
90 6 2 2 14 6 6 10 4 4
91 6 3 3 16 7 7 11 4 4
92 7 3 3 18 8 8 13 5 5
93 8 3 3 20 10 9 15 5 5
94 9 3 4 24 16 15 18 7 7
95 9 4 5 33 40 25 40 9 8
96 11 5 5 63 78 70 55 49 11
97 15 7 7 95 163 143 80 86 22
98 22 11 8 126 242 214 104 203 137
99 254 223 31 187 340 276 200 311 234
STEAP(37) TRPM8(101) 5q31(103)
Data set
Accuracy% MLR SVM PSO SPSO MLR SVM PSO SPSO MLR SVM PSO SPSO
80 1 1 1 1 1 1 1 1 1 1 1 1
85 1 1 1 1 2 1 1 1 2 1 1 1
90 1 1 1 1 4 2 1 1 5 3 1 1
91 2 1 1 1 5 5 1 1 7 3 2 2
92 2 1 1 1 5 5 2 2 7 4 2 2
93 2 1 1 1 6 6 2 2 9 5 2 2
94 2 1 1 1 7 7 2 2 13 6 2 2
95 2 2 1 1 8 8 2 2 16 8 4 2
96 3 2 1 1 10 10 2 2 21 10 5 3
97 3 2 1 1 15 15 2 2 31 22 5 4
98 4 2 2 2 15 15 2 2 41 42 13 5
[image:4.595.38.553.568.775.2]TABLEIII
COMPARSION OF ACCURACY OBTAINED BY MLR,STAMPA,PSO AND SPSO FOR A FIXED NUMBER OF TAG SNPS (2,5,10,15,20,25) FOR REGIONS ENR123
AND ENM010 FROM TWO POPULATIONS (CHINESE).
Accuracy(%) for Han Chinese Number
ENr123 (63) ENm010 (105)
Tag SNP MLR STAMPA PSO SPSO MLR STAMPA PSO SPSO
2 80.3 74.4 97.7 97.8 81.4 79.2 97.3 97.3
5 92.8 90.3 98.9 99.1 93.8 90.9 98.8 98.8
10 98.1 93.7 99.7 99.8 98.0 95.3 99.1 99.2
15 99.2 95.2 99.7 100.0 99.4 96.8 99.1 99.5
20 99.8 96.0 99.9 100.0 99.8 98.1 99.3 99.6
25 99.9 96.9 100 100.0 100.0 98.6 99.4 99.6
average 95.0 91.1 99.3 99.5 95.4 93.2 98.8 99.0
TABLEIV
COMPARSION OF ACCURACY OBTAINED BY MLR,STAMPA,PSO AND SPSO FOR A FIXED NUMBER OF TAG SNPS (2,5,10,15,20,25) FOR REGIONS ENR123
AND ENM010 FROM TWO POPULATIONS (JAPANESE ).
Accuracy (%) for Japanese Number
ENr123 (63) ENm010 (105)
Tag SNP MLR STAMPA PSO SPSO MLR STAMPA PSO SPSO
2 93.5 89.5 98.3 98.3 81.4 79.2 97.2 97.2
5 95.5 93.8 98.7 99.2 93.8 90.9 98.9 99.1
10 96.8 95.6 99.3 99.4 98.0 95.3 99.4 99.4
15 97.9 96.0 99.4 99.6 99.4 96.8 99.6 99.6
20 98.9 96.6 99.6 99.8 99.8 98.1 99.5 99.7
25 99.5 96.9 99.7 99.8 100.0 98.6 99.7 99.8
average 97.0 94.7 99.1 99.4 95.4 96.1 99.0 99.1
We propose a strategy particle swarm optimization (SPSO) which retains the best combination to increase the quality of the initial particle which is important in PSO for selecting the tag SNPs. In this study, the search number of tag SNP starts from two SNPs and increases incrementally when searching the tag SNP. Our proposed strategy first uses brute force to find the best five combinations of two SNPs prior to PSO execution. Second, we use the best combination to individually collocate any number of data dimensions and save the best five combinations, which then replace the worst five particles following initialization. Third, when the particle search obtains a new combination with accuracy higher than the best five combinations, the new combination replaces the worst-performing of the best five combinations. This continues iteratively with the best five combinations repeating until the termination conditions are met in the next initialization.
The proposed strategy can be used in tag SNP selection problem. The persistence of the initially-selected SNP combination through to the termination condition may reduce accuracy, but integrating the proposed strategy into PSO allows PSO to remember the best solution and obtain better particles after initialization. PSO also can improve the shortcomings of the proposed strategy by particles movement, thus obtaining superior results. Incorporating the proposed strategy increased total computing time by about 5% and, following Eq. (5), computing time will increase with the amount of data in the operation.
where T is the calculation time and n are the data dimensions.
As seen in Table II, larger data sets obtain better results. However, the brute force test shows that the best combination (two SNPs) collocating a number of data dimensions can produce the most accurate combination in the next iteration (three SNPs). However, the fact that this did not occur consistently for all data sets confirms the correctness of our theory.
In the parameter settings, the particle goes through three hundred times iterations in each re-initialization. In each iteration, if find the gbest is improved, the iteration count is reset to give the particle enough opportunities to find a better solution. The result tables shows that combining PSO with our strategy improves the original PSO search results within the same number of iterations and provides slightly better results than SVM/SATA, MLR and STAMPA, but is sometimes inferior to MLR. For example, in the large data sets presented in Table II, an increase in MLR accuracy in the ENr112 and ENr113 data sets requires the SNP volume to gradually fall below that used in our proposed method. However, for 99% of the ENm013 samples, our proposed method only requires 31 SNPs, which is considerably fewer than are required by MLR. This may result in these two assessment methods obtaining higher accuracy ratings than other leading methods in particular data sets but, overall, our proposed method provides the best results for most of the data sets.
IV. CONCLUSIONS
We present a novel approach to tag SNP prediction based on strategy particle swarm optimization (SPSO) evaluated by with K-nearest neighbor (K-NN). The experiment used genotype information taken from the HapMap project and compared the proposed method with leading tag SNP selection algorithms. The proposed method consistently
2
)
1
(
n
n
identified tag SNPs with greater accuracy than SVM, MLR and STAMPA. A key concern was whether SPSO can improve the accuracy of PSO when using our proposed strategy. Though the proposed method and PSO obtained somewhat similar results, the advantages of SPSO became clear on more complex data sets, showing that the proposed method outperforms PSO and other methods in the tag SNP selection problem.
REFERENCES
[1] V. Onay, L. Briollais, J. Knight, E. Shi, Y. Wang, S. Wells, H. Li, I. Rajendram, I. Andrulis, and H. Ozcelik, "SNP-SNP interactions in breast cancer susceptibility," BMC cancer, vol. 6, pp. 114, 2006. [2] J. He and A. Zelikovsky, "MLR-tagging: informative SNP selection for
unphased genotypes based on multiple linear regression," Bioinformatics, vol. 22, pp. 2558, 2006.
[3] E. Halperin, G. Kimmel, and R. Shamir, "Tag SNP selection in genotype data for maximizing SNP prediction accuracy," Bioinformatics, vol. 21, pp. 195, 2005.
[4] J. He, K. Westbrooks, and A. Zelikovsky, "Linear reduction method for predictive and informative tag SNP selection," International Journal of Bioinformatics Research and Applications, vol. 1, pp. 249-260, 2005. [5] B. V. Halldorsson, V. Bafna, R. Lippert, R. Schwartz, F. M. De La
Vega, A. G. Clark, and S. Istrail, "Optimal haplotype block-free selection of tagging SNPs for genome-wide association studies," Genome Research, vol. 14, pp. 1633, 2004.
[6] K. Zhang, Z. Qin, T. Chen, J. S. Liu, M. S. Waterman, and F. Sun, "HapBlock: haplotype block partitioning and tag SNP selection
software using a set of dynamic programming algorithms," Bioinformatics, vol. 21, pp. 131, 2005.
[7] V. Bafna, B. V. Halldorsson, R. Schwartz, A. G. Clark, and S. Istrail, "Haplotypes and informative SNP selection algorithms: don't block out information," Proceedings of Discrete Mathematics and Theorctical Computer Sciense Workshop on SNP, pp. 19-27, 2003.
[8] R. C. Lewontin, "The Interaction of Selection and Linkage. I. General Considerations; Heterotic Models, "Genetics, vol.49,pp. 49-67, 1964. [9] C. S. Carlson, M. A. Eberle, M. J. Rieder, Q. Yi, L. Kruglyak, and D. A.
Nickerson, "Selecting a maximally informative set of single-nucleotide polymorphisms for association analyses using linkage disequilibrium," The American Journal of Human Genetics, vol. 74, pp. 106-120, 2004. [10] G. Sywerda, "Uniform crossover in genetic algorithms," Proceed of the third international conference in genetic algorithms table of contents, pp. 2-9, 1989.
[11] H. Yoshida, K. Kawata, Y. Fukuyama, S. Takayama, and Y. Nakanishi, "A particle swarm optimization for reactive power and voltage control considering voltage security assessment," Power Systems, IEEE Transactions on, vol. 15, pp. 1232-1239, 2000.
[12] E. Fix, and J. L. Hodges, "Discriminatory analysis. Nonparametric discrimination: Consistency properties," International Statistical Review/Revue Internationale de Statistique, vol. 57, pp. 238-247, 1989.
[13] R. A. Gibbs, J. W. Belmont, P. Hardenbol, T. D. Willis, F. Yu, H. Yang, L. Y. Ch'ang, W. Huang, B. Liu, and Y. Shen, "The international HapMap project," Nature, vol. 426, pp. 789-796, 2003.
[14] M. J. Daly, J. D. Rioux, S. F. Schaffner, T. J. Hudson, and E. S. Lander, "High-resolution haplotype structure in the human genome," Nature genetics, vol. 29, pp. 229-232, 2001.