Abstract—The current state of the world economy has made Software-as-a-Service (SaaS) an appealing concept for organizations with a small budget for IT infrastructure investment. In a SaaS setup, companies subscribe software applications on a pay-per-use system from external service providers over the internet. However, these companies are looking for a decision framework that can be used to prioritize business software applications for SaaS migration. This paper attempts to fill in this gap by proposing a hybrid methodology which is composed of a total system life cycle (SLC) cost analysis for cost estimation and the analytic network process (ANP) for prioritization. Real test case data is used to validate the decision making capability of the framework. Sensitivity analysis was done to determine the robustness of the recommendations using Monte Carlo simulation. Results show that the proposed methodology could aid managers prioritizes software application projects for SaaS migration.
Index Terms— ANP, Business Applications, Monte Carlo Simulation, SaaS, System Life Cycle Cost
I. INTRODUCTION
he recent advances in Cloud Computing (CC) lead to fundamental paradigm shift in the way information technology (IT) support the complex business systems. Given this setup, instead of investing on a fully fledged in-house IT infrastructure, companies would just subscribe business applications like office applications on a pay-per-use system from external service providers over the internet. With the current state of the economy, CC could be an appealing concept to companies with limited IT infrastructure budget. An example of this setup would be Salesforce.com’s Customer Relationship Management (CRM) solution. Clients subscribed to this service would just avail of these CRM applications on a computer workstation that has internet access, thereby eliminating the need to install, configure and maintain an in-house comprehensive Enterprise CRM software solution within the company.
Manuscript received March 6, 2012; Revised March 31, 2012
E. L. Jalao is a PhD student of Industrial Engineering from Arizona State University. He is also an assistant professor on study leave from the University of the Philippines, Industrial Engineering Department where he obtained both his BS and MS degrees in Industrial Engineering. e-mail: [email protected]).
D. L. Shunk is a Professor of Industrial Engineering at the Arizona State University. He is currently pursuing research into collaborative commerce, global new product development, model-based enterprises and global supply network integration.
T. Wu is an associate professor in Industrial Engineering Program at School of Computing, Informatics, Decision Systems Engineering of Arizona State University. She is NSF CAREER award winner (2003) and ASU tenure and promotion exemplar (2006)
Cloud computing implementations can be based on the type of IT service systems that service providers supply. The three major types of implementations are: Software-as-a-Service (SaaS), Platform-as-a-Service (PaaS), or Infrastructure-as-a-Service (IaaS) [1] In a SaaS system, clients connect to a remote software application installed in a virtual server provided by a supplier through the internet. In a PaaS implementation in contrast, service providers supply a blank virtual server to a client and that client is responsible for installing and licensing any applications that they need. Moreover in IaaS, the service provider simply provides a virtual disk space in which the client loads the operating system and applications in it. A study by Forrester researcher Reid, et al. [2], forecasted that on the year 2015, the entire cloud computing market would be valued at $100 billion, and $80 billion of it would be SaaS alone. Furthermore, according to a survey done by AMR, approximately 70% of 639 companies expect to implement SaaS within their business processes [3]. There also exist other minor service models like Data-as-a-Service (DaaS) or Business-as-a-Service (BaaS) [4] however they only account for small portion of the market share of CC as compared to the SaaS, PaaS and IaaS.
SaaS is seen as a possible replacement to traditional software or commercial off-the-shelf (COTS) software. In a COTS setup, companies procure perpetual licenses, installs and maintains all necessary hardware, software and other technical infrastructure along with expensive IT personnel in-charge of maintaining the software [5]. As compared to COTS, companies that go with SaaS implementations have benefits like: low initial and subscription costs, fast implementation, lack of the necessity to install software, accessible anywhere, no associated upgrade and license costs, continuous access to new upgrades and the predictability of costs [6]. Conversely, Lu et al. [7] pointed out that SaaS has also disadvantages that could hinder the adoption of companies specifically: the lack personalization or customization of software, stringent requirements for stable network service and issues on data security and reliability.
It is agreed in literature that non-critical business applications are the prime candidates to be migrated to the cloud, while critical business applications are kept in-house. To illustrate this concept, consider the business applications of a typical healthcare organization. A business information system that keeps electronic medical records of patients cannot be easily migrated to a public domain since they contain sensitive information about patients and thus must be deployed within the boundaries of the organization.
Prioritization of Applications for
Software-as-a-Service Migration Using Total Life Cycle Costs
and the Analytic Network Process
Eugene Rex L. Jalao, Dan L. Shunk, and Teresa Wu
However, an online appointment system for patients seeking treatment could be implemented without difficulty on a public cloud without issues. Staten [8], noted that organizations migrate three types of business applications to the cloud, specifically: R&D projects, Low-Priority Business Applications, and Web-based Collaboration Services. Marston et al. [9] argued that organizations are looking for guidance in order to decide which business applications are best positioned to be migrated to SaaS (i.e. how are applications to be divided between in-house and on the Cloud). This would be the main focus of this article.
Given this premise, this paper focuses on two original contributions: (1) to estimate the total system life cycle (SLC) cost of each business application and (2) to provide a decision framework to that can provide recommendations for companies to decide on which business applications should be migrated to SaaS based on the estimated total SCL costs and technical SaaS adoption factors.
The rest of the paper is organized as follows: section II provides a review of related literature on SaaS adoption, while section III provides an overview of the proposed business application prioritization model. The test case validation of the model section is shown in section VI. A sensitivity analysis section provides robust analysis of the proposed methodology in section V while section VI concludes the article.
II. LITERATURE REVIEW
In order for companies effectively prioritize their business applications for SaaS migration; managers must consider the relevant decision criteria to eventually make the decision. There exists literature [10-12] that examined CC migration methodologies on a purely financial perspective. The paper by Khajeh-Hosseini et al. [13] identified several cost items that are relevant in determining the total SLC cost whenever a business application is migrated to SaaS. These costs are: 1) Operating Costs: The cost of running a CC instance for 1 hour, 2) Storage Costs: The cost of storing 1GB of data for a month, 3) Input and Output Requests: The cost of an input and output request from storage and 4) Data Transfer Costs: The cost of transferring 1GB of data into and out of the cloud. However, these articles focused on estimating costs that occurred when the software system is already operational. There might be other significant cost items that could affect the migration decision of a business application. Therefore, an analysis of the total system life cycle cost of a business application must be done to account for all relevant cost items.
By definition, a life cycle can be described as an abstract functional model that represents the conceptualization of a need for the system, its realization, utilization, evolution and disposal [14]. Song [15] proposed a system life cycle (SLC) model of a whenever a business application is migrated to a SaaS environment. The SLC is composed of five distinct phases specifically: (1) Requirements Definition, (2) Development, (3) Deployment, (4) Operation and (5) Retirement Phases. Within these phases, Pallman [16] identified three types of hidden costs that need to be accounted for in the computation of the SLC Cost. The identified costs were: (1) Internet Bandwidth Costs: the additional cost of bandwidth needed for successfully
implementing SaaS, (2) Monitoring Costs: the additional cost of monitoring the health of the applications and its performance and (3) Idle Usage Costs: the costs of underutilized files and suspended applications in the cloud. Furthermore, Heitler [17] also identified several additional costs with regards to the deployment of SaaS solutions specifically (1) cost of consultants to implement the system, produce custom reports, and upgrades, (2) costs of downtimes over the life of the systems, (3) costs to backup data, (4) costs of integration with other software and (5) costs of staff changes within the organization. Tonsetic [18] also identified ten hidden costs and classified then into four categories specifically: (1) one-time migration costs, which are composed of retrofitting costs for existing applications for cloud migration and existing IT infrastructure depreciation write-offs, (2) billing model limitations which are similar to Khajeh-Hosseini’s identified costs, (3) retained management costs like security, backup and resource scaling costs and (4) risk premium costs associated with the disposal and/or migration to a private setup or to another service provider.
Organizations nowadays have to consider other relevant technical factors apart from analyzing the problem from a purely financial standpoint. Benlian [19] noted that companies migrate to SaaS solutions when the (1) application is less specific (standardized software), has less strategic relevance (supporting less critical parts of the company) and has low adoption uncertainty (low economic and technical risk). Other papers [20, 21] identified four key factors specifically: (1) size of IT resources, (2) utilization pattern of resources, (3) sensitivity of data, and (4) criticality of work done by the company. Furthermore, a majority of these decision criteria are nominal or categorical in nature. A normalization scheme must be proposed to assign appropriate quantitative values for rating business applications on each factor to determine their applicability for SaaS migration.
composite priorities or weights. Nevertheless, interdependencies between decision criteria were not accounted for in the AHP since not all decision criteria can be structured in a hierarchical fashion.
Yet these adoption models only determine whether or not the entire organization should adopt cloud computing as a whole. It does not determine which business applications should be prioritized for a SaaS implementation. Based on current literature, the structure of the decision criteria that is used for the problem, and the problem being an MCDM type of problem, Saaty’s Analytic Network Procedure (ANP) [24] can be utilized to solve the problem. The ANP is an improvement of Saaty’s AHP where interdependencies of decision criteria and alternatives are addressed since the decision is structured as a network as opposed to a hierarchy. Similar to the AHP, the ANP determines the relative importance of a set of criteria and alternatives in a multi-criteria decision problem. The process utilizes pairwise comparisons of the alternatives as well as pairwise comparisons of the multiple criteria in terms of a network.
III. PROPOSED METHODOLOGY FRAMEWORK
This paper proposes a hybrid methodology for prioritizing business applications for SaaS migration. The model takes in as input a set of business applications
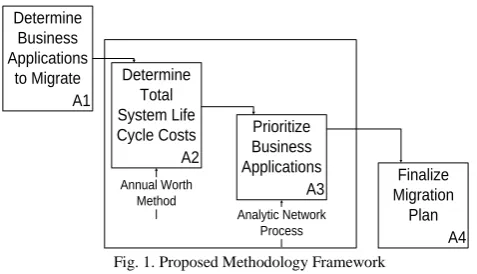
1,2… to be considered for migration. The total SLC cost of each business application is estimated based on the investment costs, operating and maintenance costs and its salvage or disposal values over its total life cycle. Furthermore, after estimating the total SLC costs, this factor is included in an ANP decision model that considers other technical criteria 1,2 … , . The output of the ANP decision model is a set of composite priorities for each of the business applications for SaaS migration. Figure 1 summarizes the proposed system in IDEF0 format.
The two main components of the proposed framework is described in detail in the following subsections in terms of estimating the total SLC cost and the application of the ANP.
A. Estimating Total SLC Cost of Each Business Application
Cost incurred when migrating business applications to a SaaS environment is one of the main factors that need to be considered as suggested by literature. To prioritize business applications to be migrated to SaaS, a total SLC cost analysis must be done to determine the total life cycle cost of each potential business application. The estimated total cost will be included in the next decision phase which utilized the ANP.
Based on the review of literature on the identified costs associated with SaaS migration, we define the costs 1, … , 1, … , , as the set of estimated costs incurred by the business application over its life cycle where
is the amount of the cost for line item occurring at
time . The NPV at a discounting rate is computed as follows:
1
The AW equivalent is calculated by: 1
1 1
Where 1 1 1 is called the capital recovery factor that relates the NPV to an annualized equivalent for periods. Given that the business applications can have different lifespan, the AW method is the appropriate tool to compare alternatives that have different study periods [25]. These values are then used in the ANP for the prioritization process which includes other non financial criteria.
B. Analytic Network Process Steps
Although the annualized worth of total SLC costs for implementing SaaS for a business application can be obtained from the previous phase, other relevant decision criteria need to be considered in prioritizing business applications. This section describes the proposed Analytic Network Process to determine the relative priorities for the set of business applications in six steps. The ANP is then applied to a set of technical, non financial criteria 1,2 … , that an organization considers to be of relevance for the goal of determining priorities for the set of business applications.
The steps of the ANP utilized in this paper are consistent with existing literature [24] however; a normalization scheme is proposed to score each business application on each criterion [26]. This is due to the fact that each criterion could have different units of measurement and thus would be an issue for computing the total weights. The proposed normalization heuristic was also done to reduce the number of pairwise comparisons. We define a rating of business application on criteria where 1,1 . A value 1
means that business application in terms of criteria should not be migrated to a SaaS service provider, while a value 1 means that business application in terms of criteria should absolutely be migrated to the cloud. To obtain the ratings from categorical data, the normalized scores are computed as follows:
1
Where is the raw score or unconverted score of application on criteria , is the best score across
criteria , while is the worst score across criteria . This normalization scheme guarantees that the best score will have a score of 1 while the worst score will have
a score of Furthermore, after normalization, all the
criteria can be compared with each other since they now have a common measurement scale.
A1 Determine
Business Applications
to Migrate
A2 Determine
Total System Life Cycle Costs
Annual Worth
Method A3
Prioritize Business Applications
Analytic Network Process
A4 Finalize Migration
[image:3.595.41.280.483.620.2]Plan
The relative priorities for each business applications are expressed as an vector that denotes the priorities of the aforementioned applications to be migrated to a SaaS environment. In this study, we assume that there is only one sub network of criteria. Any criteria within the sub network can be easily extended and is subject to further study.
IV. TEST CASE VALIDATION OF THE MODEL
The proposed methodology was applied to real data to illustrate its decision making capabilities. A leading healthcare facility in the Philippines was used as a test case. The hospital is a 609-bed tertiary, privately owned hospital with a total 605 active and 178 staff physicians. Currently, several business processes from in-house implementation are being considered by management for migration. Table 1 summarizes the current business applications that the hospital is considering migrating and their corresponding descriptions.
A. Estimating AW of the Total SLC Cost
This section illustrates the computation of the AW of the SLC cost of the business applications and the laboratory information system was used as an example. Based on desired management outcomes, the laboratory information system must be available 24-7 for lab technicians to accomplish work requests, must be able to handle fluctuations of demand during weekdays and must accommodate the proposed department expansion in the next 2 years. It was agreed that the application will be active for 5 years (60 months) until a reevaluation of the business application service is done. Based on the nature of the application, table 2 summarizes the estimated cost items that will be incurred during the lifespan of the application at a MARR of 12% compounded annually as determined by the hospital management.
The computation of the NPV and AW is presented as follows:
1
894,467 5
1
1 1 894,467 5
1 12 1 12 1 12
248,133 86
The AW of the other applications was calculated similarly and is summarized in table 3. Based on the AW criterion,
the laboratory information system should be prioritized first since it has the lowest AW, while the digitalized ultrasound data storage system is least prioritized for SaaS migration. However, other technical factors must be included in the prioritization process since an alternative might me financially feasible but not technically feasible.
B. Application of the Analytic Network Process for SaaS Migration
Management also decided in considering four other technical factors to prioritize the aforementioned business applications. Table 4 summarizes the decision criteria along with the recommended categorical data values for a SaaS migration. The ANP is then applied to the given set of business applications , , , , and decision criteria , , , , . An information technology (IT) prioritization committee composed of three members was interviewed and the necessary data for the ANP was elicited. The committee is composed of representatives from the Radiology Department, Nursing Department and the IT department. These people were considered the experts within the company since they have vested interests in the prioritization of these applications. The steps of the ANP are presented as follows:
Step 1: Determine Relative Priorities of Criteria. For the SaaS prioritization problem, each committee member conducted individual assessments and the geometric mean was calculated and was used as input for the ANP [27]. By answering the committee, ―By comparing two decision
TABLE1
LIST OF BUSINESS APPLICATIONS CONSIDERED FOR MIGRATION
Business Application Description
Housekeeping Scheduling System (HS)
A scheduling system that monitors staffing levels of room cleaners for the entire hospital. Also contains cleaning orders on rooms, list of cleaning personnel and shift schedules.
Radiology Information System (LIS)
An information system that records the hospital xray, MRI, CT and ultrasound sections.
Laboratory Information System (LIS)
An information system that records the hospital laboratory work requests
Digitalized Ultrasound Data Storage (DS)
Storage of data obtained from patients undergoing any time of ultrasound treatment.
Hospital Information Management System (IMS)
Consists of two main modules: Patient Management and Electronic Medical Records
TABLE2
LIFE CYCLE COST ITEMS FOR THE LABORATORY INFORMATION SYSTEM
Cost Element Description Estimated Cost
Development Cost
Cost of developing the online application which includes developer costs and installation costs
PhP 256,000
Consultant Maintenance Cost
Cost of maintaining and troubleshooting the application once in production
PhP 5,000 / month
Running Hours (1 Instance, Windows)
The cost of running Windows OS and SQL server in the virtual machine per hour
PhP 3,168/ month
Storage Costs Cost of storing on average 250
Gb in the cloud per month PhP 1,100/ month
I/O Requests
Cost of an input or output request to read or query data from the cloud
Negligible
Data Transfer Costs
Cost of sending and receiving approximately 500 Gb from the client to the cloud per month
PhP 4,180/ month
Salvage Costs
Estimated Cost of Salvaging or
Disposing of the Service PhP 100,000 Hardware &
Software
Existing hardware and
Software will be used N/A
TABLE3
ESTIMATED LIFE AND AWOF THE BUSINESS APPLICATIONS
Business Application Estimated Life Estimated AW Housekeeping Scheduling System
(HS)
6 years 336,781 12
Radiology Information System (RIS)
6 years
312,458 54
Laboratory Information System (LIS)
5 years 248,133 86
Digitalized Ultrasound Data Storage (DS)
4 years 378,458 68
Hospital Information Management System (IMS)
criteria and , which is more important, and by how much?‖ the following relative priorities in matrix
were obtained. The responses were tabulated in an matrix as follows:
1 2 31 1 26 1 26 7 96 23 1 61 2 4 58 79 1 63 1 1 8 65 79 5 1 1 7 96 13 22 12 13 1
The priorities were obtained from using the
standard ANP methodology and are presented as follows: 318 825 284 2841 315
Step 2: Determine Consistency of Criteria Weights.
Although the relative importance of each criterion was obtained, further analysis must be done to determine if the criteria priorities are consistent. Consistency in simple terms can be expressed as: ―if a criterion A is more important than
B, and B is more important than C, then A is also more important than C.‖ Saaty [23] proposed threshold values of
called the Random Index that determine whether the matrix is consistent. The consistency of matrix was computed as follows:
438
1 12 391
If 1, is consistent and the algorithm proceeds to step 3, otherwise, a new set of pairwise comparisons must be obtained from the committee in step 1 until a consistent matrix is obtained. It was observed that since 391 1, the was assumed to be
consistent enough and the algorithm proceeds to step 3.
Step 3: Determine Interdependencies of Each Criterion. Let
be an interdependency matrix where the relative
impact of each criterion is measured with each other. This implies that each element of matrix can have values ,1 , where a value means that
criterion is independent or has no effect on criteria and dependent if . To obtain independence, the following question is asked: ―Given a criterion, which other criterion contributes to that criterion more and how much more?‖ To learn more about interdependencies of criteria, see Saaty’s publication on dependence and feedback [28]. The following matrix was then obtained from the committee.
1 2
8 3 1 2 8
7
Step 4: Determine Interdependent Priorities of Criteria. Let be an 1 interdependent priority vector that contains
the relative priority of each criterion with the identified interdependent relationships from Step 3. The vector is obtained by multiplying with .
334 75 341 227 22
Step 5: Determine Scores of Each Business Application on
Each Criterion. The raw ratings of business application on criteria are summarized in table 4. The table represent the actual values of business applications on each criterion. The proposed normalization scheme is applied to convert these data to quantitative ratio data. Table 5 shows the normalized data of the categorical data from table 4.
Step 6: Determine Priorities of Business Applications. To obtain the values of , we multiply with .
3 2 7 5 9 9 2 5 1 9 4 8 5 6 1 1 18 1 2 9 4 1 2 3
6 4 4 1 4
334 75 341 227 22
6 79 6 41 9 14 1 57 3 82
Based on the results of the modified ANP, priorities of the different business applications were obtained and results show that the Ultrasound Appointment System has the highest priority, while the digitalized ultrasound data storage application has the least priority to be migrated to SaaS implementations.
V. SENSITIVITY ANALYSIS
Due to the inherent variability of the provided preferences by the decision makers, the robustness of the results must be determined. Saaty’s 9 point scale has advantages of simplicity and interpretability; however it does not take into account an individual’s consistency and preference on scoring a given ANP element. To circumvent this, a Monte Carlo simulation was applied on each of the pairwise comparisons provided by the committee. We apply the sensitivity analysis methodology used by Emblemsåvg [29] to determine the robustness of the results. By letting every pairwise comparison number vary randomly by 2 one can determine whether the ANP algorithm can give consistent priorities an acceptable confidence level. Furthermore, variations of the interdependent values obtained in step 4 were varied 25 of their base values. Therefore, based on the obtained pairwise comparisons and interdependent values, we have 18 input variables and 5 output variables corresponding to the obtained priority of each of the business applications.
The Monte Carlo Simulation was done using RISK@
TABLE4
RAW DATA OF THE ALTERNATIVE BUSINESS APPLICATIONS ON EACH
CRITERION
Business Applica- tion
Estimated AW
Length of Implemen-tation
Security and Sensitivity of Info
Estimated
Life Level of Customiza-tion
HS 336,781 12 6 months Low 6 years High
RIS 312,458 54 3 months Low 6 years Medium
LIS 248,133 86 2 months Medium 5 years Low
DS 378,458 68 3 months High 4 years Low
IMS 295,311 43 18 months Medium 6 years Medium
TABLE5
NORMALIZED DATA OF THE ALTERNATIVE BUSINESS APPLICATIONS ON EACH
CRITERION
Business Applica- tion
Estimated
AW Length of
Implemen-tation
Security and Sensitivity of Info
Estimated
Life Level of Customiza-tion
HS 3.2 7.5 9 9.0 2
RIS 5.0 9.4 8 5.0 6
LIS 10 10 8 10 2
DS 0.0 9.4 1 2.0 3
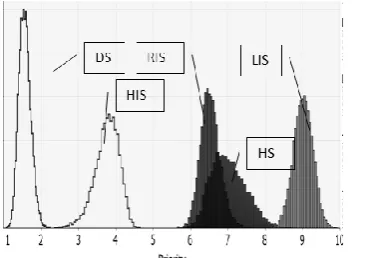
modelling applet for MS Excel by systematically changing the obtained pairwise comparisons from Step 1. The simulation was run with 10,000 data points and 5 replications. By plotting the distributions of the output variables corresponding to the 5 business applications, the results of the simulation are summarized in figure 2.
It is clear that by the variations by 2 of every pairwise comparison and the 25 variations of interdependent comparisons, the Laboratory Information System is preferred 95% of the time. The comparison between the Housekeeping System and the Radiology Information system cannot be easily determined in the 2 variation graph, however, we can conclude that the Housekeeping Information is stochastically greater than the Radiology Information System, which is followed by the Hospital Information System and lastly the Digitalized Ultrasound Data Storage System.
VI. CONCLUSIONS
In this paper, a decision framework for prioritizing business applications for SaaS migration is proposed. It includes a Total SLC cost analysis of business applications and a modified ANP structure to determine the priorities of business applications. The proposed model was tested and validated using real life data on a leading tertiary hospital that considered several business applications for SaaS migration. Based on the results, the hybrid SLC and ANP framework could support management decision making in terms of the prioritization of business applications.
REFERENCES
[1] C. Hoefer and G. Karagiannis, "Taxonomy of cloud computing services," Proceedings of the 4th IEEE Workshop on Enabling the Future Service-Oriented Internet (EFSOI’10), vol. Workshop of IEEE GLOBECOM 2010, pp. 1345–1350, 2010.
[2] S. Reid, H. Kisker, P. Matzke and A. Bartels, "Sizing The Cloud Understanding And Quantifying The Future Of Cloud Computing,"
Forrester Research, 2011.
[3] AMR Research Report, "Software as a Service: Managing Buyer Expectations as We Passthe Tipping Point from Novelty to Necessity," 2005.
[4] B. P. Rimal, E. Choi and I. Lumb, "A taxonomy and survey of cloud computing systems," in INC, IMS and IDC, 2009. NCM'09. Fifth International Joint Conference on, 2009, pp. 44-51.
[5] V. Choudhary, "Software as a service: Implications for investment in software development," in System Sciences, 2007. HICSS 2007. 40th Annual Hawaii International Conference on, 2007, pp. 209a-209a. [6] W. Torbacki, "SaaS–direction of technology development in ERP/MRP
systems," Archives of Materials Science, vol. 58, pp. 58, 2008. [7] Y. Lu and B. Sun, "The fitness evaluation model of SAAS for enterprise
information system," in 2009 IEEE International Conference on e-Business Engineering, 2009, pp. 507-511.
[8] J. Staten, "Is cloud computing ready for the enterprise," Forrester Research, March, vol. 7, 2008.
[9] S. Marston, Z. Li, S. Bandyopadhyay, J. Zhang and A. Ghalsasi, "Cloud computing-The business perspective," Decis. Support Syst., vol. 51, pp. 176-189, 2010.
[10] E. Deelman, G. Singh, M. Livny, B. Berriman and J. Good, "The cost of doing science on the cloud: The montage example," in Proceedings of the 2008 ACM/IEEE Conference on Supercomputing, 2008, pp. 50. [11] E. Walker, W. Brisken and J. Romney, "To lease or not to lease from
storage clouds," Computer, vol. 43, pp. 44-50, 2010.
[12] D. Kondo, B. Javadi, P. Malecot, F. Cappello and D. P. Anderson, "Cost-benefit analysis of cloud computing versus desktop grids," in
Parallel & Distributed Processing, 2009. IPDPS 2009. IEEE International Symposium on, 2009, pp. 1-12.
[13] A. Khajeh-Hosseini, I. Sommerville, J. Bogaerts and P. Teregowda, "Decision Support Tools for Cloud Migration in the Enterprise," Arxiv Preprint arXiv:1105.0149, 2011.
[14] S. Arnold, "ISO 15288 Systems engineering—System life cycle processes," 2002.
[15] J. Song, T. Li, L. Jia and Z. Zhu, "A Deduced SaaS Lifecycle Model Based on Roles and Activities," Advances in Computing and Communications, pp. 421-431, 2011.
[16] D. Pallmann. Hidden costs in the cloud. 2011(09/23), 2010.
[17] J. Heitler. Hidden costs of an on-premise CRM system. 2011(09/23),
2010.
[18] M. Tonsetic. 10 hidden costs in the public cloud. 2011(09/23), pp. 2. 2011.
[19] A. Benlian, T. Hess and P. Buxmann, "Drivers of SaaS-adoption–an empirical study of different application types," Business & Information Systems Engineering, vol. 1, pp. 357-369, 2009.
[20] L. Jain and S. Bhardwaj, "Enterprise Cloud Computing: Key Considerations for Adoption," International Journal of Engineering and Information Technology, vol. 2, pp. 113- 117, 2010.
[21] S. C. Misra and A. Mondal, "Identification of a company's suitability for the adoption of cloud computing and modelling its corresponding Return on Investment," Math. Comput. Model., 2010.
[22] A. Benlian, "A transaction cost theoretical analysis of Software-as-a-Service (SaaS)-based sourcing in SMBs and enterprises," 2009. [23] T. L. Saaty, "Analytic hierarchy process," Encyclopedia of
Biostatistics, 1980.
[24] T. Saaty, Decision Making with Dependence and Feedback: The Analytic Network Process, the Organization and Prioritization of Complexity. RWS Publications, Pittsburg, USA, 1996.
[25] W. G. Sullivan, E. M. Wicks, J. T. Luxhoj and B. M. Woods,
Engineering Economy. Prentice Hall, 2003.
[26] R. T. Clemen and T. Reilly, Making Hard Decisions with Decision Tools Suite. pg. 606, Duxbury Resource Center, 2000.
[27] T. L. Saaty, "How to make a decision: the analytic hierarchy process,"
Eur. J. Oper. Res., vol. 48, pp. 9-26, 1990.
[28] T. L. Saaty and M. Takizawa, "Dependence and independence: From linear hierarchies to nonlinear networks," Eur. J. Oper. Res., vol. 26, pp. 229-237, 1986.
[image:6.595.83.268.130.259.2][29] J. Emblemsvåg and L. Tonning, "Decision support in selecting maintenance organization," Journal of Quality in Maintenance Engineering, vol. 9, pp. 11-24, 2003.
Fig. 2 Probability Distributions of the Alternatives with 2 Variation of Pairwise Comparisons