SPEED AND STAMINA IN THREE FISH
BY RICHARD BAINBRIDGE
The Zoological Laboratory, Cambridge
(Recerved 29 September 1959) INTRODUCTION
The speeds already reported (Bainbridge, 1958 a) as attainable by various fish after measurement in the' fish wheel' were calculated from cin£ film records of swimming over a minimum distance of 1 m. Such figures give little indication of the length of time for which a particular speed can be sustained. The 29-3 cm. trout reported as travelling at 320 cm./sec, for example, had to swim at this speed for only J sec. in order to qualify for inclusion; while the lowest speeds reported, of the order of
10 cm./sec., required only 10 sec. of swimming.
A variety of reasons make it desirable to know how long particular speeds can be sustained by fish of different sizes. The most efficient design of fish-passes, for example, particularly those demanding periods of violent activity separated by periods of rest, could be dependent upon parameters of this kind. The speed at which trawls and other fishing devices should be manipulated, and the precise design of the net opening and the relative positions and lengths of headline, ground-rope and tickler-chain could also profitably be examined in the light of such in-formation. Finally, a proper assessment of the physiological problems associated with swimming and the relationship between power output, drag and speed and a consideration of the degree of correspondence between fatigue in fish and other animals, are all dependent upon a precise knowledge of the ability of fish to sustain particular speeds of swimming.
It has already been briefly reported (Bainbridge, 19586) that the duration of a burst of swimming decreases rapidly with increase in the speed attained. The lower speeds, such as can be sustained for periods of the order of hours, have commonly been termed 'cruising speeds'. Some values for such basic speeds are already available in the literature. Magnan's (1930) figures for a variety of fish should probably be counted as of this nature. The average of his measurements for seven-teen different common species, mostly marine, is yzLjstc., where L is the body length. Fry & Hart's (1948) figures for goldfish (Carassius axtratus) are based on periods of swimming of 20-25 i^11- a n cl average at 6-4L/sec. Davidson (1949) gives 4-oL/sec. for salmon (Salmo solar) and Radcliffe (1950) y^L/sec. for gold-fish tested over 25-30 min. Similar, but slightly lower, values can be calculated from information about the long-range migrations of fish.
More recently several workers have deliberately set out to relate speed to en-durance. Paulik & DeLacy (1957) give values for sockeye salmon (Oncorhynchus
nerka), silver salmon (O. milkUckiUch) and steelhead {Salmo gatrdneri) tested in a
rotating tank of water. With the speed of the tank gradually increasing, individual fish were observed until they began to lose laps. The speed preceding this was then recorded as one that could be maintained for long periods. The mean value for fifteen sockeye averaging 20 in. in length was 3-oL/sec.; for nine silver salmon averaging 22 in. in length 3-4L/sec. and for ten steelhead, averaging 25 in., 2'3L/sec. These may be taken as cruising speeds. In another series of experiments silver salmon and steelhead were tested to see how long they could swim before exhaustion in water velocities ranging from 4 to 10 ft./sec. These results, on fish about 24 in. long, give accurate values for sustained swimming lasting up to about 5 min. No observations were made over periods less than about 20 sec., but the results accord well with the figures reported in this paper for periods from 1 to 20 sec. and are discussed later.
In a second paper Paulik & DeLacy (1958) make it clear that the ability of sockeye salmon to swim persistently at various velocities is greatly reduced as a result of previous exertion. They demonstrate significant changes in the length of time that fish will swim at certain selected current velocities as a result of their migrating some 350 miles up the Columbia river and climbing to a height of 1800 ft. The maximum mean time swum at the lowest velocity (6-6 ft./sec.) in a straight flume was 196-4 sec. and this figure, for fish of mean length c. 20 in., represents a speed of 4'oL/sec.; their highest value, 9-4 ft./sec. for 64-9 sec, converts to $-6L/sec. and both these values seem intermediate between long sustained cruising speeds and the bursts now being measured.
Brett, Hollands & Alderice (1958) have made a study of coho salmon
(Onco-rhynchus kisutch) and sockeye in a rotating circular chamber, relating cruising speed
to temperature. Defining cruising speed as the maximum speed maintained for 1 hr. under strong stimulus, their values for 5-4 cm. long coho salmon at 20° C. is 30 cm./sec. (5-5L/sec); for similar fish at about o° C , 6 cm./sec. (i-iL/sec.); and for 6-9 cm. sockeye, 35 cm./sec. (5-iL/sec.) and 12 cm./sec. (l-yL/sec.) at the same two temperatures. They further show that these fish, if trained and exercised, will give significantly better performances.
Messrs R. W. McCauley and J. F. Skidmore of Ontario have also kindly provided me with hitherto unpublished data, on the cruising speed of the spawning phase of the sea lamprey {Petromyzon marinus). For 16 in. fish at 2° C. their figures give O'57L/sec. and at 15° C , o-8oX/sec. Each of these values derives from the mean result for ten animals tested in Fry & Hart's (1948) original chambers.
Mr W. Muir of Garve, Ross-shire, has further given me figures obtained in a most ingenious manner by riming shoals of migrating salmon over a measured distance. This was done while watching them through field glasses from a height above the water during the direction of fishing operations. The mean value for fish of 24 in. mean length, swimming over a distance of 100 yards, is 2-oL/sec. It is clear from Mr Muir's report that this speed could be maintained for long periods of time. When startled the fish would spurt up to ^zL/sec. for 30 ft. or so. All the figures given above are of the same order of magnitude and it would seem substantiated that most of the fish so far considered can sustain speeds of the order of three to six times their body length per second for long periods. However, none of the techniques used to produce these results permits the accurate recording of sudden bursts. The fish wheel, allowing as it does for the almost instantaneous acceleration or deceleration of the water in which the fish is swimming, lends itself particularly to a study of the more violent periods of activity below about 30 sec. duration.
EXPERIMENTAL METHOD
In order to facilitate the continuous recording of speeds over longer periods than hitherto the apparatus (Bainbridge & Brown, 1958) was modified by the addition of a permanent recording device and the filming of the fish itself was dispensed with. A standard Cossor double beam cathode-ray oscilloscope was linked to the electrically operated speed meter of the fish wheel, the voltage supply utilized being directly dependent upon the speed of rotation of the wheel. One spot of the oscilloscope tube was thus used as a direct indicator of the speed at which the fish was swimming and the other as a time marker. A continuously running paper-film camera attached to the oscilloscope then allowed a permanent record of speed against time to be made for any period of swimming. Such records are shown for a goldfish and a dace in Fig. 1.
In a typical experiment the wheel is filled with water at the recorded room temper-ature and a fish is introduced. After a period of 5-10 min. for settling down in the apparatus the fish is induced to swim and the wheel is rotated to keep him stationary at the observation point. Prolonged periods of steady swimming and shorter faster bursts can be variously induced by judicious use of a mild electric shock introduced into the wheel through a ring commutator and four diametrically placed brass plate electrodes on the floor of the Perspex tube. The shock is manually controlled through a pressure switch. Its intensity is regulated by means of a Variac; low voltages are generally used for large fish and higher voltages for smaller ones. Administration of the shock usually produces a burst of forward swimming of velocity very roughly related to the intensity of the shock. Such a burst is
followed by rotation of the wheel and is thence recorded on the oscilloscope. Occasionally a fish responds to the shock by stopping swimming or by turning round. Such specimens are not always consistent in their response and on other occasions may be more tractable. Low steady speeds are readily induced by rotating the wheel a little, so that the stationary fish is carried backwards over a striped background. The common optomotor response then results in a steady swimming to keep station and speed can be increased until the fish just starts to fall back. In contrast to the previously reported speed/frequency records, where the fish itself was photographed, the accuracy of the whole method on this occasion is entirely dependent upon keeping the fish stationary relative to the observer. At all times care has been exercised to ensure that this condition has been fulfilled.
200-1
1000
§ 2 0 0
-|
100-8. O
60-i
3 0
-0 - 1 ?"-*
Time (sec)
Fig. i. Oscilloscope records of the speed of swimming of goldfish and dace showing A, a 5 sec. burst at n o cm./sec., B, 1 sec. at 200 cm./sec., C, 15 sec. at 60 cm./sec. and D, 20 sec. at 50 cm./sec., all by a 13-5 cm. goldfish. E shows a io-o cm. dace swimming at about 30 cm./sec. for a longer period.
have their own idiosyncrasies. Some will be more lethargic than others and will consistently give a poorer performance over a long series of observations to the extent of concealing somewhat the relationship with size (see below).
The oscilloscope traces are analysed using a transparent Perspex scale transferred from a calibration trace made with the wheel running at a series of convenient known steady peripheral velocities. This scale can be laid over the experimental trace and the parameters of any burst of swimming readily determined. No measure has been made of the rapidity of acceleration or deceleration. The speeds reported have been sustained at a constant level for the period of the observation. If the speed fluctuated during the period then the value accorded to that burst is the minimum reached during the period and not the average. This average would generally be only slightly higher than the figure recorded. Whenever possible absolutely steady speeds for the period involved have been selected. Typical readings, taken from the records illustrated, are given in the caption to Fig. 1.
- Q
2 0 0
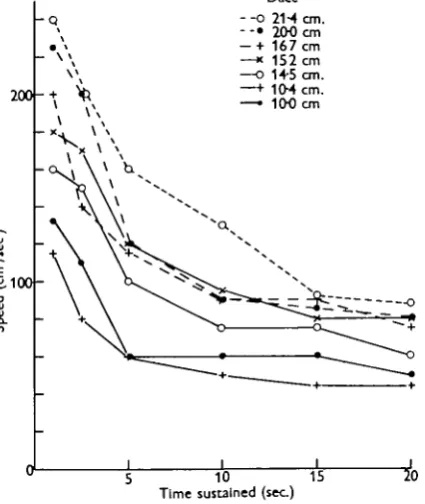
-Dace - - o 21-4 on. - - • 200 on — + 167 cm —« 152 cm —o 14-5 on. —^ 104 cm. — • 100 on
[image:5.451.124.337.273.525.2]Time sustained (sec)
Fig. a. Relationship between speed and the length of time it can be sustained for seven dace (Leucitcus leucitcus) ranging in size, as shown, from 21*4 cm. to i c o cm. in body length.
EXPERIMENTAL RESULTS
The dace, Leuciscus leuciscus
134
Examination of the points for the 21-4 cm. specimen shows a rapid decline from a speed of 240 cm./sec., which is maintained for only 1 sec., down to 130 cm./sec. when the burst lasts for 10 sec. and 90 cm./sec. when it lasts for 20 sec. The flattening nature of the curve shows that a speed of 80 or 90 cm./sec. is probably one that can be maintained for some time. With the 10 cm. specimen the capacity to sustain speed declines with even greater rapidity, so that by 10 sec. of swimming the fish is already reduced to what is probably its cruising speed.
10-5 T O T S 20
Time sustained (sec)
Fig. 3. Data shown in Fig. 2 with the speed in every case divided by the length of the specimen concerned raised to the power of i*oo. Symbols as in Fig. 2.
The figures for the specimens intermediate in size show the same type of relationship. Assuming that ability to maintain speed is some function of the length of these different sizes of fish, it is possible to express this relationship in the form VjLa = F(T, spp.), or log V = a log L + KT Bpp, where V = velocity,
L = length, F = a function peculiar to one species for a particular time interval.
A plot of the logarithm of the velocity against the logarithm of the length, for the results for different sized fish at one particular time interval, should thus give a straight line whose slope is the value of a. Repetition of this operation for the various time intervals gives six values of a: 1-03, 1-15, 1-33, I - I I , i-o and 0-93 for the dace; the mean of these is 1-09.
against time sustained and, as can be seen, give an acceptable correlation. The implications of this are considered later.
There is, however, a certain inconsistency in the correlation with size. The io-o cm. fish, for example, is substantially better in its performance than the 10*4 cm. specimen. This difference remains despite determined efforts to extract a better performance from the slower specimen. It may be accounted for by the possession of a more phlegmatic temperament or perhaps by the one fish being in poorer condition than the other. All the dace studied were born in the wild, but had been in captivity in roomy tanks for periods of months. There is no reason to suppose that they were in different condition as a result of immediate environ-mental influences.
300r
Trout
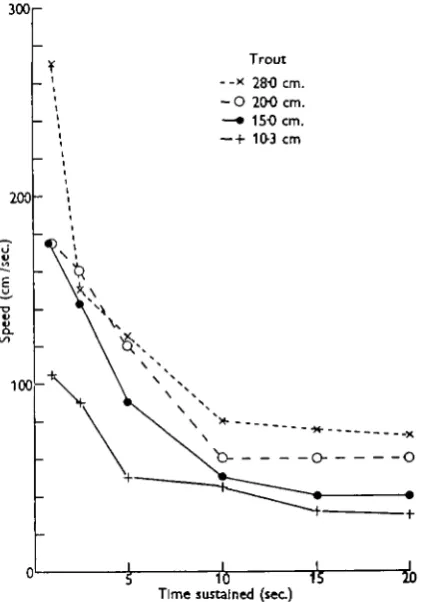
- - x 280 cm. - O 200 cm. — • 150 cm. — + 10-3 cm
200
"S
100
[image:7.451.123.341.226.527.2]5 10 15 20 Time sustained (sec)
Fig. 4. Relationship between speed and the length of time it can be sustained for four trout (Salmo irideus) ranging in size, as shown, from 28-0 to 10-3 cm. in body length.
The trout, Salmo irideus
136 RICHARD BAINBRIDGE
for 20 sec. The smallest fish, 10-3 cm. in length, sustained 105 cm./sec. for 1 sec. and only 30 cm./sec. for 20 sec.
Treatment of these results in the same manner as for the dace, to determine the nature of the relationship with length, gives the following values of a for the six time intervals: 0-71, 0-36, 0-70, 0-43, 0-65 and 0-65; the mean of these is 0-58. The trout records are thus shown in Fig. 5 with each value of speed divided by the length of the specimen raised to the power of 0-58. The correlation is particularly good for the lower values of speed. A direct comparison between these transformed results and those for the dace is not possible because two different powers of length have been used. Such a comparison is reserved until the goldfish figures have also been considered.
Time sustained (sec)
Fig. 5. Data shown in Fig. 4 with the speed in every case divided by the length of the specimen concerned raised to the power of 0-58. Symbols as in Fig. 4.
The goldfish, Carassius auratus
137
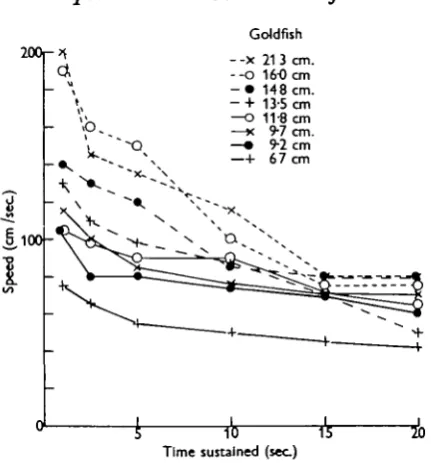
Goldfish
- -x 21 3 cm. - - 0 160 an - • 148 cm.
- + 13-5 cm —O 11-8 cm —x 9-7 cm.
- • 9-2 cm —h 67 cm
[image:9.451.121.337.74.306.2]10 15 Time sustained (sec)
Fig. 6. Relationship between speed and the length of time it can be sustained for eight goldfish (Caratshu auratus) ranging in size, as shown, from 21-3 to 6-7 cm. in body length.
30r
TO 1 5 Time sustained (sec)
20
Fig. 7. Data shown in Fig. 6 with the speed in every case divided by the length of the specimen concerned raised to the power of 0-71. Symbols as in Fig. 6.
DISCUSSION
[image:9.451.124.337.340.503.2]with previous work, and lastly, some possible practical applications of the experi-mental observations. It becomes necessary from time to time to introduce further experimental data. This is done where the argument demands it rather than earlier, under the heading of experimental results.
(1) The effect of size
Neglecting for the moment the exact form of the relationship between speed and duration for the different species of fish, we shall first consider the nature of its dependence upon size in specimens of different length. The three empirically determined values for the results obtained are: dace, L1-Ofl, trout, L0'58 and goldfish, Lo n. Of these the second two are not found to be significantly different when a
t test is applied to the values and their standard errors; but the dace does differ
significantly both from the goldfish and the trout. If the same relationship is assumed to hold for both the trout and the goldfish the mean value is Z,0"66.
In the present state of our knowledge it does not seem possible to provide a complete theoretical explanation of such a variable dependence upon length in different species. At least four factors would seem directly concerned: (a) the degree of non-isometric growth may vary between species, different sizes of fish being thus differently equipped with muscle; (b) the roughness of the surface may differ and have different proportional effects on laminar/turbulent flow at different sizes; (c) the fineness ratio and body form generally may vary with similar effects; and (d) the influence of Reynolds number must be considered. The first factor would influence the different amounts of power available to different sized fish, the remainder would influence the amount of drag encountered while moving through the water. Combined, these would necessitate different efforts at different speeds and hence result in variable staying power. They will each be considered in turn.
(a) The effect of non-isometric growth
Basically for a series of specimens of one species showing isometric growth, one can argue along various lines in order to determine how speed and the ability to sustain it may be related to length. In general, we may assume that the volume of the body and hence the proportionate amount of muscle increases as the cube of the length, while the surface area increases as the square of the length. From these two assumptions D'Arcy Thompson (1917) deduces that velocity must be proportional to Los. Making the further assumption that power is limited not by
(i) Relationship of weight and length. The first modification of the above simple theory concerns the assumption that the mass of muscle is proportional to L3.
Le Cren (1951) makes it clear that the cube law concerning the weight of fish of different lengths is rarely obeyed, the exponent n in the formula W = aLn usually lies between 2-5 and 4-0 and can vary during the life of the fish. There is no reason to suppose that this deviation from 3 concerns only parts of the body other than muscle; although the relative weight of the gonads does change considerably in association with the breeding cycle. All the fish used in these experiments were therefore weighed and measured and n was found to be 3-2 for the goldfish, 3-0 for the trout and about 2-8 for the dace. These values, unfortunately, in no way clarify the problem. The goldfish with the most favourable muscle/length ratio has the intermediate value for dependence of staying power upon length (L°'n); the
dace, with the least favourable muscle/length ratio has the highest value for staying power (L1"09). In any case a disproportionate increase in bulk with increase in length means a corresponding increase in surface area and hence in the value for total drag. The opposing effects of these two tendencies might be to some extent mutually cancelling.
(ii) Relative percentages of muscle. A deviation from the principle of isometric growth that would not be self-corrective in this way would be a change, within a series of specimens of otherwise normal weight/length relationship, in the quantity of muscle relative to the remaining skeletal, digestive, nervous, etc., tissue of the fish. Information concerning such a change does not seem readily available in the literature, although Jacquot & Creac'h (1950) give references recording the
mean proportion of muscle and its chemical constituents in many different edible
fish. Reay, Cutting & Shewan (1943) give a figure for only one of the fish we are studying—trout—with 63 % of muscle including skin. This accords well with the values reported below. Their figure of 33% for the perch is also interesting in comparison with our goldfish values.
140
important proportion of the fish tested in the wheel. At a length of about 17-5 cm. the percentage of muscle appears to become roughly constant, although still showing some variability. The average proportions at this constant level are different for each of the three species and the significance of this is considered later.
80r
•J 60
, 4 0
-3 V
2 0
-10 20 30
Length of fish (cm.)
40 50
Fig. 8. Wet weight of propulsive trunk muscle as a percentage of total body weight plotted against length for various fish: dace (white circles), trout (black circles) and goldfish (crosses).
If these figures for change in muscle proportion with length are incorporated with those concerning the deviation of weight from the cube law (see above), the combined relationship between length and weight of muscle is then: dace L3"04, trout L8"06 and goldfish L8"40. There is thus in this respect little deviation from the cube law except in the goldfish, which changes advantageously with respect to power as size increases.
(b) The roughness of the body surface
increase in size by isometric growth in regular proportion to the growth of the whole body. The number of scales lying along the lateral line may be taken as some indication of the degree of roughness of the body. In the goldfish this is about 28, in the dace 52 and in the trout 126. The maximum lengths normally reported as being reached by these three fish are 40, 25 and 60 cm., respectively. This makes their maximum scale size about 1-5, 0-5 and 0-5 cm., respectively. The minimum scale size, when the pattern is first fully developed at say 6-0 cm., would be goldfish 0-2 cm., dace o-i cm., trout 0-05 cm., approximately.
The scales, overlapping as they do, will thus impart to the surface, though covered by epidermis and mucus, a pattern of roughness varying between these limits and changing in a uniform manner with the length of the specimen. The likelihood of this variation in roughness affecting the drag of the body in the way necessary to account for the observed variations of swimming ability with size is extremely small. Richardson (1936) has already shown that wooden models of fish respectively roughened, smoothed and varnished, and oiled were all of prac-tically the same resistance as a dead fish. The variability in roughness of his models is greater than that within the size range of any one of the species we are considering and, if the roughness varies isometrically, its effects will in any case be covered by Reynolds number.
(c) The effect of the fineness ratio
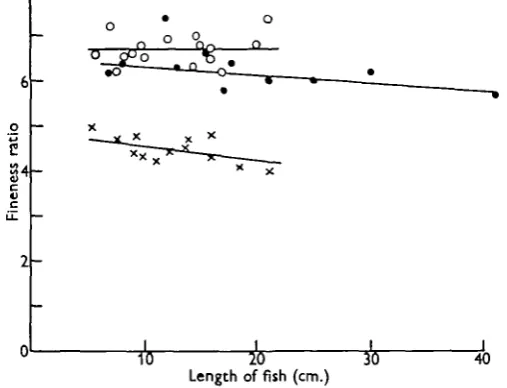
Second in the factors affecting drag, the fineness ratio (F.R.) of the body may be considered. For a three-dimensional figure this is the ratio of the length of the body to the mean of its maximum height and breadth. With isometric growth F.R. might be expected to remain constant with increasing size, but with allometric growth it should either increase or decrease according to the nature of the departure from isometry. Two components are recognized in the drag of a three-dimensional body. The frictional resistance, which is usually expressed in terms of a coefficient based on the total wetted surface area, and the form drag, usually referred to the frontal area. These two factors contribute in varying measure to the total drag of the body in proportions dependent upon Reynolds number and the shape of the body. The total drag coefficient, based on frontal area, varies with a changing F.R. For airships where a premium is placed on volume in relation to drag, Cf is at a minimum for an F.R. of 2-5 (Hoerner, 1958). It would seem likely that the case of fish is analogous, as an optimum volume for minimum drag will allow the maximum speed to be obtained. Any trend towards or away from an F.R. of 2-5 should there-for lead respectively to increasing or decreasing speed or stamina. Values there-for the F.R. for most of the fish used in these experiments, and some other specimens, are shown in Fig. 9. A decrease with increasing length is apparent in both the goldfish and trout, while in the dace there is a possibility of a slight increase although this is masked by the rather large variability. These changes {^•']s)-^-2^ in the goldfish
142
greater interest, the mean being 67 for the dace, 6-3 for the trout and 4-5 for the goldfish. Their significance is considered below.
(d) The influence of Reynolds number
The third factor which may influence the drag of the body is Reynolds number
[image:14.451.100.354.216.410.2](R). In the simple expression Drag a CfL2V*, Cf is a function of R. R is expressed as VLjv where V is the velocity, L the length of the specimen and v is the kinematic viscosity of the water. The experimental values of V make it clear that R varies within each of our series of fish results. The limits of this variability are given in Table 1.
81-20 Length of fish (cm.)
[image:14.451.107.338.450.549.2]30 40
Fig. 9. Fineness ratios of various fish plotted against length for: dace (white circles), trout (black circles) and goldfish (crosses).
Table 1. Limiting values of Reynolds number for the fish studied
Smallest Largest Smallest Largest Smallest Largest
Reynolds Minimum
4-7 x io« I-8XIO* 3-1 x 10* 2-1 X IO* 3-8 X IO* 1-7 x 10s
number Maximum
1-4 x 10' 5-1 x io1
I - I X IO* 7-8 x io1 5-0 x io* 4-3 x io*
Dace
Trout
Goldfish
from 0-008 to 0-0015, while R goes from 3 x io4 to 8 x 10s. This disregards the effect of a changing F.R. With turbulent flow and a fixed F.R. of 5 the comparable change in Cf would be from 0-015 to 0-0025.
These changes are substantial and have considerable effect when incorporated in the theoretical relationship between velocity and length. D'Arcy Thompson's arguments can be used to derive the expression VctL{\(f} — 2)}, where /? is the disputed index in the formula which relates power available to length. Using modern hydrodynamical theory incorporating the effect of Reynolds number and assuming laminar flow over most of the body with CjaR~*, the comparable ex-pression is FaL{£(2/J-3)}. Incorrect assumptions concerning the effect of R are undoubtedly a source of error in D'Arcy Thompson's deductions. The choice of assumptions concerning /S are (i) that it is simply dependent upon muscle volume (broadly L3), or (ii) that it is entirely limited by the surface area of gills or such structures (broadly L2). These two values for the index would now give FaZ,0"26 and L° '2, respectively, instead of L° "6 and V independent of L as in D'Arcy Thomp-son's analysis. Substituting our three figures for mass of muscle (dace L3"04, trout Lsw, goldfish L3"40) would give velocity as ocL0"62, L0"82 and L0'76, respectively. Of these figures the trout and goldfish values tally well with our experimental findings but the dace is surprisingly low. Quantity of muscle is, however, probably not the limiting factor but without a careful study of relative changes in gill surface areas, circulatory systems, etc., it is not possible to say just how the power factor relates to length. Accepting the experimental results as reliable we can perhaps best at this stage only restrict our conclusions to a recognition of an empirical difference between the dace on the one hand (speed and ability otL1"09) and trout and goldfish on the other (<xL0-66).
In the absence of so much basic information concerning limiting factors, argu-ments such as these must be considered as only exploratory. The basic assumption of a similar dependence upon length for all periods of swimming may even not be valid. It is possible that a burst of swimming of only 1 sec. duration might be dependent only upon the volume of muscle and hence make VOLL0*, while more sustained swimming would begin to depend upon circulatory and respiratory transfer and hence perhaps finally make VaZ,0'2. There is an indication of such a
change in the goldfish results (p. 136). The series of values for a with increasing time interval (1-06, 0-74, 0-76, 0-70, 0-48 and 0-50) show the required decrement. The other two species do not show this and the effect has been neglected because of the complexity of treatment it would demand. It should, nevertheless, be borne in mind as a possibility.
144
increasing size of the specimen. The maximum efforts for varying durations which are being studied here would not therefore be expected to be directly related to length. They should differ from this in a manner dependent upon variation in the maximum frequency of tail beat with size.
(2) The effect of inter-specific differences
Because of this variable dependence upon length it is not possible to make a direct comparison between the different species and thence assess their relative staying powers and the different onsets of fatigue in different species. One way in which an indirect comparison may be made, however, is by transforming the values for the mean curves in Figs. 3, 5 and 7 to values for a representative fish of arbitrarily selected length. This is done in Fig. 10 for theoretical fish of 15 cm. length, a size within the range of the experimental results for all species. The deductions which may be drawn from such a comparison are limited, because fish of such an arbitrarily selected length will not necessarily be at comparable stages in growth or development of sexual maturity.
2oor
Time sustained (sec)
Fig. 10. Calculated relationship between speed and the length of time it can be sustained for three 15-0 cm. fish: dace (white circles), trout (black circles) and goldfish (crosses). Points derived from the means of the values in Figs. 3, 5 and 7.
for 20 sec. of swimming the goldfish maintains a speed almost double that of a trout of comparable size and almost 10 cm./sec., or 10%, greater than that of a similar dace. All species show a marked decline with time in the ability to maintain speed, the goldfish falling to 50% of its maximum value, the dace to 38% and the trout to 28%; the mean of these three figures is 40%.
Two pieces of information might correlate with this order of ability: the fineness ratios and the muscle percentages already calculated. In this context it is the differences between species that will be of consequence and not the changes with increasing length. With optimum laminar conditions, with R at 4 x io6, the Cf (based on frontal area) for the goldfish on the one hand at F.R. 4-5 is 0-048, while for the dace and trout on the other hand with F.R. C. 6-5 it is 0-065. These figures are greater than those already quoted for Cf (wetted area) as they are based on different para-meters of the body. This would lead one to expect a better performance (of the order of 10-20%) on the part of the goldfish, as is indeed found over the longer time intervals. Combined with this there must be some effect of the different percentages of muscle in the three species. The magnitude of this effect is difficult to assess because of the unknown influence of area-dependent factors such as the gills. If muscle volume alone were the determining factor it can be shown that this should depend upon (% muscle)*. Treatment in this way of the mean muscle percentages for fish above 15 cm. (dace 56%, trout 63% and goldfish 45%) gives the following factors: dace 14-6, trout 15-8, goldfish io-8. The goldfish with the most favourable Cf has thus the most unfavourable muscle factor. When these two factors are combined the relative abilities should be: dace 21, trout 22 and goldfish 20. These are virtually identical and there would thus appear not to be any im-mediately determinable factors accounting for the observed variations in ability to sustain different speeds. The differences appear to be real and one may be forced to invoke some hitherto undetermined hydrodynamical or physiological factor to account for them . In this context Black (1955) has already made it clear that there are a number of interspecific physiological differences of as yet undetermined effect amongst fish. In particular his results show a large difference in the increase in blood lactic-acid content after 15 min. of forced exercise between carp, with low values (mean 65 mg. %) and Kamloops trout with high values (mean 91 mg.%). These he supposes must in turn be related to capacity to survive at different temperatures and possibly also to activity.
(3) Nature of the time/speed relationship
Accepting these partly unaccountable variations related to size and species we may now consider more closely the nature of the relationship between speed and the time for which it is sustained. For this purpose size and species may be ignored and Fig. 11 gives the speed/time curve for a hypothetical fish of 15 cm. length. It is derived from Fig. 1 o by taking the mean of the three values for each time interval. This mean curve shows that the fish have little power to sustain any of the higher speeds. The maximum speed, as recorded previously (Bainbridge, 1958 a), is of the order of ioL/sec. This is kept up only for periods of the order of 1 sec. With z\ sec.
of swimming it has already dropped to jL/sec., with 10 sec. to ^L/sec. and with 20 sec. to 4L/sec. The ability to sustain high speeds is thus much lower than that suspected previously. The form of the curve suggests that speeds of i2L/sec. (180 cm./sec.) would be attainable by such a fish as this but these would be sus-tained for no more than 0-5 sec.
200r
I
1 0 0I
5 10 1 5 1 0
Time sustained (sec)
Fig. I I . Calculated relationship between speed and the length of time it can be sustained for a hypothetical 15-0 cm. fish. Points derived from the means of the values in Fig. 10.
determined mechanically by the strength of connective tissue junctions within the myotomes or perhaps by internal friction and viscosity within the fibres themselves. Anaerobic conversion of glycogen to lactic acid is certainly one of the important mechanisms providing energy for muscular contraction. The appearance of such lactic acid in the blood of the fish appears to be somewhat delayed. Black (1956, 1957) gives information on the rate at which lactic acid appears in and disappears from the blood of various fish after violent exercise. He found no regularly determinable change in blood lactic-acid content up to 240 sec. after only 1 min. or so of violent activity associated with capture and the withdrawal of blood. Production must already have taken place in the muscles, however. During 15 min. of violent activity the mean rate of appearance in the blood was 10 mg.%/min. over the first 1-5 min. Normality might not be regained for as long as 12 hr. and this relates well to Paulik, DeLacy & Stacy's (1957) work on the effect of rest on the swimming performance of fatigued adult silver salmon. They found recovery after an exhaustive effort was only 3 1 % complete after a rest of 1 hr., 43% after 2 hr., 67% after 3 hr. but not wholly complete until 18-24 n r- ^a(i elapsed.
200-i
[image:19.451.95.370.289.445.2]
100-Time (sec )
Fig. 13. Oscilloscope records of the speed of swimming of a 14-4 cm. goldfish showing three suc-cessive series of bursts of swimming lasting 80 or 90 sec. with an initial peak and a gradual decline indicative of fatigue.
148 RICHARD BAINBRIDGE
either by change in the rate of lactic acid removal as successive stages in the system become fully charged or perhaps by a nervous adaptation to the more or less uniform stimulus being received.
10r-~5<5 T O T
Time sustained (sec)
lio
Fig. 13. Comparison between the present results for the dace (black circles) and results for the silver salmon, Oncorkynchus milkuMuch (white circles), from Paulik & DeLacy (1957). Both species with speed plotted as V/L1"**.
(4) Correlation with other results
The figures described in this paper relate satisfactorily to those already published for longer time intervals. The tendency to approach a cruising speed of 3 to ^L/sec. is evident in both the values in the introduction and in Fig. 12. Fry & Hart's (1948) high figure for the goldfish correlates well with the placing of the present goldfish results in Fig. 10. The mean cruising speed derived from Fry & Hart's figure and Radcliffe's (1950) figure is 4'88L/sec. That in our Fig. 10 for a 15 cm. fish represents 5-oL/sec.
Paulik & DeLacy (1957) show a gradual decline in the swimming ability of adult silver salmon over periods up to 200 sec. The shortest mean period of swimming they record is 24 sec. Their figures, the mean of nine fish, are reproduced in Fig. 13 on a scale of VIL1"09. Our dace figures are shown in the same notation. The
com-plementary nature of these two sets of information is at once apparent. Although one might expect the correspondence of silver salmon to be greater with our trout this is not so, nor is it with the goldfish.
present work, the scales are of a different order, involving minutes in the mammal and only seconds in the fish. It is improbable that this striking difference derives from any essentially different type of muscular activity. A more likely explanation could lie in the relatively poor circulatory system of the fish. Ritchie (1928) makes it clear that the buffering capacity is very poor in fish muscle and rapid fatigue might be due to a change in pH because of an inability to remove lactic acid with sufficient speed. He further suggests that the glycogen reserve in fish muscle is extremely low and this would be a contributory factor. Black (1957) shows that after violent exercise the level of lactic acid in fish blood continues to increase for 2-3 hr., whereas in man this process continues for only 10 min. at the most. The low body temperature of fish may determine this slow rate of diffusion from the muscles. In mammals, correspondingly, the high body temperature will favour rapid transport of such diffusible substances.
Temperature of the ambient water is known to have a marked effect on the cruising ability of goldfish (Fry & Hart, 1948) and coho and sockeye salmon (Brett et al. 1958). No attempt has been made to study the influence of temperature in the present work. All the observations were made at room temperature and in every case this was recorded. The fish were held in tanks at the same room tempera-ture and were therefore always acclimatized to the temperatempera-ture of the water in which they were studied. For the purposes of comparison all the records may be taken as relating to 150 C , but on occasion observations were made as much as 30 C. on either side of this figure. Because of the limited number of these no consistent influence of temperature could be detected in the speeds recorded but this factor may account for some of the variability that was encountered.
(5) Practical applications
Besides raising these various physiological problems the figures reported here may be of some practical significance. Two such possible applications are now considered. For this purpose it would seem best to neglect possible variation between species and refer to a hypothetical average fish derived from the mean of all the results so far obtained. The swimming abilities of the members of a series of such animals of varying sizes should be related to each other according to their length raised to the power of o-8; this being the mean of the three indices already calculated. Using this power and the values in Fig. 11 it is possible to construct a graph relating the speed of such hypothetical fish to the maximum distance they could swim. Such a relationship is shown in Fig. 14 for four representative lengths of fish (15, 30, 45 and 60 cm.). 60 cm. (about 24 in.) has been chosen as the upper reliable limit for extrapolation of the results, which derive from fish whose maximum length is 30 cm.; and 24 in. is also a reasonable size for a spawning salmon.
If one of these animals, e.g. the 60 cm. specimen, is swimming head into a current of water the distance he can travel forward relative to the ground is given by the simple relationship D = T{Vf—V^), where T is the duration of the burst of
Fig. 15. This gives the headway that a 60 cm. fish can make against various speeds of flowing water according to the speed at which he swims. It is at once apparent that for each water speed there is an optimum speed of swimming which will carry the fish a maximum distance. In water at 200 cm./sec, for example, for a 60 cm. fish, this is 325 cm./sec. At this speed he will make a headway of 545 cm. If he swims faster than this he fatigues before having travelled so far; if he swims slower he is
1500r
500
S400--9 300 $.
2 0 0
-100 30 cm.
»15 cm.
T W O ^ 0 0 0 300c Maximum distance swum (cm.)
Fig. 14
Two Velocity of fish (cm./sec.)100 20
Fig. IS
four Fig. 14. Relationship between speed and the maximum distance swum before exhaustion for
hypothetical fish of 15, 30, 4s and 60 cm. in length.
Fig. 15. Headway, relative to the ground, made by a hypothetical 60 cm. fish swimming at various speeds in currents of various velocities. The separate curves relate to the different current velocities; the black circles indicate distance travelled for particular speeds of swimming. For further explanation see text.
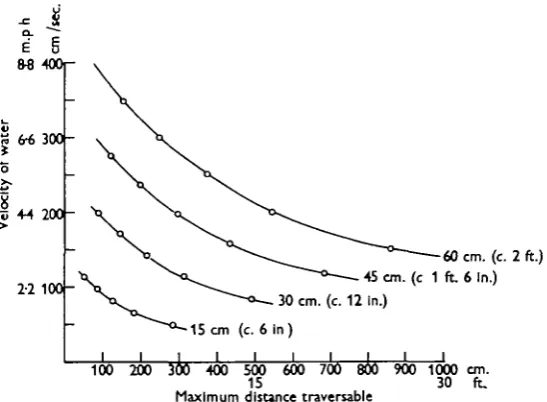
maximum distance that such a specimen might be expected to traverse through water flowing at a particular speed. For example, in a current of about 3 m.p.h. (say 150 cm./sec), 6 in. fish will have no chance of even stemming such water, 12 in. fish could traverse a maximum length of 6 ft. of it, 1 ft. 6 in. fish could traverse about 14 ft. and 24 in. fish about 26 ft. After such lengths of swimming a period of rest would be required before another effort. A somewhat reduced effort could be indulged in within seconds, an equally strenuous one possibly not for much longer.
- i
l
6-6 3 0 0
-"5 +4
200->
22 100
-I
60 cm. (c. 2 ft.)
(c 1 ft. 6 In.) 30 cm. (c. 12 In.)
15 cm (c. 6 In)
I i
[image:23.451.92.366.189.390.2]100 200 300 400 500 600 700 800 900 1000 cm. 15 30 ft. Maximum distance traversable
Fig. 16. Maximum distance traversable relative to the ground by four hypothetical fish swimming in water of various velocities. Data derived from Figs. 14 and 15.
The above argument assumes movement through water of constant velocity. Sir James Gray has shown (unpublished) that a fish entering water of increasing velocity could make use of the speed developed in a lower velocity region by travelling on his momentum quite a long way into the water of increasing velocity. Such an effect would tend to increase the distance that could be traversed. It is also important to stress that Fig. 16 represents an optimum effort on the part of the fish. If he swims either too fast or too slow he will not accomplish so much. Fig. 15 indicates the latitude he has, without seriously reducing his distance. In a 200 cm. current the 60 cm. fish will still cover over 500 cm. distance for speeds of swimming between 275 and 400 cm./sec. It is interesting to contemplate whether the fish has a means of judging his optimum by reference to, say, the bottom. It is certainly important that under conditions requiring a maximum accomplishment he should not be scared into trying to swim his fastest.
an appropriate velocity could ensure entry of the maximum number of fish and also exclusion, if desirable, of those of smaller size. A second application might concern the dimensions of the openings of trawls and other nets. The modern otter trawl has a headline of the order of 100 ft. in width, which, during working, may be 10 or 15 ft. above the sea bed. It is towed along at a speed of 3 to 4 knots. Fig. 16 suggests that most fish below 12 in. would be likely to be caught by such gear. A fish of 24 in. would manage a dart of about 20 ft. at this speed. If he is within that distance of the edge of the net and moves laterally he will escape. Within the central 60 ft. of the line of towing he cannot escape except by swimming upwards, where he is easily capable of getting over the top of the net. This, however, generally overhangs the foot-rope by perhaps 10 ft.; its tendency will therefore be to make him swim downwards and along the sea bed, to be caught eventually after tiring. Laterally the Vigneron Dahl gear will increase the effective spread of the net and, preceding it somewhat will tend to scare laterally placed fish inwards where, after one of their sudden darts they will be more readily caught. Even much bigger fish will by this means be brought into the catching power of the net. It seems unlikely that the trawl, developed by long years of experience, can be improved upon by information of this kind but the results do perhaps serve to emphasize how deadly a device it already is and also show, partly, why this is so.
SUMMARY
1. Measurements of the maximum speed sustained during bursts of swimming of up to 20 sec. duration by dace, trout and goldfish of various lengths are reported. 2. The ability to sustain periods of swimming appears to be related differently to length in different species. In the dace it is proportional to Z,1'09, in the trout and goldfish to Z,0"65.
3. The dependence of this relationship upon various factors is considered. It is concluded that allometric increase of muscle and the influence of an increasing Reynolds number, possibly combined with other, physiological, factors could adequately account for the variation observed.
4. The precise form of the speed/duration relationship differs in different species. These variations are also probably accountable for by a combination of different muscle percentages and fineness ratios together with other, physiological, factors.
5. The ability to maintain speed diminishes rapidly with increasing time interval in all the species measured. The maintained speed falls from about ioL/sec., main-tainable for only 1 sec. of swimming, down to $L/&ec. for 10 sec. and further to a cruising speed of about ^L/sec. by 20 sec. The nature of this time/speed relationship is considered to be determined by the ability of the muscle to utilize stores of raw material and by the rates at which these can be supplied to, and waste products removed from, the muscle.
I am indebted to many kind friends for their encouraging interest and help; particularly to Sir James Gray who made the work possible, to Dr R. H. J. Brown for his technical help and advice and to Dr K. E. Machin for his continued patient assistance with the mathematics.
REFERENCES
BATNBRIDGH, R. (1958 a). The speed of swimming of fish as related to size and to the frequency and amplitude of the tail beat. J. Exp. Biol. 35, 109-33.
BAINBRIDGE, R. (19586). The locomotion of fish. The New Scientist, 4, 476-8.
BAINBRIDGE, R. & BROWN, R. H. J. (1958). An apparatus for the study of the locomotion of fish. J. Exp. Biol. 35, 134-7.
BLACK, E. C. (1955). Blood levels of hemoglobin and lactic acid in some fresh water fishes following exercise. J. Fish. Res. Bd Can. 13, 917-29.
BLACK, E. C. (1956). Appearance of lactic acid in the blood of Kamloops and Lake trout following live transportation. Can. Fish Culturist, 18, 20—7.
BLACK, E. C. (1957). Alterations in the blood level of lactic acid in certain salmonid fishes following muscular activity. I. Kamloops trout, Sahno gairdneri. J. Fish. Res. Bd Can. 14, 117-34. BLASTER, J. H. S. & DICKSON, W. (1959). Observations on the swimming speeds of fish. J. Cons.
int. Explor. Mer. 24, 472-9.
BRETT, J. R., HOLLANDS, M. & ALDERICE, D. F. (1958). The effect of temperature on the cruising
speed of young sockeye and coho salmon. J. Fish. Res. Bd Can. 15, 587-605.
DAVIDSON, M. VIOLA (1949). Salmon and eel movement in constant circular current. J. Fish. Res. Bd Can. 7, 432-48.
ELSON, P. F. (1939). Order of appearance of scales in speckled trout. J. Fish. Res. Bd Can. 4, 302-8.
FRY, F. E. J. & HART, J. S. (1048). Cruising speed of goldfish in relation to water temperature. J. Fish. Res. Bd Can. 7, 169-75.
HILL, A. V. (1950). The dimension of animals and their muscular dynamics. Set. Progr. 38, 209-30. HOERNER, S. F. (1958). Fluid-Dynamic Drag. Chap. 13. Published by the author.
JACQUOT, R. & CREAC'H, P. V. (1950). Les protides du poisson et leur valeur alimentaire. Off. Set. Tech. Piches Marit., Notes et Rapp. (N.S.), 6, 1-48.
LE CREN, E. D. (1951). The length weight relationship and seasonal cycle in gonad weight and condition in the perch (Perca fluviatilis). J. Anhn. Ecol. 20, 201—19.
MAGNAN, A. (1930). Les charact^ristiques geom^tnques et physiques des poissons. Ann. Sci. nat 13.
355-489-PAULIK, G. J. & DELACY, A. C. (1957). Swimming abilities of upstream migrant silver salmon, sockeye salmon and steelhead at several water velocities. Univ. Wash. Scho. Fish. Tech. Rep 44. I-4O.
PAULIK, G. J. & DELACY, A. C. (1958). Changes in the swimming ability of Columbia river sockeye salmon during upstream migration. Univ. Wash. Scho. Fish. Tech. Rep. 46, 1-67.
PAULIK, G. J., DELACY, A. C. & STACY, E. F. (1957). The effect of rest on the swimming performance of fatigued adult silver salmon. Univ. Wash. Scho. Fish. Tech. Rep. 31, 1-21.
RADCLIFFE, R. W. (1950). The effect of fin clipping on the cruising speed of goldfish and coho salmon fry. J. Fish. Res. Bd Can. 8, 67-73.
REAY, G. A., CUTTING, C. L. & SHEWAN, J. M. (1943). The nation's food. VI. Fish as food. II. The chemical composition of fish. J. Soc. Chem. Ind. Trans. Comm. 6a, 77-85.