A novel lithium copper iron phosphate
with idealized formula
Li
5Cu
22+Fe
3+(PO
4)
4: crystal structure and
distribution of defects
Shailesh Upreti,aOlga V. Yakubovich,b Natasha A. Chernovaaand M. Stanley Whittinghama*
aChemistry and Materials, SUNY Binghamton, Binghamton, NY, USA, and bDepartment of Geology, Moscow State University, Moscow, Russian Federation Correspondence e-mail: stanwhit@gmail.com
Received 6 March 2011; accepted 30 March 2011
Key indicators: single-crystal X-ray study;T= 298 K; mean(P–O) = 0.002 A˚; disorder in main residue;Rfactor = 0.031;wRfactor = 0.086; data-to-parameter ratio = 11.9.
Gray–green single crystals were obtained under high-pressure, high-temperature hydrothermal conditions. A refinement of atom occupancies gave the composition Li3.68Cu
2+
Fe3+(Cu0.55
-Li0.45)2Fe 2+
0.15(PO4)4. The structure is built from triplets of
edge-sharing (Cu,Li)O5–FeO6–(Cu,Li)O5 polyhedra, CuO4
quadrilaterals and PO4 tetrahedra. In the (Cu,Li)O5
poly-hedra the Cu and Li positions are statistically occupied in a 0.551 (2):0.449 (2) ratio. Both FeO6 and CuO4 polyhedra
exhibit 1 symmetry. The positions of additional Li atoms with vacancy defects are in the interstices of the framework.
Related literature
For a related structure, see: Yakubovich et al. (2006). For related materials with low concentration of Cu atoms at Fe sites, see: Amineet al.(2000); Heoet al.(2009); Niet al.(2005); Yang et al.(2009). For information on bond-valence calcula-tions, see: Pyatenko (1972).
Experimental
Crystal data Cu2.10Fe1.15Li4.59(PO4)4
Mr= 609.63
Triclinic,P1
a= 4.8950 (14) A˚
b= 7.847 (2) A˚
c= 8.388 (2) A˚
= 69.472 (5)
= 89.764 (6)
= 75.501 (5)
V= 290.88 (13) A˚3
Z= 1
MoKradiation
= 5.87 mm1
T= 298 K
0.270.230.19 mm
Bruker SMART APEX diffractometer
Absorption correction: multi-scan (SADABS; Bruker, 2000)
Tmin= 0.235,Tmax= 0.332
100441 measured reflections 1775 independent reflections 1647 reflections withI> 2(I)
Rint= 0.023
Refinement
R[F2> 2(F2)] = 0.031
wR(F2) = 0.086
S= 1.20 1708 reflections
143 parameters
max= 0.66 e A˚
3
min=0.63 e A˚
3
Table 1
Selected bond lengths (A˚ ).
Cu1—O4i 1.936 (2) Cu1—O6 1.9430 (19) Fe1—O1 1.931 (2) Fe1—O5 2.038 (2) Fe1—O2 2.041 (2) Cu2—O8 1.969 (2) Cu2—O7 1.998 (2) Cu2—O6 2.003 (2) Cu2—O5 2.075 (2) Cu2—O2ii
2.171 (2) Li1—O3 1.967 (8) Li1—O4iii
2.028 (7)
Li1—O8iv 2.045 (7) Li1—O3v
2.124 (8) Fe2—O3 1.891 (6) Fe2—O8vi 2.063 (6) Fe2—O7vii 2.133 (7) Fe2—O6vi 2.236 (7) Fe2—O4iii 2.334 (6) Li3—O7 1.909 (8) Li3—O3viii 1.916 (7) Li3—O2viii 2.183 (11) Li3—O8ix 2.183 (10)
Symmetry codes: (i) x1;yþ2;zþ2; (ii) x;yþ2;zþ1; (iii)
x;yþ1;zþ2; (iv) x;yþ2;zþ2; (v) xþ1;yþ1;zþ2; (vi)
xþ1;y1;z; (vii)x;y1;z; (viii)x;yþ1;z; (ix)xþ1;y;z.
Data collection:SMART(Bruker, 2001); cell refinement:SAINT
(Bruker, 2002); data reduction:SAINT; program(s) used to solve structure:SHELXS97(Sheldrick, 2008); program(s) used to refine structure: SHELXL97 (Sheldrick, 2008); molecular graphics:
DIAMOND(Brandenburg, 2006); software used to prepare material for publication:publCIF(Westrip, 2010).
We thank the US Department of Energy, Office of Vehicle Technologies, for their financial support through the BATT program at LBNL. Financial support from the National Science Foundation, DMR 0705657, is greatly appreciated. Olga Yakubovich thanks the Russian Fund for Basic Resear-ches (Grant N 10–05-01068a) for the financial support.
Supplementary data and figures for this paper are available from the IUCr electronic archives (Reference: PK2312).
References
Amine, K., Yasuda, H. & Yamachi, M. (2000).Proc. Electrochem. Soc.99, 311– 325.
Brandenburg, K. (2006).DIAMOND. Crystal Impact GbR, Bonn, Germany. Bruker (2000).SADABS. Bruker AXS Inc., Madison, Wisconsin, USA. Bruker (2001).SMART. Bruker AXS Inc., Madison, Wisconsin, USA. Bruker (2002).SAINT. Bruker AXS Inc., Madison, Wisconsin, USA. Heo, J. B., Lee, S. B., Cho, S. H., Kim, J., Park, S. H. & Lee, Y. S. (2009).Mater.
Lett.63, 581–583.
Ni, J. F., Zhou, H. H., Chen, J. T. & Zhang, X. X. (2005).Mater. Lett.59, 2361– 2365.
Pyatenko, Yu. A. (1972).Sov. Phys. Crystallogr.17, 677–682. Sheldrick, G. M. (2008).Acta Cryst.A64, 112–122.
Westrip, S. P. (2010).J. Appl. Cryst.43, 920–925.
Yakubovich, O. V., Massa, W., Kireev, V. V. & Urusov, V. S. (2006).Dokl. Phys.
51, 474-480.
Yang, R., Song, X., Zhao, M. & Wang, F. (2009).J. Alloys Compd,468, 365– 369.
Structure Reports
Online
supporting information
Acta Cryst. (2011). E67, i29 [doi:10.1107/S1600536811011755]
A novel lithium copper iron phosphate with idealized formula
Li
5Cu
22+Fe
3+(PO
4)
4: crystal structure and distribution of defects
Shailesh Upreti, Olga V. Yakubovich, Natasha A. Chernova and M. Stanley Whittingham
S1. Comment
There has been much interest in understanding the chemical and physical behavior of a new class of materials that shows
reversible intercalation of lithium in the crystalline lattice for use in the next generation of Li ion batteries. Here we
report a new type of Li containing solid which could be of great interest to electrochemists.
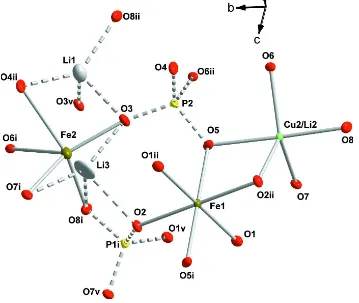
The asymmetric unit of the triclinic structure (Fig. 1) includes two tetrahedral P sites, both on the general position. The
Cu1 – O distances around the square–planar Cu2+ cation at the center of symmetry (1d site) are 1.936 (2) and 1.943 (2) Å.
Fe3+ cations in 1b Wyckoff site are surrounded by six O atoms, forming octahedral configuration with Fe—O bond
lengths in the interval 1.931 (2) – 2.041 (2) Å. The cation-anion distances in five-vertex polyhedra, occupied by Cu and
Li atoms in nearly equivalent amounts change from 1.969 (2) to 2.171 (2) Å; thus, the mixed occupation of the
polyhedron by Cu2+ and Li+ cations explains why the Jahn-Teller distorton of the polyhedron is not so evident. Two Li
sites with vacancy defects adopt five-vertex coordination, each with four closest oxygen atoms (Table 1), and one oxygen
atom at longer distances of 2.739 (11) Å (Li3 –O8) and 2.778 (8) Å (Li1 – O3). In addition, a position of low occupancy
for Fe2+ (Fe2) atoms has been found at 0.99 (1) Å from the Li3 site. Bond-valance sum data (Pyatenko, 1972) are
consistent with the assumed oxidation state of Cu and Fe.
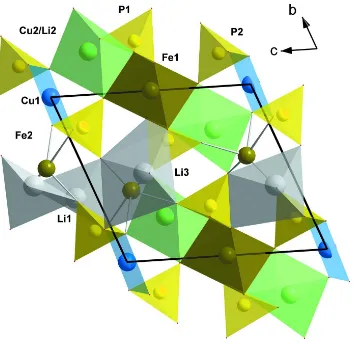
The basic features of the crystal structure consist of triplets of edge sharing (Cu,Li)2 – Fe1 –(Cu,Li)2 polyhedra (Fig.2)
and Cu1 quadrilaterals, that form a three-dimensional framework by sharing oxygen vertices. The PO4 tetrahedra
strengthen this framework by sharing all vertices with Fe1 octahedra and/or (Cu,Li)2 polyhedra (P1), while P2
tetrahedron shares one vertex with Fe1 and (Cu,Li)2 polyhedra, two vertices with Cu1 quadrilaterals, and one vertex (O3)
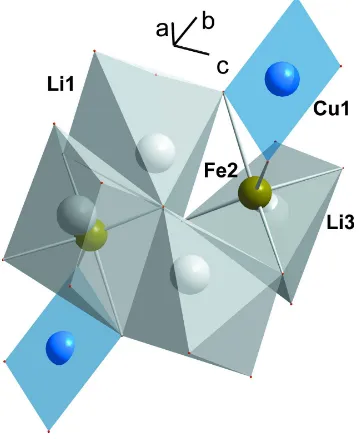
remains unshared with the cationic framework and participates in the coordination of Li atoms (Table 2). Li1 and Li3
atoms occupy interstices of the structure; they form tetra groups of five-vertex polyhedra sharing edges (Fig.3). The
structure may be described using an idealized formula Li5Cu2+2Fe3+(PO4)4; a similar lithium saturated iron phosphate with
isomorphous and vacancy defects in the position of Li atoms, having an idealized formula Li5Fe3+(PO4)2F2 was studied in
(Yakubovich et al., 2006). There are many reports in literature for crystal structures with low concentration of Cu atoms
in Fe sites (Amine et al., 2000; Heo et al., 2009, Yang et al., 2009, Ni et al., 2005), however, the present structure seems
to be a rare example of Cu rich three-dimensional matrix with Li+ ions in the interstices.
S2. Experimental
Single crystals were grown under high-temperature high-pressure hydrothermal conditions in the LiH2PO4—Fe2O3—
H3PO4 system. Fe2O3 and LiH2PO4, weight ratio 5:1, were placed in a copper ampule of 120 ml volume with 5, 10, 20, 30
or 40% water solution of H3PO4. The reaction was conducted at 400 °C, 1000 bar (1 bar = 10 5 Pa) for 100 h. The reaction
product was a mixture of brown, grayish-green, and blue-green crystals, white powder and copper chunks in a ratio
also analyzed with a Jeol 8900 Electron Microprobe for EDS elemental content. The conditions were optimized with an
acceleration potential of 15 kV and acurrent of 10 mA. The average result of 15 analyses showed the Cu: Fe: P ratio equal
to 0.47: 0.28: 1, which is close to the ratio 0.52: 0.29: 1 determined from single-crystal X-ray refinement.
S3. Refinement
Refinement of site occupancies showed that Cu2 and Li2 atoms share one position in the structure, in the proportion of
0.551 (2): 0.449. During the refinement, the displacement parameters of Cu2 and Li2 were constrained to be equal. The
oxidation states of Fe atoms in 1b and 2i Wyckoff sites were fixed in accordance with Fe - O distances and confirmed by
[image:3.610.128.487.236.539.2]bond valence calculation (Pyatenko, 1972).
Figure 1
The main structural elements of the title compound. Displacement ellipsoids are drawn at the 50% probability level.
Figure 2
Figure 3
The structure fragment showing the groups of five-vertex Li polyhedra sharing edges.
Pentalithium dicopper iron tetraphosphate
Crystal data
Cu2.10Fe1.15Li4.59(PO4)4 Mr = 609.63
Triclinic, P1 Hall symbol: -P 1
a = 4.8950 (14) Å
b = 7.847 (2) Å
c = 8.388 (2) Å
α = 69.472 (5)°
β = 89.764 (6)°
γ = 75.501 (5)°
V = 290.88 (13) Å3
Z = 1
F(000) = 293.9
Dx = 3.480 Mg m−3
Mo Kα radiation, λ = 0.71073 Å Cell parameters from 8918 reflections
θ = 2.4–28.3°
µ = 5.87 mm−1 T = 298 K Block, green
Data collection
Bruker SMART APEX diffractometer
Radiation source: fine-focus sealed tube Graphite monochromator
φ scans, and ω scans
Absorption correction: multi-scan (SADABS; Bruker, 2000)
Tmin = 0.235, Tmax = 0.332
100441 measured reflections 1775 independent reflections 1647 reflections with I > 2σ(I)
Rint = 0.023
θmax = 30.6°, θmin = 2.6° h = −7→7
k = −11→11
l = −12→12
Refinement
Refinement on F2
Least-squares matrix: full
R[F2 > 2σ(F2)] = 0.031 wR(F2) = 0.086 S = 1.20 1708 reflections 143 parameters 0 restraints
Primary atom site location: structure-invariant direct methods
Secondary atom site location: difference Fourier map
w = 1/[σ2(F
o2) + (0.040P)2 + 0.5P]
where P = (Fo2 + 2Fc2)/3
(Δ/σ)max = 0.001
Δρmax = 0.66 e Å−3
Δρmin = −0.63 e Å−3
Extinction correction: SHELXL97 (Sheldrick, 2010), Fc*=kFc[1+0.001xFc2λ3/sin(2θ)]-1/4
Extinction coefficient: 0.008 (3)
Special details
Geometry. All e.s.d.'s (except the e.s.d. in the dihedral angle between two l.s. planes) are estimated using the full covariance matrix. The cell e.s.d.'s are taken into account individually in the estimation of e.s.d.'s in distances, angles and torsion angles; correlations between e.s.d.'s in cell parameters are only used when they are defined by crystal symmetry. An approximate (isotropic) treatment of cell e.s.d.'s is used for estimating e.s.d.'s involving l.s. planes.
Refinement. Refinement of F2 against ALL reflections. The weighted R-factor wR and goodness of fit S are based on F2,
conventional R-factors R are based on F, with F set to zero for negative F2. The threshold expression of F2 > σ(F2) is used
only for calculating R-factors(gt) etc. and is not relevant to the choice of reflections for refinement. R-factors based on F2
are statistically about twice as large as those based on F, and R- factors based on ALL data will be even larger.
Fractional atomic coordinates and isotropic or equivalent isotropic displacement parameters (Å2)
x y z Uiso*/Ueq Occ. (<1)
Cu1 −0.5000 1.0000 1.0000 0.00809 (14)
Fe1 0.0000 1.0000 0.5000 0.00691 (15)
Cu2 −0.09925 (13) 1.25406 (8) 0.71583 (7) 0.0080 (2) 0.551 (2) Li2 −0.09925 (13) 1.25406 (8) 0.71583 (7) 0.0080 (2) 0.449 (2) P1 −0.37011 (14) 1.70119 (10) 0.53149 (9) 0.00622 (16)
P2 0.08696 (15) 0.80671 (10) 0.91211 (8) 0.00607 (16)
Li1 0.3243 (15) 0.3973 (10) 1.1070 (9) 0.023 (2) 0.92 (3) Fe2 0.3834 (13) 0.4186 (9) 0.8189 (9) 0.014 (2) 0.076 (3) Li3 0.262 (2) 1.5161 (15) 0.7187 (13) 0.040 (2) 0.924 (3) O1 0.2556 (4) 1.1578 (3) 0.4209 (3) 0.0106 (4)
Atomic displacement parameters (Å2)
U11 U22 U33 U12 U13 U23
Cu1 0.0056 (2) 0.0073 (2) 0.0128 (2) −0.00214 (17) 0.00253 (17) −0.00512 (18) Fe1 0.0061 (3) 0.0056 (3) 0.0090 (3) −0.00124 (19) 0.00114 (19) −0.0029 (2) Cu2 0.0102 (3) 0.0052 (3) 0.0078 (3) −0.0007 (2) 0.0029 (2) −0.0023 (2) Li2 0.0102 (3) 0.0052 (3) 0.0078 (3) −0.0007 (2) 0.0029 (2) −0.0023 (2) P1 0.0052 (3) 0.0056 (3) 0.0076 (3) −0.0011 (2) 0.0007 (2) −0.0023 (2) P2 0.0054 (3) 0.0060 (3) 0.0067 (3) −0.0009 (2) 0.0008 (2) −0.0026 (2) Li1 0.026 (4) 0.019 (4) 0.025 (4) −0.002 (3) −0.001 (3) −0.011 (3) Fe2 0.014 (3) 0.012 (3) 0.018 (4) −0.004 (2) 0.006 (2) −0.008 (3) Li3 0.058 (6) 0.050 (6) 0.036 (5) −0.024 (5) 0.013 (5) −0.037 (5) O1 0.0101 (9) 0.0133 (10) 0.0120 (9) −0.0062 (8) 0.0023 (7) −0.0069 (8) O2 0.0052 (9) 0.0095 (9) 0.0134 (9) −0.0009 (7) −0.0001 (7) −0.0063 (8) O3 0.0153 (10) 0.0115 (10) 0.0134 (9) 0.0000 (8) 0.0017 (8) −0.0079 (8) O4 0.0066 (9) 0.0084 (9) 0.0186 (10) −0.0015 (7) 0.0033 (8) −0.0055 (8) O5 0.0160 (10) 0.0091 (9) 0.0069 (8) −0.0058 (8) −0.0003 (7) −0.0023 (7) O6 0.0075 (9) 0.0101 (9) 0.0080 (8) −0.0053 (7) 0.0013 (7) −0.0044 (7) O7 0.0105 (9) 0.0128 (10) 0.0127 (9) −0.0055 (8) 0.0056 (7) −0.0075 (8) O8 0.0139 (10) 0.0088 (10) 0.0117 (9) 0.0013 (8) 0.0017 (8) −0.0003 (8)
Geometric parameters (Å, º)
Cu1—O4i 1.936 (2) P2—O5 1.545 (2)
Cu1—O6 1.9430 (19) P2—O6v 1.554 (2)
Fe1—O1 1.931 (2) Li1—O3 1.967 (8)
Fe1—O5 2.038 (2) Li1—O4vi 2.028 (7)
Fe1—O2 2.041 (2) Li1—O8v 2.045 (7)
Cu2—O8 1.969 (2) Li1—O3vii 2.124 (8)
Cu2—O7 1.998 (2) Fe2—O3 1.891 (6)
Cu2—O6 2.003 (2) Fe2—O8viii 2.063 (6)
Cu2—O5 2.075 (2) Fe2—O7ix 2.133 (7)
Cu2—O2ii 2.171 (2) Fe2—O6viii 2.236 (7)
P1—O7iii 1.521 (2) Fe2—O4vi 2.334 (6)
P1—O1iii 1.524 (2) Li3—O7 1.909 (8)
P1—O8 1.545 (2) Li3—O3x 1.916 (7)
P1—O2iv 1.555 (2) Li3—O2x 2.183 (11)
P2—O3 1.515 (2) Li3—O8xi 2.183 (10)
P2—O4 1.542 (2)
O4i—Cu1—O6 88.35 (9) O5—Cu2—O2ii 78.90 (8)
O1—Fe1—O5ii 88.97 (8) O7iii—P1—O1iii 111.94 (12)
O1—Fe1—O2 92.27 (9) O7iii—P1—O8 112.64 (12)
O5ii—Fe1—O2 82.88 (8) O1iii—P1—O8 106.40 (12)
O8—Cu2—O7 92.29 (9) O7iii—P1—O2iv 109.52 (12)
O7—Cu2—O6 136.25 (9) O8—P1—O2iv 105.43 (12)
O8—Cu2—O5 176.89 (9) O3—P2—O4 108.60 (12)
O7—Cu2—O5 90.75 (9) O3—P2—O5 111.10 (12)
O6—Cu2—O5 89.40 (9) O4—P2—O5 112.78 (12)
O8—Cu2—O2ii 99.79 (9) O3—P2—O6v 109.26 (12)
O7—Cu2—O2ii 102.81 (8) O4—P2—O6v 108.23 (12)
O6—Cu2—O2ii 120.07 (8) O5—P2—O6v 106.78 (11)