Bis(
N
-butyl-
N
-ethyldithiocarbamato-j
2S
,
S
000)nickel(II)
Wan Nur Shazwani Wan Juhari,aIbrahim Baba,aYang Farinaaand Seik Weng Ngb*
aSchool of Chemical Sciences, Universiti Kebangbaan Malaysia, 43600 Bangi,
Malaysia, andbDepartment of Chemistry, University of Malaya, 50603 Kuala
Lumpur, Malaysia
Correspondence e-mail: seikweng@um.edu.my
Received 21 February 2010; accepted 22 February 2010
Key indicators: single-crystal X-ray study;T= 293 K; mean(C–C) = 0.004 A˚;
Rfactor = 0.034;wRfactor = 0.098; data-to-parameter ratio = 23.2.
The dithiocarbamate anions in the title compound, [Ni(C7H14NS2)2], chelate to the Ni
II
atom, which is four-coordinate in a square-planar geometry. The NiIIatom lies on a center of inversion.
Related literature
For nickel bis(diethyldithiocarbamate) and nickel bis(di-butyldithiocarbamate), see: Bonamicoet al.(1965); Khanet al.
(1987); Lokajet al.(1984).
Experimental
Crystal data
[Ni(C7H14NS2)2] Mr= 411.33
Monoclinic,P21=n
a= 8.5641 (9) A˚
b= 8.6316 (9) A˚
c= 13.6047 (14) A˚
= 94.753 (2)
V= 1002.23 (18) A˚3
Z= 2
MoKradiation
= 1.38 mm1
T= 293 K
0.250.250.05 mm
Data collection
Bruker SMART APEX diffractometer
Absorption correction: multi-scan (SADABS; Sheldrick, 1996)
Tmin= 0.724,Tmax= 0.934
9338 measured reflections 2295 independent reflections 1628 reflections withI> 2(I)
Rint= 0.029
Refinement
R[F2> 2(F2)] = 0.034
wR(F2) = 0.098
S= 1.03 2295 reflections 99 parameters
6 restraints
H-atom parameters constrained
max= 0.38 e A˚
3
min=0.21 e A˚
3
Data collection:APEX2(Bruker, 2009); cell refinement:SAINT
(Bruker, 2009); data reduction:SAINT; program(s) used to solve structure:SHELXS97(Sheldrick, 2008); program(s) used to refine structure: SHELXL97 (Sheldrick, 2008); molecular graphics: X-SEED (Barbour, 2001); software used to prepare material for publication:publCIF(Westrip, 2010).
We thank Universiti Kebangsaan Malaysia (UKM-GUP-NBT-08-27-111 and 06-01-02-SF0539) and the University of Malaya for supporting this study.
Supplementary data and figures for this paper are available from the IUCr electronic archives (Reference: SJ2734).
References
Barbour, L. J. (2001).J. Supramol. Chem.1, 189–191.
Bonamico, M., Dessy, G., Mariani, C., Vaciago, A. & Zambonelli, L. (1965).
Acta Cryst.19, 619–626.
Bruker (2009).APEX2andSAINT. Bruker AXS Inc., Madison, Wisconsin, USA.
Khan, M. N. I., Fackler, J. P., Murray, H. H., Heinrich, D. D. & Campana, C. (1987).Acta Cryst.C43, 1917–1919.
Lokaj, J., Vrabel, V. & Kello, E. (1984).Chem. Zvesti,38, 313–317. Sheldrick, G. M. (1996).SADABS. University of Go¨ttingen, Germany. Sheldrick, G. M. (2008).Acta Cryst.A64, 112–122.
Westrip, S. P. (2010).publCIF. In preparation. Acta Crystallographica Section E
Structure Reports
Online
supporting information
Acta Cryst. (2010). E66, m339 [doi:10.1107/S1600536810006677]
Bis(
N
-butyl-
N
-ethyldithiocarbamato-
κ
2S
,
S
′
)nickel(II)
Wan Nur Shazwani Wan Juhari, Ibrahim Baba, Yang Farina and Seik Weng Ng
S1. Experimental
Nickel(II) chloride (10 mmol), butylethylamine (10 mmol) and carbon disulfide (10 mmol) were reacted in ethanol (50
ml) at 277 K to produce a brown solid. The mixture was stirred for an hour. The solid was collected and recrystallized
from ethanol.
S2. Refinement
Carbon-bound H-atoms were placed in calculated positions (C—H 0.96 to 0.97 Å) and were included in the refinement in
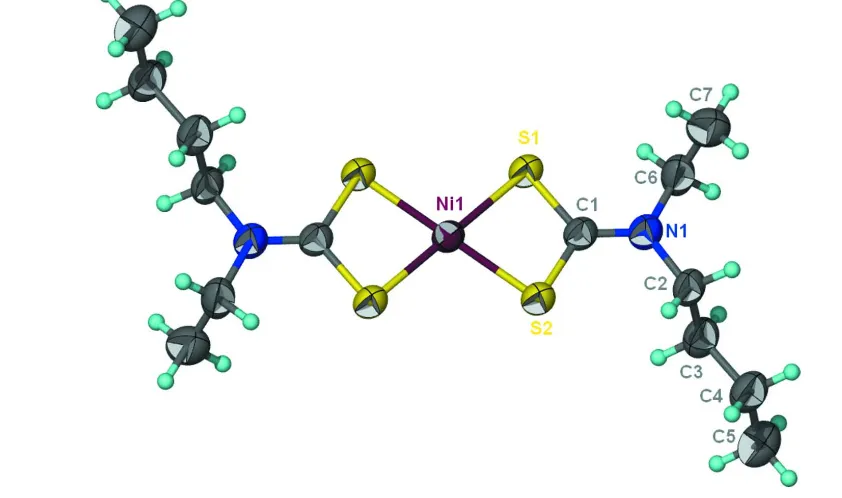
[image:2.610.81.502.338.587.2]the riding model approximation, with U(H) set to 1.2 to 1.5U(C).
Figure 1
Thermal ellipsoid plot (Barbour, 2001) of Ni(C7H14NS2)2 at the 50% probability level; hydrogen atoms are drawn as
spheres of arbitrary radius.
Bis(N-butyl-N-ethyldithiocarbamato- κ2S,S′)nickel(II)
Crystal data
[Ni(C7H14NS2)2]
Mr = 411.33
Monoclinic, P21/n
a = 8.5641 (9) Å
b = 8.6316 (9) Å
c = 13.6047 (14) Å
β = 94.753 (2)°
V = 1002.23 (18) Å3
Z = 2
F(000) = 436
Dx = 1.363 Mg m−3
Mo Kα radiation, λ = 0.71073 Å Cell parameters from 2307 reflections
θ = 2.4–24.6°
µ = 1.38 mm−1
T = 293 K Plate, brown
0.25 × 0.25 × 0.05 mm
Data collection
Bruker SMART APEX diffractometer
Radiation source: fine-focus sealed tube Graphite monochromator
ω scans
Absorption correction: multi-scan (SADABS; Sheldrick, 1996)
Tmin = 0.724, Tmax = 0.934
9338 measured reflections 2295 independent reflections 1628 reflections with I > 2σ(I)
Rint = 0.029
θmax = 27.5°, θmin = 2.7°
h = −10→11
k = −11→11
l = −17→15
Refinement
Refinement on F2
Least-squares matrix: full
R[F2 > 2σ(F2)] = 0.034
wR(F2) = 0.098
S = 1.03 2295 reflections 99 parameters 6 restraints
Primary atom site location: structure-invariant direct methods
Secondary atom site location: difference Fourier map
Hydrogen site location: inferred from neighbouring sites
H-atom parameters constrained
w = 1/[σ2(F
o2) + (0.0469P)2 + 0.1755P]
where P = (Fo2 + 2Fc2)/3
(Δ/σ)max = 0.001
Δρmax = 0.38 e Å−3
Δρmin = −0.21 e Å−3
Fractional atomic coordinates and isotropic or equivalent isotropic displacement parameters (Å2)
x y z Uiso*/Ueq
Ni1 0.5000 0.5000 0.5000 0.05331 (16)
S1 0.75597 (8) 0.48176 (8) 0.53089 (5) 0.0629 (2)
S2 0.52687 (8) 0.56847 (9) 0.65651 (5) 0.0631 (2)
N1 0.8339 (3) 0.5601 (3) 0.72015 (17) 0.0647 (6)
C1 0.7236 (3) 0.5403 (3) 0.64766 (19) 0.0564 (6)
C2 0.7964 (3) 0.6124 (3) 0.81795 (18) 0.0658 (7)
H2A 0.7008 0.6732 0.8111 0.079*
H2B 0.8799 0.6791 0.8456 0.079*
C3 0.7752 (4) 0.4796 (3) 0.8887 (2) 0.0746 (8)
H3A 0.6875 0.4163 0.8630 0.090*
H3B 0.8684 0.4154 0.8928 0.090*
C4 0.7460 (4) 0.5353 (4) 0.9904 (2) 0.0836 (9)
H4A 0.6554 0.6032 0.9856 0.100*
H4B 0.8355 0.5955 1.0167 0.100*
C5 0.7180 (4) 0.4044 (4) 1.0615 (2) 0.1014 (11)
H5A 0.6962 0.4470 1.1241 0.152*
H5B 0.8098 0.3403 1.0699 0.152*
C6 1.0008 (4) 0.5276 (4) 0.7074 (2) 0.0805 (9)
H6A 1.0079 0.4559 0.6530 0.097*
H6B 1.0490 0.4791 0.7667 0.097*
C7 1.0871 (4) 0.6734 (4) 0.6871 (2) 0.0951 (10)
H7A 1.1957 0.6500 0.6818 0.143*
H7B 1.0780 0.7453 0.7401 0.143*
H7C 1.0432 0.7183 0.6265 0.143*
Atomic displacement parameters (Å2)
U11 U22 U33 U12 U13 U23
Ni1 0.0586 (3) 0.0553 (3) 0.0464 (3) −0.0031 (2) 0.0063 (2) −0.00089 (19)
S1 0.0628 (4) 0.0763 (4) 0.0504 (4) 0.0013 (3) 0.0095 (3) −0.0089 (3)
S2 0.0589 (4) 0.0785 (5) 0.0526 (4) 0.0006 (3) 0.0090 (3) −0.0081 (3)
N1 0.0596 (13) 0.0780 (14) 0.0572 (13) 0.0057 (11) 0.0077 (11) −0.0171 (12)
C1 0.0629 (16) 0.0556 (14) 0.0513 (15) −0.0005 (11) 0.0083 (12) −0.0052 (11)
C2 0.0670 (17) 0.0758 (17) 0.0542 (16) 0.0016 (13) 0.0023 (13) −0.0198 (13)
C3 0.080 (2) 0.080 (2) 0.0629 (18) 0.0053 (14) 0.0010 (15) −0.0130 (15)
C4 0.093 (2) 0.096 (2) 0.0621 (19) 0.0055 (17) 0.0047 (17) −0.0136 (17)
C5 0.118 (3) 0.111 (3) 0.074 (2) 0.001 (2) 0.002 (2) 0.000 (2)
C6 0.0653 (18) 0.109 (3) 0.0660 (19) 0.0082 (17) −0.0034 (15) −0.0236 (17)
C7 0.076 (2) 0.125 (3) 0.086 (2) 0.008 (2) 0.0171 (17) −0.006 (2)
Geometric parameters (Å, º)
Ni1—S1i 2.2032 (8) C3—H3B 0.9700
Ni1—S1 2.2032 (8) C4—C5 1.519 (4)
Ni1—S2 2.2034 (7) C4—H4A 0.9700
Ni1—S2i 2.2034 (7) C4—H4B 0.9700
S1—C1 1.712 (3) C5—H5A 0.9600
S2—C1 1.716 (3) C5—H5B 0.9600
N1—C1 1.319 (3) C5—H5C 0.9600
N1—C2 1.466 (3) C6—C7 1.497 (4)
N1—C6 1.481 (4) C6—H6A 0.9700
C2—C3 1.517 (4) C6—H6B 0.9700
C2—H2A 0.9700 C7—H7A 0.9600
C2—H2B 0.9700 C7—H7B 0.9600
C3—C4 1.505 (4) C7—H7C 0.9600
C3—H3A 0.9700
S1i—Ni1—S1 180.0 H3A—C3—H3B 107.9
S1i—Ni1—S2 100.82 (2) C3—C4—C5 113.3 (3)
S1—Ni1—S2 79.18 (2) C3—C4—H4A 108.9
S1i—Ni1—S2i 79.18 (2) C5—C4—H4A 108.9
S1—Ni1—S2i 100.82 (2) C3—C4—H4B 108.9
S2—Ni1—S2i 180.0 C5—C4—H4B 108.9
C1—S1—Ni1 85.45 (10) H4A—C4—H4B 107.7
C1—N1—C2 121.4 (2) C4—C5—H5B 109.5
C1—N1—C6 121.7 (2) H5A—C5—H5B 109.5
C2—N1—C6 116.8 (2) C4—C5—H5C 109.5
N1—C1—S1 124.8 (2) H5A—C5—H5C 109.5
N1—C1—S2 125.1 (2) H5B—C5—H5C 109.5
S1—C1—S2 110.04 (16) N1—C6—C7 111.0 (3)
N1—C2—C3 113.0 (2) N1—C6—H6A 109.4
N1—C2—H2A 109.0 C7—C6—H6A 109.4
C3—C2—H2A 109.0 N1—C6—H6B 109.4
N1—C2—H2B 109.0 C7—C6—H6B 109.4
C3—C2—H2B 109.0 H6A—C6—H6B 108.0
H2A—C2—H2B 107.8 C6—C7—H7A 109.5
C4—C3—C2 112.3 (2) C6—C7—H7B 109.5
C4—C3—H3A 109.1 H7A—C7—H7B 109.5
C2—C3—H3A 109.1 C6—C7—H7C 109.5
C4—C3—H3B 109.1 H7A—C7—H7C 109.5
C2—C3—H3B 109.1 H7B—C7—H7C 109.5
S2—Ni1—S1—C1 −0.24 (9) Ni1—S1—C1—S2 0.32 (12)
S2i—Ni1—S1—C1 179.76 (9) Ni1—S2—C1—N1 180.0 (2)
S1i—Ni1—S2—C1 −179.76 (9) Ni1—S2—C1—S1 −0.32 (12)
S1—Ni1—S2—C1 0.24 (9) C1—N1—C2—C3 94.2 (3)
C2—N1—C1—S1 179.3 (2) C6—N1—C2—C3 −84.6 (3)
C6—N1—C1—S1 −2.0 (4) N1—C2—C3—C4 176.7 (3)
C2—N1—C1—S2 −1.0 (4) C2—C3—C4—C5 177.8 (3)
C6—N1—C1—S2 177.6 (2) C1—N1—C6—C7 98.5 (3)
Ni1—S1—C1—N1 −180.0 (2) C2—N1—C6—C7 −82.8 (3)