Failure behavior of composite laminates
under four-point bending
Murat Koc, Fazil O Sonmez, Nuri Ersoy and Kenan Cinar
Abstract
In this study, failure behavior of fiber-reinforced composites under four-point bending is investigated. First, the tests are modeled analytically using the classical lamination theory (CLT). The maximum allowable moment resultants of [ 12]Toff-axis laminate as well as balanced and symmetric angle-ply [3/3]scomposite laminates as a function of fiber orientation angle,, are obtained using Tsai-Wu, maximum stress, maximum strain, Hashin, Tsai-Hill, Hoffman, quadric surfaces, modified quadric surfaces, and Norris failure criteria. Second, the same tests are simulated using the finite element method (FEM). Thermal residual stresses are calculated and accounted for in the failure analysis. An analysis is conducted for optimal positioning of the supports so as to ensure that intralaminar failure modes dominate interlaminar (delam-ination) failure mode. A test setup is then constructed accordingly and experiments are conducted. The correlation of the predicted failure loads and the experimental results is discussed. The quadric surfaces criterion is found to correlate better with the experimental results among the chosen failure criteria for the selected configurations.
Keywords
Laminated composites, failure criteria, residual stresses, out-of-plane loading, four-point bending, classical lamination theory, finite element modeling
Introduction
Composite materials are widely used because of their high stiffness-to-weight and strength-to-weight ratios. Composites can be tailored to achieve desired character-istics by changing their laminate configurations in the design stage. For the safe use of composite plates, one should use reliable failure theories during design stage that will correctly predict failure under given loading conditions for any chosen laminate configuration.
There are numerous failure criteria proposed to pre-dict macroscale failure in composite structures in the literature.1–6 These failure criteria can be classified in several ways: the ones with or without stress inter-action, stress or strain based, failure mode dependent or independent, linear or quadratic, physically based, i.e. based on failure mechanisms, etc.
Reliability of a failure criterion depends on its success in being able to accurately predict the failure for any different combinations of layup configuration, material, and loading condition. In many industrial applications, composite plates are subjected not to only in-plane loads but also out-of-plane loads. Recognizing that in-plane and out-of-plane responses of composite laminates can be quite different,7 a criterion validated for in-plane loading cannot be assumed to be also valid for
out-of-plane loads. For this reason, there is a need to fully examine the validity of the failure criteria for out-of-plane loads. In this way, safety of a design can be ensured during a design process. Validity and reliability of composite failure criteria are well studied for in-plane loads.8–15 However, similar studies are quite limited in number for out-of-plane loads (i.e. bending moment, twisting moment, transverse force, or a combination of them), and the existing ones16–22are not comprehensive; only some chosen configurations were studied under out-of-plane loads: [08/908]s, [908/08]s, [(0/90)8]s, [(45/0/
45)5]s, [018/(90/90)]s,16 [(45/90/0)3]s,17 [(04/904)2]s,
[453/04/453/903]s,18 [014/(22/22)3]s, [016/(39/39)2]s,
[018/(90/90)]s,19 [(45/90/0)3]s,20 [5]8, [15]8, [52/154/52],
[152/54/152], [152/52/152/52], [52/152/52/152].22 In these
studies, usually three-point bending tests were per-formed.16,17,19–21 The disadvantage of this test setup is that the line force applied by the upper support causes
Department of Mechanical Engineering, Bogazici University, Istanbul, Bebek, Turkey
Corresponding author:
Fazil O Sonmez, Department of Mechanical Engineering, Bogazici University, Istanbul, Bebek 34342, Turkey.
non-uniform bending moment in the critical region of the plate. In that case, finite element results highly depend on mesh density. Besides, not only bending moment, but also transverse shear stress is induced; therefore, their separate effects cannot be differentiated. Three-point bending tests are normally used to measure shear strength of materials. Considering that the critical region is small, strength highly depends on the local density of micro defects in that region. Different distri-butions of defects in different specimens reduce the reli-ability of strength measurements. On the other hand, in four-point bending test specimens, predominantly bend-ing moment develops between the loadbend-ing locations. In the world-wide failure exercise (WWFE), Kaddour et al.13compared the predictions of several criteria for [þ30/90/30/90]s glass/epoxy laminates under pure
bending, but experimental correlation was not investi-gated. That study demonstrated that the predictions of the criteria exhibited a wide variation in strain values as well as in the initial location of damage. Kaddour and Hinton14,15benchmarked failure theories for test cases in which hydrostatic pressure and shear loads were applied that induced triaxial stresses in the specimens.
For a failure theory, not only the accuracy of the predictions for some selected configurations, but also the accuracy of the predicted failure trend is important especially for design optimization studies. Typically, laminate configurations are optimized by varying fiber orientation angles of laminae. If a failure theory is used that incorrectly estimates the failure trend, i.e. increas-ing or decreasincreas-ing trend of failure load with the change in the lamina angle, the optimization algorithm may converge on an inferior design. No experimen-tal study exists on the failure trend for out-of-plane loads.
Because of the difference between the thermal expan-sion coefficients in the directions along and transverse to the fiber, residual stresses develop after laminae with different fiber orientations are joined at a high tempera-ture and cooled down. Those macroscopic stresses may even cause matrix cracks during the cooling process before the application of mechanical loads.23 They may also lead to premature failure under loading.
In this study, the failure behavior of fiber-reinforced composites under out-of-plane loads is investigated. For this purpose, a four-point bending test setup is designed and constructed such that the intralaminar failure modes will be more critical than the delamin-ation failure mode. [12]T off-axis laminates and
balanced and symmetric angle-ply [3/3]s composite
laminates are tested. The experiments are repeated five times to obtain their strength. The tests are simulated using both the classical lamination theory (CLT) and the finite element method (FEM), and the maximum allowable moment resultants, Mmax, as a function of
fiber orientation angle, , are obtained using different failure criteria. For balanced and symmetric angle-ply laminates, the thermal residual stresses are taken into consideration in order to enhance the reliability of the analytical and numerical results. The values of Mmax
obtained numerically and analytically are then com-pared with the test results for specimens with [12]T
and [3/3]s layup sequences for fiber angles of 0,
5, 15, 30, 45, 60, 75, and 90. In this way, not
only the accuracy of the predictions is examined, but also the correlation of the predicted failure trend with the experimental results is checked.
Analytical model of four-point
bending test
In order to apply the failure theories, the stress and strain states in the composite structure induced during testing need to be determined. These can be obtained via a structural analysis. For this purpose, both analytical and numerical methods are used in the pre-sent study.
The thickness of the specimens is small compared to their width and length (less than one-twentieth). In that case, the out-of-plane stress components can be assumed to be negligibly small (zz¼xz¼yz¼0).
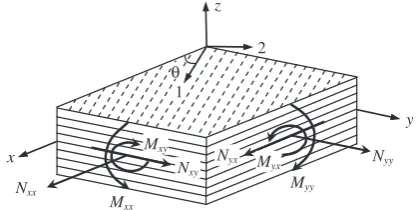
Classical lamination theory (CLT) can then be utilized to relate the loading to the resulting stress and strain states. The loads on a laminate may be in-plane, Nxx,
[image:2.595.356.476.476.516.2]Nyy,Nxy, or out-of-plane,Mxx,Myy,Mxy, as shown in
Figure 1. Application of the loads creates strains that vary linearly through the thickness. In-plane strain state is expressed as24
"xx "yy xy 8 < : 9 = ;¼
"0xx "0yy 0 xy 8 < : 9 = ;þz
xx yy xy 8 < : 9 =
; ð1Þ
where"oxx,"oyy, andxyo are the overall mid-plane strains and xx, yy, and xy are the overall curvature terms,
respectively. The stress components are related to the
[image:2.595.310.519.589.694.2]Nxx Nyy Nyx 2 x z y 1 θ Nxy Myy Mxx Mxy Myx
strain components as xx yy xy 8 < : 9 = ; k ¼
Q11 Q12 Q16 Q12 Q22 Q26 Q16 Q26 Q66
2 4 3 5 k "xx "yy xy 8 < : 9 = ; k
"Txx "Tyy xyT 8 < : 9 = ; k 0 @ 1 A
ð2Þ
wherekis the lamina number counted from the bottom, Qijare the components of the reduced stiffness matrix,
which depend on the fiber orientation, k, and elastic properties of the material along the principal material directions, E1, E2, G12, n12, andn2124and "Txx, "Tyy,xyT
are the thermal strains given by xxT, yyT, and
xyT. T is the temperature difference between the
cure temperature and the room temperature and xx,
yy, and xy are the thermal expansion coefficients in
the global x-direction, y-direction, and x–y plane, respectively.
Stress resultants (forces and bending moments per unit lateral length of a cross section) are obtained by through-the-thickness integration of the stresses in each ply as24
Nxx Nyy Nxy 8 < : 9 = ;¼
Zh=2
h=2 xx yy xy 8 < : 9 = ;dz¼
X2m
k¼1 Z zk
zk1 xx yy xy 8 < : 9 = ; k dz
ð3Þ
Mxx Myy Mxy 8 < : 9 = ;¼
Zh=2
h=2 xx yy xy 8 < : 9 = ;zdz¼
X2m
k¼1 Zzk
zk1 xx yy xy 8 < : 9 = ; k
zdz
ð4Þ
Herem is the number of distinct laminae in one of the symmetric portions above or below the mid-plane. Substituting equation (1) into equation (2), which is in turn substituted into equations (3) and (4), one can obtain
NxxþNTxx NyyþNTyy
NxyþNTxy
MxxþMTxx
MyyþMTyy
MxyþMTxy 8 > > > > > > > > > < > > > > > > > > > : 9 > > > > > > > > > = > > > > > > > > > ; ¼
A11 A12 A16
A12 A22 A26
A16 A26 A66
B11 B12 B16
B12 B22 B26
B16 B26 B66
B11 B12 B16
B12 B22 B26
B16 B26 B66
D11 D12 D16
D12 D22 D26
D16 D26 D66 2 6 6 6 6 6 6 6 6 4 3 7 7 7 7 7 7 7 7 5 "0 xx "0 yy xy0 xx yy xy 8 > > > > > > > > > < > > > > > > > > > : 9 > > > > > > > > > = > > > > > > > > > ;
ð5Þ
whereAij is membrane stiffness component, Dij is the
bending stiffness component, and Bij are bending–
extension coupling stiffness components. The expres-sions for Aij,Bij,and Dij and the solution of
equation (5) can be found in Hyer et al.25If a laminate is multidirectional, thermal force and moment result-ants should also be taken into account in the failure analyses. They are calculated as
NT xx NT yy NT xy 8 < : 9 = ;¼
X2m
k¼1
Q11 Q12 Q16
Q12 Q22 Q26
Q16 Q26 Q66 2 4 3 5 k xx yy xy 8 < : 9 =
;ðzkzk1ÞT
ð6Þ
MT xx MTyy MT xy 8 < : 9 = ;¼
X2m
k¼1
Q11 Q12 Q16 Q12 Q22 Q26
Q16 Q26 Q66 2 4 3 5 k xx yy xy 8 < : 9 = ; z 2 kz
2 k1
T:
ð7Þ
Only symmetric laminates are considered in this study; then, the bending–extension coupling matrix terms,Bij,
(equation (5)) reduce to zero. Because of symmetry, thermal bending resultants, MT
xx,MTyy, and,MTxy, are
obtained to be zero from equation (5). Considering that the bars of the four-point bending test fixture pre-vent twisting of the composite plate specimen at four locations, the twisting curvature,xy, is taken as zero.
Then the corresponding twisting moment,Mxy, applied
by the bars is unknown. The bending moment resultant Myy is taken as zero. The bending moment on the x-plane,Mxx, has such a magnitude that it makes the
failure index equal to zero; in other words, it causes initial failure in the laminate. The fixture does not apply in-plane loads; hence, Nxx, Nyy, and Nxy are
equal to zero. Solving equation (5), the six unknown terms are obtained, "o
xx, "oyy, xyo , xx, yy, and Mxy.
Substituting them into equation (1), strain components with respect to global coordinates,"xx,"yy, and"xy are
obtained. From equation (2), stress components at each lamina,xx,yy, andxy, are determined. Using tensor
transformation rules, strain and stress components in the principal material coordinates,"11,"22,"12 and11, 22, 12, respectively, can be obtained. Based on this
information, failure analyses can be carried out.
Intralaminar failure criteria for laminated
composites
Tsai-Wu, maximum stress, maximum strain, Hashin, Tsai-Hill, Hoffman, quadric surfaces, modified quadric surfaces, and Norris. In order to apply these criteria, the material strength data in principal material direc-tions are needed; that means tensile and compressive strengths along the fibers, Xt and Xc, and transverse
to them, Yt and Yc, respectively, and shear strength,
S12 are needed. These are readily available properties
for most of the composite materials. There are numer-ous failure criteria proposed in the literature other than the ones selected in the present study. The failure cri-teria requiring different strength data obtained through special experimental setups such as LARC0326are not considered in the present study. The ones based on micromechanics and progressive failure models are also not considered. Benchmarking these criteria against the four-point bending tests is left as a future study.
Tsai-Wu failure criterion1 is a non-linear stress-based criterion which accounts for stress interaction; however, it does not predict failure mode. According to this criterion, the failure is predicted under plane stress state as24
2 11
XtjXcj
ffiffiffiffiffiffiffiffiffiffiffiffiffiffiffiffiffiffiffiffi1122
XtXcYtYc
p þ
2 22
YtjYcj
þ 1 Xt þ 1 Xc 11 þ 1 Yt þ 1 Yc 22þ 2 12 S2 12 1:
ð8Þ
The maximum allowable moment resultant, Mmax, is
the magnitude of Mxx that makes the left hand side
equal to 1.0.
Tsai-Hill is a stress-based, quadratic, failure mode independent criterion accounting for stress interaction. According to the criterion, failure occurs if equation (9) is satisfied24
11
X
2
1122
X2 þ
22
Y
2
þ 12 S12 2
1 ð9Þ
wherein X and Y are either tensile or compression strength depending on the sign of the respective stresses. Hoffman criterion2is a stress-based, quadratic, fail-ure mode independent criterion which accounts for stress interaction. This criterion is stated as
211 XtjXcj
þ1122 XtXc
þ
2 22
YtjYcj
þ 1 Xt þ 1 Xc 11 þ 1 Yt þ 1 Yc 22þ 122 S2 12 1:
ð10Þ
The quadric surfaces criterion3 is a stress-based, non-linear, failure mode independent failure criterion with
stress interaction. This criterion states that failure occurs if the following equation is satisfied
a X2 2 11þ a Y2 2 22þ a S212
2 12þ
b
XY1122þ b XS12
1112
þ b
YS12
2212þ
c X11þ
c Y22þ
c S12
121
where a ¼0.98, b ¼0.49, and c¼ 0.002,3 which are found by employing stability conditions and enforcing satisfaction of the equation for special loading cases likeaþc¼1 for 11¼X, 22¼12 ¼0.
The modified quadric surfaces4is a modification of the quadric surfaces criterion. The difference between them is that the coefficients of in-plane and shear cou-pling terms are assumed to be zero in the latter one. Accordingly, the equation becomes
a X2 2 11þ a Y2 2 22þ a S2 12
122 þ b XY1122
þc X11þ
c Y22þ
c S12
121:
ð12Þ
Norris5 proposed a failure theory for orthotropic materials based on the Hencky-von Mises energy theory. It is a non-linear, stress-based criterion. The criterion accounts for stress interaction. According to Norris, the onset of failure occurs if at least one of the following equations is satisfied5
11
X
2
þ 22 Y
2
1122
XY þ
12
S12 2
1
or 11 X
2
1
or 22 Y
2
1:
ð13Þ
The maximum stress criterion is a linear, stress-based, failure mode dependent criterion without stress inter-action. This criterion claims that failure occurs if one of the following conditions is satisfied24
Xt 11or11 Xc
Yt 22or22 Yc
orj12j S12:
ð14Þ
The maximum strain criterion is linear, strain based, and failure mode dependent; yet, it does not account for interaction between strains. According to this cri-terion, failure occurs if24
"11 X"c orX"t "11 ð15Þ
orS"j"12j ð17Þ
where X"t,X"c,Y"t, andY"care the maximum allowable
tensile and compressive strains in the 1 and 2 directions (Figure 1), respectively, S"is the maximum shear strain in the 1–2 plane.
Hashin’s criterion6 is a nonlinear and physically based failure criterion, which can predict the failure mode. It also accounts for stress interaction. According to the criterion, failure occurs under plane stress condition, if one of the following conditions occurs 2 11 X2 t þ 2 12 S2 12
1 if1140 ð18Þ
11
Xc
1 if1150 ð19Þ
2 22 Y2 t þ 2 12 S2 12
1 if2240 ð20Þ
22
2S23 2
þ Yc
2S23 2
1
" # 22
Yc
þ 12 S12 2
1
if2250
ð21Þ
where S23is the maximum out-of-plane allowable shear
stress in 2–3 plane.
Finite element modeling of four-point
bending test
Finite element analysis of the plate is performed using commercial software ANSYS. SOLID185, a layered 3-D structural solid element, is used to generate mesh in the structural volume. SOLID185 is defined by eight nodes having three-degrees of freedom at each node; translations in the x, y, and z directions.27 First, a finite element modeling of the test is developed. Second, a convergence analysis is carried out. Third, an analysis is conducted for optimal positioning of the loads so as to ensure that the intralaminar failure modes dominate over the delamination failure mode. For this purpose, the results of a delamination criter-ion28 are compared with the results of Tsai-Wu and maximum stress failure criteria for different loading positions. Then, simulations are conducted using the optimal loading condition in which the most likely fail-ure mode is intralaminar failfail-ure, not delamination. Lastly, all of the criteria are implemented into ANSYS, andMmaxpredictions are obtained as a
func-tion of fiber orientafunc-tion angle.
The specimen and the loading conditions are mod-eled, failure criteria are applied and the maximum
allowable moment resultants, Mmax, are found using
ANSYS Parametric Design Language (APDL). Mmax
values are computed for fiber orientation angles, , from 0 to 90 with 1 increments.
First, 3-D model of the plate is built, fiber orienta-tion angle is defined, and mesh is generated. Then, boundary conditions are defined. The nodes which coincide with bottom supports are held in the trans-verse, or z, direction. Tests are conducted under dis-placement control. In order to simulate the real test conditions, a displacement is defined for the nodes located at the position of the top supports. In order to account for thermal loads and calculate the resulting residual stresses, a thermal loading step prior to the mechanical loading step is included in the finite element analysis by introducing DT (temperature difference between the cure temperature and the room tempera-ture) to the FE model. This thermal step simulates cool-ing of the laminate from the process temperature (180C) to the room temperature (25C) and calculates
ply-level residual stresses due to mismatch between the coefficients of thermal expansion in the fiber and trans-verse directions; thus the magnitude of the residual stresses is independent of the mechanical loading con-ditions. After solution, stress and strain components at each node are obtained and failure analysis is carried out using the selected criteria. The analytical model based on CLT provides 2D-stress and strain states within the plate. In order to obtain the failure loads based on this information, 2D definitions of the failure criteria given by equations (8) to (21) are used. The FE model provides 3D-stress and strain states within the plate. Accordingly, 3D definitions of the criteria are used to calculate the failure loads. Definitions of Tsai-Wu, maximum stress, maximum strain and Hashin failure criteria come as default in ANSYS; how-ever, Tsai-Hill, Hoffman, quadric surfaces, modified quadric surfaces, and Norris criteria are implemented to the software using the parametric design language. The results of the nodes around the support locations are excluded in the failure analysis, because trated loads defined at the nodes cause stress concen-tration much severer than the actual case.
The objective is to determine the loading, in this case downward displacement of the upper support, such that the maximum failure index becomes equal to 1.0. This is found iteratively after successive solutions using secant method. Then the reaction force at a support, F, is obtained utilizing post-processing commands. Using the value ofFat the time of failure and the dis-tance between the upper and lower supports, a, the maximum allowable moment resultant,Mmax, is
calcu-lated byMmax¼Fmaxa.
increase the accuracy of the results. However, in some cases, model may contain singularity points, e.g. regions where concentrated forces exist. A concen-trated force is considered to be applied on a region with zero area. A high mesh density around concentrated loads may result in unrealistically high stress levels. Besides that, computational cost may increase remark-ably. Optimum mesh density should be determined before FE analyses are carried out.
Convergence analysis is performed for the middle regions, where predominantly bending moment devel-ops. Tension and compression stresses occur due to bending moment below and above the mid-plane, respectively. Therefore, the maximum failure index at the top and the bottom, where the maximum stress develops, is considered in the convergence analysis.
Finite element models are developed for a 12-layered 48962.208 (mm3) composite plate using different element sizes by dividing the length, width, and thick-ness for different numbers of divisions. The maximum failure index is computed using Tsai-Wu and maximum stress failure criteria and modified Hashin delamination criterion28for each case. The delamination criterion is implemented into the software using the user program-mable features of ANSYS.27 Based on the results, the size of a finite element is chosen as 1.0 mm along the length and width of the plate. The thickness of the elements is chosen the same as the thickness of a ply, which is 0.184 mm.
Test-setup design
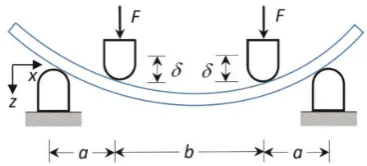
The setup is schematically depicted in Figure 2. In this part of the study, the optimum support positions are sought to minimize the likelihood of delamination. While the bottom supports are kept at the same pos-ition (at the right and left edges of the plate), different locations for the top supports are tried. The distance between the top supports and the nearest edges is chan-ged from 14 to 32 mm with 2-mm increments for every 15 of fiber orientation angle,, from 0 to 90;
delam-ination as well as intralaminar failure analyses are repeated for each configuration in order to find the
setup design for which delamination risk is minimum. The delamination criterion28is formulated as follows.
Delamination in tension (s33>0)
332 Z2
t
þ
2 13
S213þ 223
S2231: ð22Þ
Delamination in compression (s33<0)
2 33
Z2
c
þ
2 13
S2 13
þ
2 23
S2 23
1 ð23Þ
whereZdenotes strength in the three directions and S13
and S23refer to out-of-plane shear strengths. The finite
element analyses are repeated for both unidirectional and multidirectional laminates and the load that causes initiation of delamination and the load that causes first-ply intralaminar failure are found for each configuration. Delamination is found not to be the dominant failure mode for unidirectional laminates. However, there is a risk of delamination for angle-ply plates with fiber angles between 30and 45. According
to the maximum stress criterion stated in equation (14), intralaminar failure is less critical than delamination for all support locations for angle-ply laminates with 30
and 45 fiber orientation angles. On the other hand,
according to Tsai-Wu criterion, delamination can be avoided if the distance between the top supports and the nearest bottom support (ain Figure 2) is less than or equal to 20 mm. The risk of delamination becomes smaller as the distance between the upper and lower supports is reduced. The magnitude of bending moment depends not only on the force (Fin Figure 2) but also on the distance between the top and bottom supports, a (Mmax¼FaÞ. If a very small distance is
chosen, very high loads need to be applied by the test machine. Hence, the top supports are placed such that the distance between them,b, is 56 mm and the distance between them and the nearest lower support, a, is 20 mm in the finite element model as well as in the experiments.
Experiments
Experimental study is conducted in two stages: manu-facturing of composite plates and four-point bending tests.
[image:6.595.74.258.624.707.2]by means of a diamond disk to prevent consistent error due to a potential manufacturing defect in a laminate. The prepreg’s thickness and the fiber volume fraction (FVF) were reported to be 0.184 mm and 57.42%29, respectively. Accordingly, 12-ply laminate would have 2.208 mm thickness. Thickness of each specimen is mea-sured; their thickness is found to be 2.204 mm on aver-age with a standard deviation of 0.018 mm. In the structural analyses, the reported value, 2.208 mm, is used.
The test setup, which is designed with the help of FE analyses, is manufactured from forged steel. The sup-ports are made of silver steel.
Quasi-static tests are carried out under a mono-tonic loading with a constant displacement rate of 1.0 mm/min. The deflections of the specimens are mea-sured from the downward movement of the upper sup-ports, namely from the crosshead displacement of the test machine. The stiffness of the machine and the fix-tures are not taken into account. Displacement of the upper supports, , and the applied force, 2F, are recorded.
For each 15of fiber orientation angle,, from 0to
90, five specimens are tested. Some of the chosen
fail-ure criteria predict a slight increase in strength as the fiber angle is varied from 0 to 3–5. For this reason,
[512]T and [53/53]s plates are additionally tested to
observe the correlation between the experimental results and the predictions.
Results and discussion
Material properties
Mechanical properties of AS4/8552 are taken from the catalogue provided by HexcelÕ.29
The stiffness of the material is slightly different under tension and compres-sion. Taking different elastic properties under tension and compression complicates calculations significantly. Four-point bending induces tensile stresses below the mid-plane and compressive stresses above. However, different mechanical moduli under tension and com-pression disturb the symmetry condition even if the laminate has a symmetric stacking sequence. In that case, the coupling terms (B matrix) do not disappear. Considering that the differences in the stiffness proper-ties under tension and compression is less than 5% in all cases, averaged values are used in this study. The properties missing in the catalogue like Poisson’s ratios are taken from Lopes et al.30 Tables 1 and 2 present the material properties used in the analytical and FE models. Because laminae are transversely isotropic, one may assume the following equalities to hold: Zt¼Yt, Zc¼Yc, S13¼S12, 13¼ 12, and
G23 ¼E2=2 1ð þ 23Þ.
Comparison between theoretical, FEM, and
experi-mental results
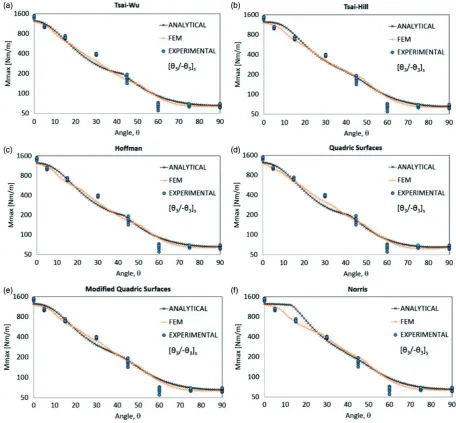
[12]TOff-axis laminates. In Figures 3–5, analytical and numerical predictions ofMmax obtained as a function
of the orientation angle, , using the chosen failure criteria for unidirectional specimens, [12]T, are
com-pared with the experimental results. Maximum allow-able bending moment, Mmax, is shown in logarithmic
scale of base 2 in order to better reveal how the predic-tions compare with the empirical results at quite differ-ent load levels. Table 3 presdiffer-ents the average values,, and the coefficients of variation, CoV (%), of experi-mentally determined maximum allowable moment resultants,Mmax. CoV is the ratio of standard deviation
to average. The table also gives the percentage of error in the predictions of the criteria obtained based on FEA. Because quadric surfaces and modified quadric surfaces give similar predictions, the results of modified quadric surfaces are omitted in the table. Figure 3 and Table 3 show that FEM-based predictions of Tsai-Wu, Tsai-Hill, Hoffman, quadric surfaces, modified quadric surfaces, and Norris criteria are very close to the experi-mental results. The average error is about 11–12%. Considering the experimental scatter (average CoV is 10%), the differences in the predicted failure levels are not significant. In general, the predictions of quadric surfaces are more conservative. As it is shown in the figures, 75-specimens have lower strength than 90
-specimens. All of these criteria predict the strength to be minimum for values ofless than 90, but only
Tsai-Wu and quadric surfaces predict lower strength for 75;
[image:7.595.310.545.83.133.2]the trend predicted by quadric surfaces reveals this feature noticeably as opposed to Tsai-Wu. Analytical predictions of Tsai-Wu, Tsai-Hill, and Hoffman are close to FEM results, but slightly non-conservative. On the other hand, quadric surfaces, modified quadric surfaces, and Norris criteria overestimate the failure loads based on analytically found stress states. Norris Table 1. Mechanical properties of AS4/8552.29,30
E1
(GPa)
E2
(GPa)
G12
(GPa)
12 23 1
(106/C) 2
(106/C)
[image:7.595.309.546.179.228.2]134.8 9.6 5.3 0.32 0.487 0.1265 37.12
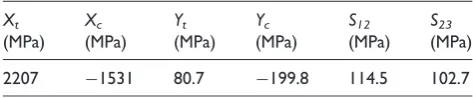
Table 2. Strength properties of AS4/8552.29,30
Xt
(MPa)
Xc
(MPa)
Yt
(MPa)
Yc
(MPa)
S12
(MPa)
S23
(MPa)
criterion predicts increasing strength as is changed from 0 to 9, which contradicts the empirically
deter-mined trend.
Figure 4 shows the predictions of maximum stress, maximum strain, and Hashin criteria. All of these cri-teria are physically based, i.e. they can predict the fail-ure mode of laminates. These criteria estimate a slight increase in strength in the first few degrees of the orien-tation angle, which is difficult to explain physically. Additionally, the failure trends of these criteria do not show a decrease in strength at 75-orientation
angle. As it is seen in the figures, these criteria overesti-mate the average strength of laminates with 5
orienta-tion. The FEM-based predictions of these criteria again correlate better with the experimental results as
compared to the analytical ones. The reason for this may be attributed to the boundary conditions of the analytical model, which do not exactly reflect the experimental conditions and partially to the use of 2D stress state instead of 3D stress state. The predictions of the criteria based on FE results are not exactly the same for specimens having 0 or 90˚ orientation angle; since
the FE model accounts for Poisson’s effect, a multiaxial stress state is obtained even for¼0 or 90.
Figure 5 gives the experimental results together with the predictions of all the failure criteria for unidirec-tional laminates, [12]T, based on the FE model.
[image:8.595.66.517.65.485.2]Quadric surfaces is slightly better in that its predictions are either consistent with the experimental results (the average error is 10.9%) or conservative.
In Figure 6, photographs of the bottom surfaces of the failed off-axis specimens, [12]T, can be seen. Fiber
direc-tions are shown by arrows. Schematics of various failure modes can be seen in Figure 7. The main failure mode is fiber breakage up to 15. Delaminations are observed to
occur, but after intralaminar failure. For specimens with
an angle of 30 and above, the main failure mode is
matrix cracking; the final catastrophic failure occurs due to matrix cracking. The fracture surfaces in the [4512]T,
[6012]Tand [9012]Tspecimens are parallel to the fiber
dir-ection. In some specimens, [012]T, [512]T, [1512]T, [3012]T,
[image:9.595.73.533.67.340.2]damage starts close to the upper supports, which may be Figure 4. Comparison between the analytical and finite elementMmaxpredictions obtained using (a) maximum stress, (b) maximum strain, and (c) Hashin criteria for off-axis [12]Tspecimens with the experimental results.
[image:9.595.135.472.400.612.2]due to stress concentration created by the supports. However, considering that the analytical structural ana-lysis does not take into account stress concentration and the predictions of the failure criteria based on the
analytical solution are satisfactory, the effect of stress con-centration can be assumed to be small. In some others, [6012]T, [7512]T, [9012]T, on the other hand, fracture
[image:10.595.49.534.96.256.2]sur-faces are away from the support locations. Figure 6. Photographs of the off-axis failed specimens, [12]T.
Table 3. For off-axis [12]Tlaminates, the average value,, and the coefficient of variation, CoV (%), of experimentally determined maximum allowable moments resultants,Mmax, and the percentage error in the predictions of the criteria based on FEA.
Mmax (Nm/m) Error (%) 100 xpredxexp=xexp
CoV (%) Tsai-Wu Tsai Hill Hoff-man Norris Quad Surf Max stress Max strain Hashin
0 1452 3.2 17.1 17.4 17.2 17.3 19.7 17.4 17.4 17.4
5 933 16.3 12.6 14.5 12.3 16.1 4.0 28.3 28.2 28.3
15 740 19.1 20.4 20.9 20.6 17.5 22.3 17.4 17.4 20.7
30 306 10.9 19.8 7.2 17.3 10.1 19.5 1.5 11.2 15.2
45 130 9.0 0.7 20.4 0.2 9.5 0.2 19.9 19.5 5.4
60 83 2.8 7.2 6.1 7.6 5.8 12.5 1.9 1.5 6.0
75 58 14.9 9.6 10.0 9.5 10.1 5.5 11.4 11.5 10.0
90 65 5.1 2.3 3.2 2.9 3.2 3.5 3.2 2.6 3.2
[image:10.595.135.446.287.638.2]Plots of the applied force on the upper supports, 2F, versus their displacements,, (see Figure 2 forFand) for off-axis specimens are given in Figure 8. These plots can be used to determine the first and final failure loads of the specimens. In the specimens with layup [012]T,
[3012]T, [6012]T, [7512]T, and [9012]T, sudden failure is
observed, while in the specimens with [512]T, and
[1512]T, zigzag deformation is seen. This zigzag
deform-ation shows the interaction of different failure modes and progressive failure behavior.
The predictions ofMmax based on analytical and FE
models are about the same for 90 laminates and
con-sistent with the experimental result as expected. However, the estimated failure load for¼0 is about
17% lower than the empirically determined level, which is 1452 Nm/m on average. This may be the result of the peculiar failure behavior of 0laminates under bending.
The maximum normal stress criterion predicts fiber breakage at the bottom of the plate, which is under ten-sion, whenxx¼Xt ¼2207 MPa atMxx¼1793 Nm/m,
but before that level is reached, it predicts fiber buckling
at the top of the plate, which is under compression, when
xx¼Xc¼ 1531 MPa at Mxx¼1244 Nm/m.
Therefore, the model estimates the first-ply-failure load as 1244 Nm/m. However, even if the top-most fibers would buckle in the tests and the stiffness of the plate would slightly decrease, this is barely noticeable from the macro-behavior of the laminate. Further increase in the load leads to further decrease in the stiffness due to more extensive micro-buckling. Only at higher load levels, this trend becomes noticeable. In most of the specimens, fracture occurs due to breaking of fibers at the bottom before significant loss occurs in stiffness as seen in the force – displacement curves for [012]T specimens shown
in Figure 8.
Figure 9 shows the distribution ofxxcomponent of
stress at the bottom of the specimen with layup config-uration [012]T. The load is just sufficient to cause
first-ply failure according to the maximum stress theory; the mode of failure is due to fiber buckling, which occurs at the top of the laminate, wherexx¼Xc¼ 1531 MPa.
[image:11.595.98.505.66.127.2]Although at the bottom, the maximum value ofxx is
Figure 8. Force–displacement graphs of tested off-axis specimens, [12]T.
[image:11.595.134.473.172.441.2]Figure 10. Comparison between the analytical and finite elementMmax predictions obtained using (a) Tsai-Wu, (b) Tsai-Hill, (c) Hoffman, (d) quadric surfaces (e) modified quadric surfaces and (f) Norris criteria for balanced and symmetric angle-ply [3/3]s specimens with the experimental results (excluding the effects of residual stresses).
equal to 1532 MPa in tension, at the top surface, the maximum compressive stress is1594 MPa because of stress concentration due to concentrated displacement boundary conditions at the region in contact with the upper support; for this reason, this region is not included in failure assessment.
Balanced and symmetric angle-ply laminates, [3/3]s. In Figures 10–13, analytical and finite elementMmax
pre-dictions obtained using the chosen failure criteria for balanced and symmetric angle-ply [3/3]s specimens
are compared with the experimental results. Table 4 presents the average values, , and the coefficients of variation, CoV (%), of experimentally determined max-imum allowable moment resultants, Mmax, for
angle-ply laminates. The table also gives the percentage of error in the predictions of the criteria based on FEA results excluding the effects of residual stresses.
In four-point bending of balanced angle-ply speci-mens, the loading is not pure bending. When the plate is bent, twisting curvature tends to develop due to bending–twisting coupling, but straight and rigid supports prevent development of twisting curvature in the contact region, and therefore the supports also cause twisting moment,Mxy. In a smaller extent, Myy
may also develop due to Poisson’s effect. Nevertheless,
predominant loading isMxx. For this reason, the level
ofMxxat the onset of damage is shown in the graphs as
the failure load.
Figures 10 and 11 present the predictions of the cri-teria excluding residual stresses. Predictions of Tsai-Wu, Tsai-Hill, Hoffman, quadric surfaces, modified quadric surfaces, and Norris criteria are very close to each other as shown in Figure 10. Norris is more on the non-con-servative side, while quadric surfaces are on the conser-vative side. The predictions correlate well with the experimental results except for¼60. They all
overesti-mate the strength of [603/603]s laminate. The average
error is in the range of 11–13%; quadratic surfaces have the lowest error with 11.3%. Besides, they all fail to estimate the failure trend that the minimum strength occurs at about 60. The predicted failure trend is a
con-tinuously decreasing strength from 0 to 90. As in the
unidirectional laminates, maximum stress, maximum strain, and Hashin criteria predict increasing strength up to 3as shown in Figure 11; otherwise, the predicted
[image:13.595.74.533.408.685.2]trend is similar to the others; the average error is about 13–16%, which is slightly worse than the others. Finite element and analytical model-based predictions of Tsai-Wu, Tsai-Hill, Hoffman, quadric surfaces, and modified quadric surfaces are close to each other; the others show some discrepancies.
Figure 13. Mmax predictions for [3/3]sconfiguration based on the finite element model including residual stresses.
Table 4. For symmetric angle-ply [þ3/3]slaminates, the average value,, and the coefficient of variation, CoV (%), of experi-mentally determined maximum allowable moment resultants,Mmax, and the percentage error in the predictions of the criteria based on FEA excluding the effects of residual stresses.
Mmax (Nm/m) Error (%) 100 xpredxexp=xexp
CoV (%) Tsai-Wu Tsai Hill Hoff-man Norris Quad Surf Max Stress Max Strain Hashin
0 1452 3.2 17.1 17.4 17.2 17.4 19.7 17.4 17.4 17.4
5 1018 2.5 5.7 7.9 5.8 8.9 1.5 17.4 17.3 17.4
15 704 4.3 12.6 5.9 11.5 5.4 9.0 4.5 4.5 5.5
30 390 2.4 20.2 15.9 20.2 1.0 19.3 3.2 1.4 16.1
45 166 10.5 4.2 13.3 2.8 18.5 2.3 20.4 34.2 2.7
60 64 9.4 37.0 40.7 37.2 41.1 28.2 49.4 48.8 40.7
75 66 3.5 1.6 1.2 1.6 1.0 6.6 0.4 0.4 1.1
90 65 5.1 2.3 3.3 2.9 3.2 3.6 3.3 2.6 3.2
[image:14.595.120.462.272.459.2]Average error (%) 12.6 13.2 12.4 12.1 11.3 14.5 15.8 13.0
[image:14.595.52.534.566.724.2]A comparison of FEM-based predictions of Mmax
obtained using Tsai-Wu and Hashin criteria including and excluding the residual stresses can be seen in Figure 12. Residual stresses do not develop in unidir-ectional laminates with¼0and¼90. Accordingly,
no difference exists in the predicted failure loads for these laminates. The largest residual stress in the trans-verse direction is predicted to occur at ¼45 with a
magnitude of about 50 MPa. Considering that the transverse strength of the material is 81 MPa,
significant portion of the strength is degraded due to the residual stresses. If the structural analysis is carried out accounting for the residual stresses, the failure cri-teria significantly underestimate the failure loads for
¼30 and ¼45; they slightly underestimate for ¼15, ¼60, and¼75. Underestimation may be
[image:15.595.148.461.218.699.2]attributed to the viscoelastic properties of polymer-based composites. Residual stresses developed during curing partially relax in time. Mite and Kim31indicated 20% stress relaxation for AS4/3501-6. Because the
structural model does not account for viscoelastic effects, it is not surprising that the criteria overestimate the effect of residual stresses and underestimate the strength. Because of underestimation, accuracy of the predictions becomes worse; average errors in the pre-dictions rise to levels of 18–22%. On the other hand, it is noteworthy that if the residual stresses are included in the structural model, the predicted failure trends better correlate with the experimental results, i.e. tendencies of change in strength with the change in are similar. For example, the laminate strength is predicted to take its minimum value for angles about 60 as revealed by
the experiments; after that, the strength increases up to
¼90. On the other hand, if the residual stresses are
not taken into account, continuous decrease in strength is predicted with increasing.
The predictions obtained by all the selected criteria considering the residual stress are given in Figure 13. For values oflarger than 50, the differences between
the predictions are insignificant (less than 3%). Below 50, the differences are small considering the
experi-mental scatter. Maximum stress, maximum strain, and Hashin again predict higher strength for the first few degrees of compared to 0.
Photographs of the bottom surfaces of failed sym-metric angle-ply specimens, [3/3]s, can be seen in
Figure 14. Delamination and matrix cracking take
place in all specimens. Fiber breakage occurs only in the specimens with layup configurations [53/53]s and
[153/153]s and damage starts close to the upper
sup-ports, because these create stress concentration. For fiber angles larger than 15, the main failure mode
changes to intralaminar failure. Delaminations are observed to occur at a stage later than intralaminar failure. For larger angles, damage initiates away from the support locations.
Force–displacement plots of [3/3]sangle-ply
spe-cimens are given in Figure 15. Zigzag deformation behavior is observed as in the off-axis specimens of [1512]T(Figure 8). The main source of scatter observed
in the experiments can be presumed to be manufactur-ing defects. The average of CoV (coefficient of variation) values given in Tables 3 and 4 is 10.2% for off-axis specimens and 5.1% for angle-ply specimens. Another source of scatter might be hand lay-up method. It can be seen in Figures 5 and 13 that there are less scatter in the samples of [012]Tand [9012]T. This
[image:16.595.123.459.432.707.2]may partially be due to smaller error in the placement of the plies along the chosen orientation, considering that it is much easier to achieve the chosen stacking directions for these layups. Another source of scatter in strength is the differences in specimen thickness. The thickness varies from 2.17 mm to 2.24 mm with an average of 2.204 mm.
Comparison of predictions based on linear and
nonlinear finite element models
Although the material response can be considered to be linear as the force–displacement graphs show, assump-tion of geometric linearity is quesassump-tionable considering that deflections are observed to be much larger than the thickness of the specimens (2.21 mm) during the four-point bending tests as Figure 15 indicates. The above presented predictions are obtained based on the linear finite element model, which determines the response of the specimens by taking the fibers at their initial pos-itions. In order to estimate the effects of geometric non-linearity, a nonlinear finite element model is developed that accounts for large rotations and deflections. As shown in Figure 16, the predicted failure loads based on the quadric surfaces are similar except for¼30.
For this configuration, the nonlinear model estimates the failure load to be 20% higher than the linear model and much closer to the experimental result. The average error also reduces from 11.3% to 8.7%.
Predicted failure trends for in-plane loads
The success of a failure criterion in predicting the fail-ure behavior of a composite laminate for just one type of loading does not justify its use in design for an arbitrary loading. In the present study, analytical solutions are obtained for off-axis ([12]T) and
angle-ply ([3/3]s) laminates under in-plane uniaxial
load-ing and the predicted failure trends are compared with the experimental results reported in the literature. For off-axis ([12]T) laminates subjected to a uniaxial
in-plane load (only Nxx6¼0), all of these failure criteria
predict the maximum strength for ¼0, except
maximum stress and maximum strain criteria, which predict first an increase in strength with increasing , then a decrease; this does not agree with the empirical data reported in the literature.24If an angle-ply lamin-ate ([3/3]s) is subjected to a uniaxial in-plane load,
all the criteria except Hoffman predict decreasing strength with increasing . Hoffman, on the other hand, predicts increasing strength until ¼6. For
materials having tensile strength in the fiber direction lower than the compressive strength like T300/5308,7 Tsai-Wu predicts the maximum strength for ¼10,
which is about 8% higher than the strength of [012]T.
This does not comply with the experimental results.32 Hoffman gives even worse predictions; it estimates the strength of [123/123]slaminate 25% higher than [012]T
laminate. Among the criteria considered in this study, quadric surfaces criterion is better in correctly predict-ing the failure trends for the chosen configurations [12]Tand [þ3/3]sand loading conditions.
Conclusions
In this study, the failure behavior of [12]T off-axis
laminate and symmetric angle-ply [3/3]s laminates
under four-point bending is investigated. A four-point bending test setup is designed and constructed such that intralaminar failure modes are more critical than delamination. Experiments are conducted for [12]T
and [3/3]s layup sequences for fiber angles of 0,
5, 15, 30, 45, 60, 75, and 90. Both CLT and
FEM are utilized to simulate the four-point bending tests. Maximum allowable moment resultant, Mmax,
[image:17.595.144.463.68.262.2]predictions of nine different failure criteria are com-pared with the experimental results.
For unidirectional laminates, [12]T, finite element
model based predictions of Tsai-Wu, Tsai-Hill, Hoffman, quadric surfaces, modified quadric surfaces, and Norris criteria are very close to the experimental results with an average error of 11–12%. Maximum stress, maximum strain, and Hashin criteria predict a slight increase in strength in the first few degrees of the orientation angle, which is in conflict with the experi-mental findings. The strength of [7512]T laminates is
found to be lower than that of [9012]T laminates. Only
Tsai-Wu and quadric surfaces succeed in correctly pre-dicting this failure trend.
As for angle-ply [3/3]s laminates, if the residual
stresses are not included in the structural analysis, pre-dictions of Tsai-Wu, Tsai-Hill, Hoffman, quadric sur-faces, modified quadric sursur-faces, and Norris criteria correlate well with the experimental results except that they overestimate the strength of [603/603]s
laminate. Besides, they all fail to predict the failure trend that the minimum strength occurs at about 60.
If the residual stresses are included, the criteria under-estimate the failure loads.
The FEM-based predictions of the chosen failure criteria correlate better with the experimental results as compared to the analytical ones. The reason for this may be the better representation of the boundary conditions in the FE model and partially the use of 3D solid elements.
Correlation of the predicted failure trends with the experimental results is also examined for plates having the same configurations, [12]T and [3/3]s, subjected
to uniaxial in-plane loads by comparing the predictions with previously reported experimental results. If the tensile strength of the material in the fiber direction is lower than its compressive strength, Tsai-Wu and Hoffman criteria predict an increase in strength under uniaxial in-plane loads as the fiber angle is varied from 0 to 10–12, which is in conflict with the empirical
results. Overall, quadric surfaces is better in predicting the failure trends for the chosen configurations [12]T
and [þ3/3]sunder uniaxial in-plane and out-of plane
loading conditions.
Declaration of Conflicting Interests
The author(s) declared no potential conflicts of interest with respect to the research, authorship, and/or publication of this article.
Funding
The author(s) disclosed receipt of the following financial sup-port for the research, authorship, and/or publication of this article: This paper is based on the work supported by the Scientific Research Projects of Bogazici University with the code number 7960-13A06P5.
References
1. Tsai SW and Wu EM. A general theory of strength for anisotropic materials.J Compos Mater1971; 5: 58–80. 2. Hoffman O. The brittle strength of orthotropic materials.
J Compos Mater1967; 1: 200–206.
3. Yeh H-L. Quadric surfaces criterion for composite mater-ials.J Reinf Plast Compos2003; 22: 517–532.
4. Yeh H-L and Yeh H-Y. The modified quadric surfaces criterion for composite materials. J Reinf Plast Compos
2002; 21: 277–289.
5. Norris CB.Strength of orthotropic materials subjected to combined stress. Forest Products Laboratory, Report no 1816, 1962.
6. Hashin Z. Failure criteria for unidirectional fiber com-posites.J Appl Mech1980; 47: 329–334.
7. Akbulut M and Sonmez FO. Design optimization of laminated composites using a new variant of simulated annealing.Comput Struct2011; 89: 1712–1724.
8. Sandhu RS. A survey of failure theories of isotropic and anisotropic materials. Technical Report, OH: Air Force Flight Dynamics Laboratory Wright-Patterson AFB, 1972.
9. Paris F. A study of failure criteria of fibrous composite materials. Report NASA, CR-2001-210661, 2001. 10. Davila CG, Camanho PP and Rose CA. Failure criteria
for FRP laminates.J Compos Mater2005; 39: 323–345. 11. Soni SR. A Comparative study of failure envelopes in
composite laminates. J Reinf Plast Compos 1983; 2: 34–42.
12. Hinton MJ, Kaddour AS and Soden PD.Failure criteria in fibre reinforced polymer composites: The World-wide failure exercise. Oxford: Elsevier, 2004.
13. Kaddour AS, Hinton MJ, Smith PA, et al. A comparison between the predictive capability of matrix cracking, damage and failure criteria for fibre reinforced composite laminates: Part A of the third world-wide failure exercise.
J Compos Mater2013; 47: 2749–2779.
14. Kaddour AS and Hinton MJ. Maturity of 3D failure criteria for fibre-reinforced composites: Comparison between theories and experiments: Part B of WWFE-II.
J Compos Mater2013; 47: 925–966.
15. Kaddour AS and Hinton MJ. Benchmarking of triaxial failure criteria for composite laminates: Comparison between models of ’Part (A)’ of ’WWFE-II’. J Compos Mater2012; 46: 2595–2634.
16. Greif R and Chapon E. Investigation of successive failure modes in graphite/epoxy laminated composite beams.
J Reinf Plast Compos1993; 12: 602–621.
17. Trochu F, Echaabi J, Pham XT, et al. Theoretical and experimental investigation of failure and damage progres-sion of graphite-epoxy composites in flexural bending test.J Reinf Plast Compos1996; 15: 740–755.
18. Icardi U, Locatto S and Longo A. Assessment of recent theories for predicting failure of composite laminates.
Appl Mech Rev2007; 60: 76–86.
20. El Irhirane, Echaabi H, Aboussaleh JM, et al. Matrix and fibre stiffness degradation of a quasi-isotrope graphite epoxy laminate under flexural bending test. J Reinf Plast Compos2009; 28: 201–223.
21. Irhirane EH, Abousaleh M, Echaabi J, et al. Modeling and simulation of the failure and stiffness degradation of a graphite epoxy in a three point bending test. J Eng Mater-T ASME2010; 132: 0310131–0310138.
22. Huang Z-M. Modeling and characterization of bending strength of braided fabric reinforced laminates.J Compos Mater2002; 36: 2537–2566.
23. Varma IK and Gupta VB. Thermosetting
Resin-Properties. In: Kelly A and Zweben C (eds)
Comprehensive composite materials. Oxford, UK: Elsevier, 2000, pp.1–56.
24. Jones RM. Mechanics of composite materials. 2nd ed. Philadelphia: Taylor & Francis, 1999.
25. Hyer MW. Stress analysis of fiber reinforced composite materials. Virginia: McGraw Hill, 1998.
26. Davila CG and Camanho PP. Failure criteria for FRP laminates in plane stress. Report NASA, TM-2003-212663, 2003.
27. ANSYS Help System, Version 14.5.0, 2014.
28. Tserpes KI, Papanikos P and Kermanidis TH. A three dimensional progressive damage model for bolted joints in composite laminates subjected to tensile loading.
Fatigue Fract. Eng. Mater. Struct2001; 24: 663–675. 29. Hexcel Composites, HexPly 8552 Epoxy Matrix, 2008,
http://www.hexcel.com/Resources/DataSheets/Prepreg-Data-Sheets/8552_eu.pdf (accessed February 2015). 30. Lopes CS, Seresta O, Coquet Y, et al. Low-velocity
impact damage on dispersed stacking sequence laminates. Part I: Experiments. Compos Sci Technol 2009; 69: 926–936.
31. Mite SR and Kim YK. Process-induced residual stress analysis of AS4/3501-6 composite material. Mech Compos Mater Struct1998; 5: 153–186.
![Figure 3. Comparison between the analytical and finite element Mmax predictions obtained using (a) Tsai-Wu, (b) Tsai-Hill,(c) Hoffman, (d) the quadric surfaces (e) the modified quadric surfaces, and (f) Norris criteria for off-axis [�12]T specimens withthe experimental results.](https://thumb-us.123doks.com/thumbv2/123dok_us/609733.561245/8.595.66.517.65.485/comparison-analytical-predictions-hoffman-modified-surfaces-specimens-experimental.webp)
![Figure 4. Comparison between the analytical and finite elementstrain, and (c) Hashin criteria for off-axis [ Mmax predictions obtained using (a) maximum stress, (b) maximum�12]T specimens with the experimental results.](https://thumb-us.123doks.com/thumbv2/123dok_us/609733.561245/9.595.135.472.400.612/comparison-analytical-elementstrain-criteria-predictions-obtained-specimens-experimental.webp)
![Figure 6. Photographs of the off-axis failed specimens, [�12]T.](https://thumb-us.123doks.com/thumbv2/123dok_us/609733.561245/10.595.135.446.287.638/figure-photographs-axis-failed-specimens-t.webp)
![Figure 8. Force–displacement graphs of tested off-axis specimens, [�12]T.](https://thumb-us.123doks.com/thumbv2/123dok_us/609733.561245/11.595.134.473.172.441/figure-force-displacement-graphs-tested-axis-specimens-t.webp)
![Figure 11. Comparison between the analytical and finite element Mmax predictions obtained using (a) Maximum stress, (b) Maximumstrain, (c) Hashin criteria for balanced and symmetric angle-ply [�3/��3]s specimens with the experimental results (excluding the effectof residual stresses).](https://thumb-us.123doks.com/thumbv2/123dok_us/609733.561245/13.595.74.533.408.685/comparison-analytical-predictions-maximumstrain-symmetric-specimens-experimental-excluding.webp)
![Figure 12. Comparison between the effect of residual stresses on the finite element model based(a) Tsai-Wu and (b) Hashin for balanced and symmetric angle-ply [ Mmax predictions obtained using�3/��3]s specimens with the experimental results.](https://thumb-us.123doks.com/thumbv2/123dok_us/609733.561245/14.595.52.534.566.724/comparison-residual-stresses-balanced-symmetric-predictions-specimens-experimental.webp)