University of the West of England, Bristol
Productivity in Wales: the impacts of
peripherality on spatial patterns of productivity
Final Report to the Economic Research Advisory Panel
Welsh Assembly Government
PRODUCTIVITY IN WALES: THE IMPACTS OF PERIPHERALITY ON SPATIAL PATTERNS OF PRODUCTIVITY
EXECUTIVE SUMMARY
The study
1. It is well established that there is a significant gap between productivity in Wales compared with the UK average. There are also major differences in productivity across Wales. Previous work for the Welsh Assembly Government identified remoteness or peripherality as a key determinant of differences in productivity and competitiveness once factors such as capital stock, industrial structure, skills and other factors had been taken into account. This report presents findings from a further study commissioned by the Welsh Assembly Government from the University of West of England, Bristol, designed to investigate in more detail the nature peripherality and its impact on spatial differences in productivity.1
2. The aims of the study were:
To examine in detail, spatial variation in productivity across Wales and the determinants of this variation in order to establish the possible impacts of peripherality on productivity and economic performance.
To develop a range of different indices of peripherality in order to explore the impacts of peripherality.
To provide outputs in the form of maps of peripherality across Wales based on different indices.
To derive from the analysis spatial patterns of residuals from the econometric model – identifying parts of areas where levels of productivity diverge in particular from those predicted by the model.
To discuss the possible implications of spatial patterns of productivity and the impacts of peripherality in particular, policy implications.2
Peripherality
3. Peripherality matters because it captures a broad range of potential effects. One early study stressed that peripherality represents:
… a broad surrogate indicator of possible markets for traded goods and services, of input sources and opportunities for component linkages, of the availability of
commercial information and business services … distance costs of all kinds … rather than narrowly or simply … transport costs of the type implied by traditional
Weberian industrial location theory… (Keeble et al, 1988, 12).
4. Peripherality potentially impacts on access to markets, suppliers, people and skills, and information. It also however impacts on access to agglomeration economies
1
The study was carried out by Don Webber, Anthony Plumridge, Michael Horswell and Martin Boddy.
2
(returns to scale, specialist suppliers and services, larger pools of skills, supportive institutions and networks. And it impacts on access to knowledge spillovers, innovative milieu and non-market forms of collaboration fostered by face to face contact.
5. The study constructed indices of accessibility based on travel time by road to local towns and cities, and of peripherality based on distance, via the road network from any one local authority area to all others in England and Wales, weighted by the mass or size of each place measured in terms of population. It also combined the two in different ways.
6. These proved more effective in terms of explaining productivity differentials than the somewhat crude measures employed in earlier studies. In practice, the ‘index of accessibility’ based on travel time to towns and cities proved to be somewhat better at explaining such differences than the alternatives – suggesting that it is more localised differences that matter rather than economic potential at a much broader geographical scale.
7. This would also suggest that with the exception of Cardiff and the eastern end of the M4 corridor, Wales as a whole is peripheral compared with England such that the more broadly defined index of peripherality is less effective at picking up differences between places, particularly those further away from the economic centre of gravity of England and Wales.
8. Figure one shows the pattern of local accessibility across England and Wales, one of a range of measures generated by the study. This can be compared with Figure two which shows the pattern of productivity differentials which, is readily
apparent, shows a considerable degree of similarity with the map of local accessibility. The analysis set out to determine the importance of peripherality and accessibility once other relevant factors such as industry mix and numbers of workers had been taken into account.
9. The statistical analysis, reported in detail in the main report, clearly demonstrates the importance of accessibility and peripherality as having a significant impact on productivity, once other factors have been taken into account. This is the case in terms of spatial differences in productivity across Wales and England as a whole. It is also the case at a more detailed level within Wales.
10. Analysis of productivity differentials within Wales points to the sharp differences between South East Wales (and the M4 Corridor in particular) on the one hand, and the West Wales in particular. The same is true comparing North East Wales and adjacent areas of England with Central and North West Wales. These would seem to reflect to a significant extent the sharp differences in accessibility
Figure 1: Standardised local accessibility
Policy implications
11. The analysis raises a wide range of possible issues from a policy perspective with a view to offsetting at least to some extent the impacts of peripherality.
Improving transport infrastructure
12. The benefit to more peripheral regions of physical transport infrastructure
investment, such as improved rail or road links is at one level an obvious response to issues of accessibility and peripherality. The benefits are not always, however, as self-evident as they may seem. Investment frequently improves links to and reinforces the relative advantage of existing urban areas.
13. In the case of Wales, for example, the benefits of the old and second Severn crossings in terms of the development of the Welsh M4 Corridor up to and including Cardiff would seem to be clear. We do not have specific evidence but the benefits of extending the M4 further west may have to a significant extent accrued to Cardiff and south east Wales as well as to places further to the west. There are however, few examples of successful economic development in places that lack good transport infrastructure and whilst it may not be a sufficient condition for economic competitiveness, it can be argued that it is necessary.
Sector differentiation
14. Different types of economic activity will be impacted on by poor accessibility and peripherality in different ways. It may be possible to identify sectors or sub-sectors, or types of activity differentiated in some alternative way, at to promote and support the development of these in more remote areas.
15. Accessibility, proximity to larger agglomerations of economic activity and locations with high levels of economic potential confer considerable benefits in terms of competitiveness and productivity. Turning this on its head, support for and promotion of types of economic activities where the factors underlying these benefits are less relevant may present opportunities. One would be seeking to identify activities where, for example, physical access to concentrations of high market demand, proximity to specialist suppliers and business services and localised interaction with other businesses were largely irrelevant.
Focus on more peripheral areas with the greatest potential
16. It also needs to be recognised that rural areas with possible comparable levels of peripherality as measured by indices, vary greatly in terms of their attractiveness to more highly skilled and qualified ‘knowledge workers’ and entrepreneurs – this can be seen from the distribution across rural areas of the proportion of the
working-age population qualified to degree level or above. This suggests the possible benefits of targeting investment and policy intervention on areas with a high concentration of such populations.
Aggregation of supply chains or market potential
18. There are examples, however, of rural, quality food producers, which have been able to combine forces and to successfully market under a joint brand name a range and volume of goods that can be supplied to major retailers and supermarket chains
Capitalising on intrinsic value
19. It may also be possible to promote and support activities which derive value and market potential specifically from the (more remote) locations and the attributes of these products or services that derive intrinsic value from their location that can offset what are otherwise the disadvantages of poor accessibility and peripherality. The branding and supply of local products in the food and drink sector is a well-tried example. Local accommodation and visitor attraction is another obvious and well-tried example
Promoting virtual accessibility and agglomeration
20. Physical remoteness and geographical dispersal have typically been seen as the key elements of poor accessibility and peripherality. It may, however, be possible to develop initiatives that counter this by electronic means. This would include the promotion of and support for e-marketing and e-sales and support, including services as well as physical goods.
21. Clustering in physical space has been much emphasised in recent studies emphasising the role of face to face contact and easy access in promoting trust, collaboration, knowledge exchange, and knowledge generation. It may be possible, however, to replicate some at least of this in a variety of forms through the promotion of clustering, ‘business networking’ (emulating the growth of social networking sites) and density of contacts in virtual or electronic space.
Exploiting economic mass
22. Cardiff is the one sub-region in Wales with above average levels of productivity in the overall context of England and Wales. Significantly it is the only part of Wales that enjoys levels of accessibility or ‘centrality’ comparable to the main urban areas of England and Wales. There are clearly issues of spatial equity but this provides a potentially strong argument for concentrating investment where it is likely to generate the highest returns in terms of productivity. Similar
arguments might apply to Newport and Swansea which also benefit from the M4 corridor effect but represent smaller and in Swansea’s case more remote clusters than Cardiff itself, and also to Flintshire and Wrexham in the North East.
National infrastructure projects
23. Levels of accessibility and productivity in Cardiff are comparable with those in other significant urban centres across England. The Second Severn Crossing in particular has clearly done much to improve accessibility and counter
1. INTRODUCTION
1.1. It is well established that there is a significant gap between productivity in Wales compared with the UK average. There are also major differences in productivity across Wales, from Cardiff where labour productivity is well above the UK average to areas such as South West Wales and the Gwent Valleys where it is well below.
1.2. Previous work for the Welsh Assembly Government identified remoteness or peripherality as a key determinant of differences in productivity and
competitiveness once factors such as capital stock, industrial structure, skills and other factors had been taken into account. This report presents findings from a further study commissioned by the Welsh Assembly Government from the University of West of England, Bristol, designed to investigate in more detail the nature peripherality and its impact on spatial differences in productivity.3
1.3. Previous work set out to establish:
Key issues in relation to regional productivity differentials, their measurement and economic significance and implications
The extent of productivity differentials between Wales and other regions of the UK and between different parts of Wales
The key determinants of these productivity differentials including an indication of their relative importance
The possible implications of these findings in terms of policy issues and different forms of intervention
1.4. The previous study identified a headline gap in productivity between Wales as a whole and London as the leading, bench-mark region in Great Britain of some 42%.4 The study was able to explain, in statistical terms, much of the labour productivity gap between Wales and London based on a set of explanatory factors including differences in capital stock, industrial structure, ownership, qualifications, population density and an index of travel time to major centres of population and employment.
1.5. The importance of population density and travel time pointed to the importance of remoteness or peripherality as factors impacting on the productivity and competitiveness of businesses within Wales. Population density measured density in the district surrounding each individual business. The travel time index measured the average travel time from the district in which each plant was located to London and to the next four largest urban areas in Great Britain. The study found that the productivity of the average firm fell by 0.7% for every 10% increase in travel time. It also found that a doubling of population density was reflected in a 1.3% increase in productivity. Spatial factors, population density and travel time, were therefore clearly significant factors in explaining
the overall gap in productivity and competitiveness between Wales and more economically buoyant regions.
1.6. Using plant-level data from the Office of National Statistics the previous study was also able to analysis spatial differences productivity within Wales.
Focusing on ten sub-regions it was able to identify differences relative to Cardiff as the leading, bench-mark sub-region (Table 1.1).
1.7. Again, as with analysis at a regional scale, it was possible largely to explain differences in productivity at a sub-regional scale in terms of a set of
plausible explanatory factors. Population density was included as one factor in the sub-regional analysis and, along with other variables contributed to the overall explanation of differences in productivity. It was not possible
however, to include any meaningful index of peripherality as such in the sub-regional analysis. There remained, as well, significant anomalies – differences in productivity between sub-regions – which the analysis was unable to account for.
1.8. Other issues limited the extent to which the earlier study could identify issues relating to peripherality. First, the travel-time index used in the earlier study was relatively crude based as it was on travel time only to London and the next four largest conurbations in Great Britain – it represented in effect an exploratory element in the overall context of the original analysis albeit one which turned out in practice to point to important factors in explaining productivity differences. Second, within the limits of the data, the earlier study was able to provide some insights at a regional scale. The sub-regions remained, however, relatively broadly defined and whilst population density was included, the index of travel time was too crude to be
meaningful at a sub-regional scale.
1.9. Based on this earlier study however, and given the scale of differences in productivity and competitiveness across Wales as a whole and the apparent contribution to these differences of peripherality and remoteness, further
Table 1.1: Sub-regional productivity differentials in Wales relative to Cardiff, 2003
Conwy and Denbighshire 33%
Swansea 30%
South West Wales 26%
Gwynedd and Anglesey 21%
Central Valleys 15%
Gwent Valleys 13%
Powys 8%
Monmouthshire and Newport 8%
Bridgend and Neath 7%
work was commissioned to look at this aspect of the analysis in more detail. The aims of the study, presented here, were:
To examine in detail, spatial variation in productivity across Wales at a range of different geographical scales and the determinants of this variation in order to establish the possible impacts of peripherality on productivity and economic performance.
To develop a range of different indices of peripherality based on travel time to centres of population and employment and the size of those settlements, applying different weights and functions in order to explore the impacts of peripherality in the context of other factors affecting productivity levels. To develop indices of peripherality in the form of a GIS data-base allowing
them to be linked to individual plants in the ONS business-level database across Wales.
To provide outputs in the form of maps of peripherality across Wales based on different indices.
To apply these indices in the context of econometric analysis of the determinants of productivity, based on the most recently available ONS business-level data.
To derive from the analysis spatial patterns of residuals from the
econometric model – identifying parts of areas where levels of productivity diverge in particular from those predicted by the model.
To discuss the possible implications of spatial patterns of productivity and the impacts of peripherality in particular, including policy implications. 1.10. The study was largely able to meet in full the objectives as set out here. The
original brief was to focus on Wales itself and initial work on indices of peripherality focused on this study area. Following discussion, however, it was agreed to extend the scope of the study to cover England and Wales as a whole. The level of detail relating to Wales remained as it would have been. The extended study area provided, however, a much broader context within which to look at peripherality, differences in productivity and the factors impacting on these differences across Wales. It also allowed for comparison between Wales and other more geographical peripheral parts of England. 1.11. The original aims of the study included examining variation in productivity
at different spatial scales. At project inception it was not possible to determine the spatial scales at which it would be possible to conduct the analysis and disclose results – this being dependent on ONS requirements regarding confidentiality of the original plant-level data, with release of results being dependent on ONS authorisation. In practice it proved possible to carry out the analysis and present results in map-form at the level of unitary authorities across England and Wales, merging small authorities in very few cases to meet ONS requirements. This was considerably more detailed than was possible in the previous study looking at sub-regions. Given the level of detail that this provided it was not considered necessary to focus on different spatial scales.
1.12. These differences apart, the study covered the sequence of aims outlined above. Section two, which follows, considers the nature of peripherality and accessibility and its possible impacts on productivity and economic
indices of peripherality. Section four presents the main statistical analysis carried out to establish the impact of peripherality on productivity
differentials, in the context of other relevant variables. It concludes with an analysis of the spatial pattern of the ‘residuals’ or ‘unexplained variation’ which cannot be accounted for by the statistical models. Section five presents a further dimension to the analysis in the form of a ‘spatial regression model’. This builds into the model itself the spatial structure which is evident in both the data on productivity and in the explanatory variables. This provides what is statistically a more robust model which fully captures the spatial relationships within the data. Section six presents a short exploration of the possible impact of aspatial or ‘virtual’ peripherality reflecting poor connectivity to ICT, business networks or sources of social capital. The final section then draws out key findings and explores policy implications.5
5
2. PERIPHERALITY AND PRODUCTIVITY
2.1. Before setting out to develop statistical measures of peripherality, it is useful to unpack the concept and to consider its possible impacts and implications in terms of economic performance. Peripherality6can be conceptualised and defined at various spatial levels and it is important to consider the set of other places to which any given place might be considered to be ‘peripheral’. Thus there is work at an international scale that focuses, for example on the
peripherality of a nation such as New Zealand (McCann 2003) where the ‘other’ areas are global. Other work is focused at a supra-national level, as with the European Peripherality Index (Schurmann and Talaat (2002)) described earlier in section two. Here the spatial units are defined as NUTS3 areas of the EU and candidate countries and the ‘other’ areas against which the peripherality of any given spatial unit are defined are all other NUTS 3 areas within the study area. The present study aimed to look at spatial differences in productivity and competitiveness at a relatively fine-grained level – the aim therefore was to incorporate measured of peripherality appropriate to this level of resolution – as described in section 3, below.
2.2. One early study stressed that peripherality represents:
… a broad surrogate indicator of possible markets for traded goods and services, of input sources and opportunities for component linkages, of the availability of commercial information and business services … distance costs of all kinds … rather than narrowly or simply … transport costs of the type implied by traditional Weberian industrial location theory… (Keeble et al, 1988, 12).
It is important to understand these differences and complexities in order to start to think about policy implications or broader strategic issues. The impacts and implications of peripherality are thus multi-dimensional and we can start to unpack these in the following way.
Access to markets or market potential
2.3. In terms of outputs, access to markets impacts on the costs and feasibility of getting goods and services to customers. Access does not simply impact through distance-costs but also includes for example the costs of
communication, information gathering, levels of stockholding required, risk and uncertainty. It can also impact on the scope of market intelligence and other information flows, as well as non-financial factors such as trust and collaboration which can enhance competitiveness and which are enhanced by the possibilities for and frequency of face to face contact.
Access to suppliers of goods and services
2.4. Similar factors apply in terms of access to inputs including both goods and services. Again these include actual costs but also factors such as intelligence and information flows and non-market relationships such as trust and
6 Peripherality is used in a general sense as defined by Goodhall, 1987, “the condition experienced by
collaboration which are enhanced by spatial proximity. These same factors apply specifically to supply chains where cost, information flows, certainty of supply and the need for (costs of) buffer stocks at different pointed in the supply chain are key considerations. Accessibility and peripherality clearly impact across these factors.
Goods, people, information and services
2.5. Accessibility and peripherality have different impacts and implications depending on whether one is talking about the flow of material goods of different sorts (weight, bulk, value perishability), of services of different types (which may involve flows of information in different formats or face-to-face contact) or specifically of individuals. It has been argued that as the nature of economic activity has shifted towards knowledge-driven, higher value, R&D dependent goods and towards more service-based activities, traditional transport costs as such have become less significant and contact between people have become increasingly important. Freight service quality, reliability and speed remain important to those activities where they are still relevant. The scale and scope of activities to which they are relevant is however now much reduced and direct transport costs represent a low proportion of total production costs across much of industry.
Agglomeration
2.6. Recent perspectives point to the importance of a range of factors which relate spatial differences in productivity and growth to increasing returns arising out of spatial agglomeration. The Treasury has argued that:
…agglomerations, or clusters, of firms and skilled workers may be one of the key drivers of economic growth in localities, cities and regions. Successful clusters may be crucial to a region’s success in attracting and retaining high productivity firms and workers. Agglomeration, whilst beneficial in itself, could therefore be a force for divergence as successful clusters attract increasing amounts of firms and workers. (HM Treasury, 2001, 34)
This may reflect increasing returns generated by localized knowledge spillovers, access to specialized suppliers and services, the scale of local markets and access to large and diverse pools of labour offering specialist skills. Larger scale agglomerations or access to ‘economic mass’ can simply represent larger scale markets for goods and services which can generate economies of scale for producers.
Clusters and innovation
2.7. According to some accounts, these are reinforced by locally-embedded
institutional, socio-cultural and political structures and practices which tend to localize such external economies. These include relationships of trust and collaboration mentioned earlier, more easily developed and maintained in geographical concentrated, higher density networks. These can also take the form of a ‘local innovative milieux’ ‘regional innovation systems’. There are parallels here, as well, with Porter’s more eclectic ‘cluster model’ of regional competitiveness. Such approaches again see a virtuous circle with
specialization and spatial concentration of economic activity a likely outcome. Accessibility or peripherality, from this perspective impact in terms of
remoteness from and lack of access to in such increasing returns and the benefits of clustering.
2.8. More recent accounts have stressed the importance of the broader geography of the knowledge economy. This includes the role that concentrations of knowledge workers and knowledge-based activities can play in driving innovation and growth. It also includes the characteristics of different places and their attractiveness to such workers. American academic commentator Richard Florida (Florida, 2002) points to the key role of the ‘creative classes’ as the new drivers of competitive advantage. Similarly Kotkin and DeVol (2001) argue the importance of ‘knowledge value cities’.
Aspatial peripherality
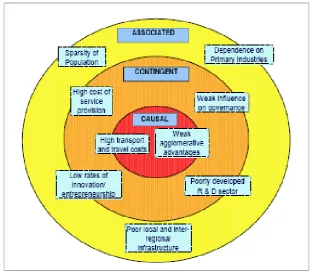
[image:14.595.113.430.426.705.2]2.9. One of the main recent initiatives in the field was the EU AsPIRE7 Framework 5 programme which funded a number of studies including some based on a survey of businesses in six peripheral and six less peripheral areas across the EU, as small as the District Council area level in the case of the Scotland case study (see Copus and Macleod (2004). This focused on what was termed ‘Aspatial’ aspects of peripherality. Initially, Copus and Macleod provide a conceptual model of peripherality as conventionally described:
Figure 2.1: The Elements of Conventional Concepts of Peripherality
Source: Copus and MacLeod, 2004
7
They argue that the “causal” spatial factors appear to have less influence with the growth of the service sector and the growth of e-commerce and ICT. They
propose a set of six aspatial dimensions of peripherality (Copus and MacLeod, 2004):
ICT infrastructure
Human capital (skills necessary to exploit ICT) Local Business Networks
Social Capital
Institutional Networks Local/Global Links
2.10. Associated with these dimensions, Copus and Macleod and others hypothesize the mechanisms by which they might be supposed to impact on economic performance. ICT (and the human capital to exploit it) are seen as
compensating for deficiencies in physical communications infrastructure and providing a platform for e-business and e-commerce (Grimes, 2004). The position of Wales in relation to this “virtual peripherality” is discussed below. Business networks are seen as facilitating innovation while social capital allows the evolution of co-operation and trust. Institutional networks with sound governance support enterprises while global links allow the timely flow of new knowledge and information about opportunities to businesses in the area.
2.11. The Aspire programme attempted to assess the importance of these aspatial factors on business performance using a case study approach, surveying businesses and support agencies in 12 districts in 6 countries of the EU. The districts were chosen so that there was one peripheral and one less peripheral area in each country.
2.12. The findings with respect to ICT and human capital are considered in the discussion of virtual peripherality below. The role of social capital and institutional proved difficult to test empirically, although some evidence for the potential to compensate for peripherality was found. The findings in terms of the role of business networks and global links were more informative. 2.13. Dimara, Goudis and Skuras (2004), looked at business networks and global
links as part of the AsPIRE programme. They distinguished between vertical links, from local area businesses to regional, national and global organizations and horizontal links between businesses in the local area. They postulated that strong links of both types were important for business success and found that there was a tendency for vertical links to be weaker in more peripheral areas. They also found that firm with strong local links tended to source inputs and market outputs locally, to the benefit of the local economy. Firms with strong vertical links tended to export output, helping to boost income flows into the area (Dimara, Goudis and Skuras, 2004).
This was not accounted for by firm level factors but by local area
characteristics, including networks. (Copas, Skuras and Tsegenidi, 2006).
Virtual peripherality
2.15. The broad thrust of the results of our analysis above is that much of the
variation in the labour productivity of businesses across the areas of Wales and the UK as a whole can be explained by firm level factors, sector, physical accessibility and spatial spillover effects. However, some unexplained
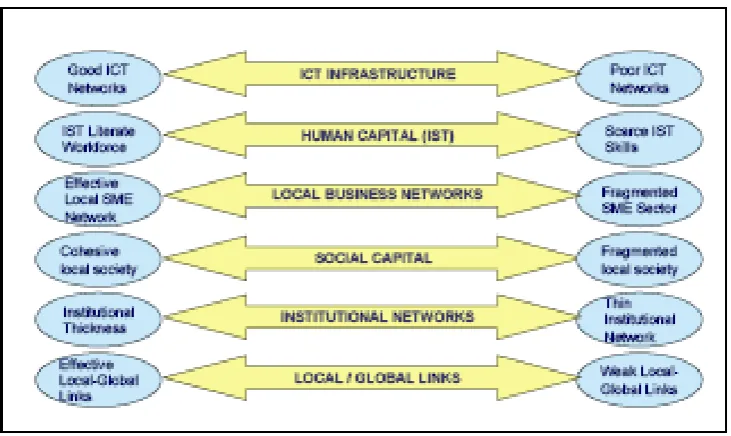
[image:16.595.130.496.336.554.2]variation remains and it possible that part of this could be due to the influence of what has been termed Aspatial Peripherality (Copus and MacLeod, 2004). Aspatial Peripherality (AsP) as described by Copus and Macleod can be grouped into three dimensions: poor utilisation of new information and communication technology, inadequate linkage to global business networks and weaknesses in governance structures and social capital. These are further subdivided into six elements in the figure 2.2 below:
Figure 2.2: Aspatial peripherality
Source: Copus and Macleod (2004)
2.16. The first two elements constitute what we term “virtual peripherality”, a condition where relative access to and usage of communication and information technology CIT) is at low level. The contribution of all six
elements to business growth in 12 study areas in the EU was the subject of the AsPIRE initiative, conclusions reported in a number of papers at the Regional Science Association conference in 2004. Evidence was found of some
contribution of aspatial peripherality to explaining lower business growth in the more peripheral study areas.
had significant Broadband access, unlike other EU study areas. Nevertheless, there was a relatively high incidence of internet use by businesses for a wide range of commercial functions in both areas although there were a
disproportionate number of businesses in primary sectors taking the view that fuller use of e-trading was inappropriate to their businesses. This was
particularly marked in Shetland. A hypothesis that the survey sought to test was that virtual connectivity can compensate for spatial peripherality. The results suggested that this was generally the dominant view of respondent businesses, although not particularly markedly so in Scotland. In 2004 there was considerable inertia in adopting ICT as a fundamental trading platform. This was in part due to a lack of appropriate skills, an unwillingness to invest money and time in a business model not perceived as appropriate and the disincentive inherent in ICT infrastructure provision in peripheral areas. 2.18. Although there have been general improvements in the performance of ICT
3. DEVELOPING INDICES OF PERIPHERALITY AND ACCESSIBILITY.
3.1. As noted above, previous work for the Welsh Assembly Government by the current authors had included only population density and a relatively crude measure of peripherality relative to major conurbations as possible
explanatory factors. Here we review previous attempts to build peripherality into such analysis and describe the new measures developed for this study. 3.2. Rice and Venables (2004) looked at the impact on productivity of economic
mass, measured as the size of the working-age population within a given drive-time of each NUTS 3 area across Great Britain. They find a significant effect of proximity to economic mass on productivity. This is greatest for mass within 40 minutes drive time and tapers off quite steeply to zero beyond around 80 miles. Their findings suggest that doubling mass raises productivity in a given area by 3.5%. They demonstrate their results to be robust and independent of any dominant effect of London and the South East. Just over a third (34%) of the predicted spatial variation in UK productivity8 is attributable to variance in economic mass, compared to 46% that is due to variance in levels of
qualification and other region-specific factors.9 Removing Inner London increases this to 40%. Removing the most productive 25% of areas increases it to more than two-thirds – in other words, the effects of economic mass on productivity are greater in the less productive areas. This points to the
importance of economic mass as a constituent of peripherality suggesting that it should be considered when constructing indices of peripherality. The study also suggests that the impacts of economic mass and by association peripherality, may not be linear – given that the effects of economic mass are greater in less productive and possibly more peripheral areas.
3.3. The European Peripherality Index (EPI) (Schurmann and Talaat, 2002) was developed in order to identify peripheral regions across the then 15 member states and 12 candidate countries which might be targeted for transport improvements under the Trans-European Transport Network initiative. The economic potential of a region was assumed to be a function of its economic ‘mass’ its proximity in terms of travel time to all other regions and their economic ‘mass’. A range of different indicators were calculated at NUTS 3 level based on travel time by car and by lorry and with different mass terms including GDP, employment and population. Two of these are presented in appendix one, access to population by car and access to GDP by lorry. 3.4. Given the overall spatial definition of the study area at the European level,
both indices display a strong centre/periphery pattern with above average accessibility centered on Benelux, Germany and northern France. The most peripheral, as would be expected, include Scandinavia, the Mediterranean islands, northern Scotland, Northern Ireland and the Republic of Ireland. Wales in below average in terms the first of these indices but only just – it is relatively close to the heartland of Europe in terms of travel time compared with more geographically peripheral areas. In terms of the second index, access to GDP by lorry it is actually slightly above average. The EPI is interesting in
8
i.e. that part of total variation that is explained by the model..
9
methodological terms, pointing to the use of mass and travel time as
components. Because, however, it is specifically focused at the European scale it does no provide much differentiation within the UK or within territories of the scale of Wales. Importantly as well, proximity to markets, employment and economic activity at a European scale are of relatively low importance as determinants of economic performance across the UK or within a territory such as Wales. In other words it is peripherality within the context of the England and Wales or the UK more generally that is likely to be of much greater relevance to the present study. What was needed, therefore, for the present study was an index of peripherality specific to the study area, namely England and Wales. It should also be noted that the present study set out to explain variation in GDP. Incorporating it in an index of peripherality, intended as an explanatory variable, would not therefore be appropriate.10
3.5. Initially, therefore, in order to examine the impacts of peripherality and remoteness on productivity, a range of indices were developed specifically for this study. Drawing on previous studies, two broad approaches were used. The two approaches provide alternative measures of what might be termed remoteness, dispersal or locational disadvantage.
3.6. The first measure which we term peripherality per se uses a gravity-model formulation based on the inverse of travel distance between places by road11 and a measure of the potential of interaction between places based on mass in terms of population size. This index was built up at unitary authority/district-level across the whole of Wales and England. It provides a broadly-based index measuring what is commonly called economic mass or economic potential. It incorporates information on the size and location relative to all other places in Wales and England.
3.7. The second measure, which we term ‘accessibility’, provides a measure of local accessibility derived from of travel time to cities and towns within a defined range of any location.12 It represents a more locally focused
measure emphasising accessibility to centres of population, employment and economic activity within a maximum of two hours drive-time from any given location. This index was built up as a GIS data base providing measurements at the scale of a 1 km square. Average values were then derived at the level of unitary authorities/districts for the purposes of statistical analysis. 3.8. A further set of composite indices, combining the two – peripherality and
accessibility was also derived and was included in subsequent versions of the analysis. These composite indices combined the two core indices with different weights to each (table 3.1) and were calculated at the level of unitary authorities/districts.
10 We would also suggest that it was not appropriate in the context of the EPI given that productivity is
a measure of economic performance itself rather than of economic mass as measured for example by employment, which is commonly seen as one factor determining levels of economic performance.
11 Based on Ordnance Survey data sets.
12 Five time zones were constructed around each city (from 0-0.25 hours up to 1.5-2 hours) and two
Table 3.1 : Structure of alternative composite indices
Index Peripherality Local Accessibility
1 0 100
2 100 0
3 50 50
4 25 75
5 75 25
3.9. As might be expected, there is a significant degree of similarity between the two base indices, peripherality and local accessibility. The degree of
association between the two, a correlation of 0.52, clearly indicates however that the two indices measure different aspects of peripherality. The degree of association between the different indices including the composite measures is shown in table 3.2
Table 3.2: Correlations between alternative indices
Local Accessibility Peripherality 50P:50A 25P:75A 75P:25A
Local Accessibility 1.000 – – – –
Peripherality 0.515 1.000 – – –
50P:50A 0.957 0.698 1.000 – –
25P:75A 0.993 0.595 0.985 1.000 –
75P:25A 0.847 0.811 0.965 0.905 1.000
n = 18,659
3.10. This demonstrates the relatively high correlation between most of the
alternative measures, suggesting in turn that their explanatory power in relation to productivity may show little difference.
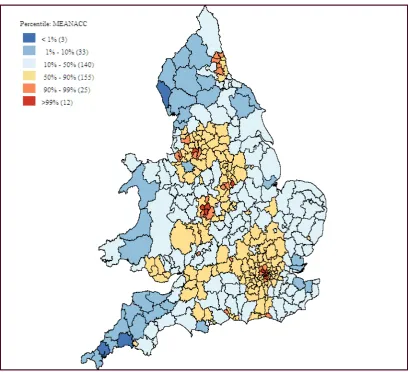
3.11. Figure 3.1 shows the pattern for the first of the indices listed in table 2.1, mean accessibility across England and Wales at a district/unitary authority level. It shows a general core-periphery pattern across England and Wales as a whole. It also however shows the influence of both London and the main conurbations and larger urban areas, leading to a poly-nuclear pattern. London, Birmingham, Manchester, the North-East and other major conurbations have high levels of accessibility. So too do much of the London commuter belt, the London-Brighton corridor and the M4 corridor. Cardiff and South Wales have relatively high levels of accessibility in an England and Wales context but fall short of the particularly high levels seen at the core of the English conurbations. The precise visual representation is influenced by the cut-off values selected but levels of
Figure 3.1: Standardised mean accessibility (standard deviation)
Figure 3.2: Labour productivity, England and Wales
3.13. As with accessibility there is, again, a broad centre-periphery pattern overall albeit with the highest values more clearly concentrated in and close to London. There are, again, higher values focused on the main conurbations and the M4 corridor is picked out. There would appear to be more of a concentration of areas with higher levels of labour productivity in the outer south-east and the London-Birmingham axis. The relatively low levels of productivity in Wales as a whole, in the context of England and Wales are evident with not even South Wales performing beyond the mean on this particular measure.
3.14. Additional maps for the three composite indices (3-5 in table 3.1) are presented in appendix two. These are based on the original data for the index of local accessibility, combined with the peripherality index and therefore provide information at a more detailed resolution of 1 km sq.
4. THE DETERMINANTS OF PRODUCTIVITY DIFFERENTIALS
4.1. This section reports on the statistical analysis of factors determining spatial differentials in productivity, including the influence, specifically, of
peripherality and accessibility. The analysis presented here uses plant level data held by the Office for National Statistics in the Annual Respondents Database (ARD2). This brings together a wide range of data relating to individual
business units (ONS, 2002). The complete ARD2 data set includes all firms with greater than 250 employees in England (which are surveyed on an annual basis as a statutory requirement), but only a sample of firms with fewer than 250 employees. Smaller firms are sampled on a random basis (see ONS, 2002, p.2). This plant level assessment accounts for the numbers of plants within a firm by using the variable llunit, which is the log of the number of plants within the firm establishment. If the firm is a single plant establishment then this is equal to zero. GVA at factor cost per worker is used as the measure of productivity, measured at the plant (and therefore work-based) rather than the place of residence. It is important to note the level at which the data for the ARD2 are collected. This is the level of the plant and there may be more than one plant in a firm. In the analysis, the term ‘plant’ is therefore used, rather than ‘firm’ or ‘business’, as the base economic unit of the analysis. We also employ the most up to date data available at the present time – this is data for the year 2004. 4.2. Data on firm-specific capital stock is obtainable from the ONS and is matched
with firm-specific data within the ARD2. Although this is not identical to the Treasury investment productivity driver (CURDs, 2003), it represents the result of past investments and is appropriate in modelling based on the Cobb-Douglas production function.
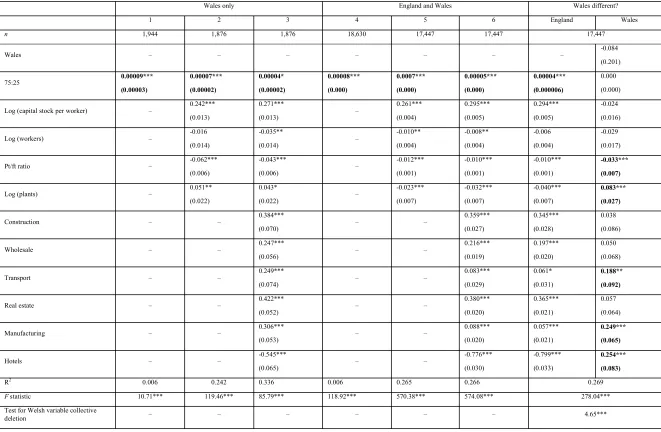
4.3. Tables 4.1 to 4.5 present the results of the analysis which, in each case seeks to explain productivity differentials in terms of peripherality/accessibility and other factors. Looking at table 4.1, column 1, initially, shows the effect of
peripherality alone on labour productivity. Column 2 adds in capital stock, employment levels, the number of plants within firms and the part-time:full-time ratio. Column 3, finally, adds in industrial structure.
4.4. These first three columns relate only to the sample of plants that are located in Wales. Columns 4 to 6 repeat the analysis for all plants in Wales and England. The purpose of this approach is first to identify whether these explanatory variables are important for Welsh plants and then to identify whether the same explanatory variables are important for Welsh and English plants in general 4.5. Column 7, finally, presents the results of analysis to determine, statistically,
whether there are significant differences between Wales and England in terms of different variables.13 Two pieces of information are required to understand this
13Column 7 presents the results of a pseudo-chow test where the explanatory variables are clustered
column. First, any coefficients in the Wales column with ***, ** or * are statistically significantly different for Wales than for England. Second, to identify whether the effect is stronger in Wales than in England we need to add the coefficients together.
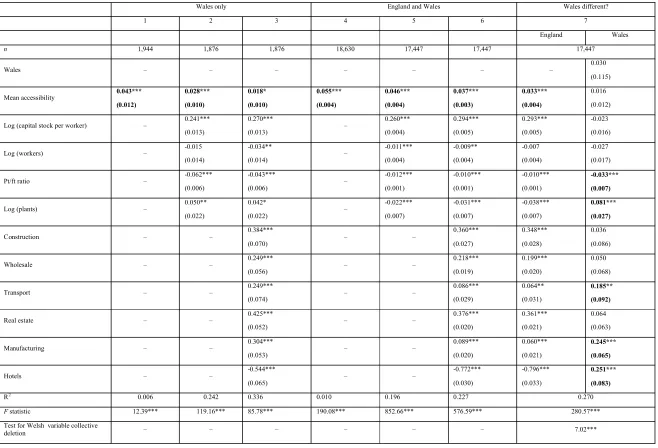
4.6. Table 4.1 presents these results using mean accessibility as the index of
peripherality (index 1 in table 3.1). Tables 4.2 to 4.5 present the same analysis but using different measures of peripherality in each case.
Initial findings
4.7. Looking first at table 4.1, there is clearly a statistically significant relationship between labour productivity and mean accessibility. This is to be expected given the broadly similar patterns displayed by the two variables in figures 3.1 and 3.2 above. The results suggest that plants that are located in areas that are more accessible are also more productive (column 1). However this may be artificially high because it is also capturing other effects that are associated with accessibility, such as the availability of workers. Column 2 introduces additional explanatory variables and the effect of accessibility on labour productivity does seem to reduce. Part of the spatial labour productivity divide associated with accessibility can therefore be partly attributable to the amount of capital stock, the size of the workforce, the effect of employing more part-time workers and the number of plants within the firm. Nevertheless we can still be sure that accessibility has a statistically significant influence on labour productivity, at the 99% confidence level. Column 3 introduces industrial structure and again the effect of accessibility appears to fall. Accessibility still appears to have an impact but the degree of confidence in this relationship is somewhat lower at just over 90%.
4.8. These results are repeated for England and Wales. Although similar results are generated several important differences should be highlighted. First the effect of accessibility on productivity appears to be consistently larger for the whole sample, suggesting that accessibility may be a smaller influence on labour productivity in Wales than in England. Second the amount of capital stock the plant has access to seem to have a relatively smaller effect on labour
productivity in Wales than in England. Third, there may be more of a tendency to over-manning or above average use of labour relative to capital in Wales relative to England and Wales together – this may reflect lower costs of labour in more remote areas. Fourth part-time workers appear to have a larger
detrimental effect on labour productivity in Wales than in England. Fifth, larger numbers of plant within a firm seems to allow Welsh plants to gain higher levels of labour productivity; this may be due to the sharing of knowledge, working practices, etc. However the opposite effect appears for the whole sample which probably is capturing the administrative and managerial complexities of running multiple plant firms. Finally, the magnitude of industrial dummy variables differs between the final columns. Relative to plants that operate in the all other industries, labour productivity of Welsh plants appear to be higher in any of the other sectors, and this enhancing effect is greater in Welsh plants than in the whole sample.
4.9. Another way to think about these results is the following. The effect of
by the plant’s characteristics and the sector in which it operates. So, for
example, plants across the accessibility continuum may well decide to alter their choice of techniques (such as their ratio of labour to capital) in order to offset the detrimental effect typically associated with accessibility. Plants operating in inaccessible areas may decide to employ greater proportions of cheap, part time workers than to invest in capital equipment which would take a long time to pay for due to their low levels of turnover. Plants operating in certain industries could also choose their location carefully so that increasing transportation costs do not reduce their ability to compete with plants located in the core of the market place. For instance, hotels and bed and breakfast companies may be able to charge higher prices for the ‘experience’ of being in a more inaccessible location, and these higher prices will in turn be reflected as higher value added and higher labour productivity levels.
4.10. Column 7 indicates that accessibility does not influence Welsh plants differently than for English plants. In general, Welsh plants are not statistically significantly affected by capital stocks and scale economies any differently than English plants. However the detrimental effect of greater proportions of part-time workers is greater. Plants operating in the transport and manufacturing sectors have significantly higher labour productivity rates than comparable plants in England. Relative to plants operating in other sectors, the detrimental effect of operating in the hotel and catering sector is much smaller, suggesting a
Table 4.1: Mean accessibility
Wales only England and Wales Wales different?
1 2 3 4 5 6 7
England Wales
n 1,944 1,876 1,876 18,630 17,447 17,447 17,447
Wales – – – – – – – 0.030
(0.115)
Mean accessibility 0.043***
(0.012) 0.028*** (0.010) 0.018* (0.010) 0.055*** (0.004) 0.046*** (0.004) 0.037*** (0.003) 0.033*** (0.004) 0.016 (0.012)
Log (capital stock per worker) – 0.241*** (0.013) 0.270*** (0.013) – 0.260*** (0.004) 0.294*** (0.005) 0.293*** (0.005) -0.023 (0.016)
Log (workers) – -0.015
(0.014) -0.034** (0.014) – -0.011*** (0.004) -0.009** (0.004) -0.007 (0.004) -0.027 (0.017)
Pt/ft ratio – -0.062***
(0.006) -0.043*** (0.006) – -0.012*** (0.001) -0.010*** (0.001) -0.010*** (0.001) -0.033*** (0.007)
Log (plants) – 0.050**
(0.022) 0.042* (0.022) – -0.022*** (0.007) -0.031*** (0.007) -0.038*** (0.007) 0.081*** (0.027)
Construction – – 0.384***
(0.070) – –
0.360*** (0.027) 0.348*** (0.028) 0.036 (0.086)
Wholesale – – 0.249***
(0.056) – –
0.218*** (0.019) 0.199*** (0.020) 0.050 (0.068)
Transport – – 0.249***
(0.074) – –
0.086*** (0.029) 0.064** (0.031) 0.185** (0.092)
Real estate – – 0.425***
(0.052) – –
0.376*** (0.020) 0.361*** (0.021) 0.064 (0.063)
Manufacturing – – 0.304***
(0.053) – –
0.089*** (0.020) 0.060*** (0.021) 0.245*** (0.065)
Hotels – – -0.544***
(0.065) – –
-0.772*** (0.030) -0.796*** (0.033) 0.251*** (0.083)
R2 0.006 0.242 0.336 0.010 0.196 0.227 0.270
F statistic 12.39*** 119.16*** 85.78*** 190.08*** 852.66*** 576.59*** 280.57***
Test for Welsh variable collective
Alternative measures of peripherality
4.11. Table 4.2 repeats the analysis but instead of using accessibility as our measure of geographical disconnectedness we employ the peripherality variable (Index 2 in table 3.2). As these variables are constructed in different ways we should expect different coefficient magnitudes. Nevertheless the important things to note here are the signs and the statistical stability of the results across the tables and across these geographical indicators. Major differences in these would indicate that the
accessibility and peripherality variables are capturing very different things.
Table 4.2: Peripherality
Wales only England and Wales Wales different?
1 2 3 4 5 6 England Wales
n 1944 1876 1876 18,630 17,447 17,447 17,447
Wales – – – – – – – -0.111
(0.093) Peripherality 0.0002** (0.0001) 0.0002** (0.0001) 0.0001 (0.0001) 0.0001*** (0.000) 0.0001*** (0.000) 0.00008*** (0.000) 0.00007*** (0.00001) 0.000 (0.000)
Log (capital stock per worker) – 0.242***
(0.013) 0.270*** (0.013) – 0.262*** (0.004) 0.296*** (0.005) 0.295*** (0.005) -0.024 (0.016)
Log (workers) – -0.015
(0.014) -0.034** (0.014) – -0.009** (0.004) -0.008* (0.004) -0.005 (0.004) -0.029* (0.017)
Pt/ft ratio – -0.063***
(-0.006) -0.043*** (0.006) – -0.012*** (0.001) -0.010*** (0.001) -0.010*** (0.001) -0.033*** (0.007)
Log (plants) – 0.050**
(0.022) 0.043* (0.022) – -0.023*** (0.007) -0.033*** (0.007) -0.040*** (0.007) 0.083*** (0.027)
Construction – – 0.387***
(0.070) – –
0.361*** (0.027) 0.346*** (0.028) 0.041 (0.086)
Wholesale – – 0.246***
(0.056) – –
0.218*** (0.019) 0.197*** (0.020) 0.049 (0.068)
Transport – – 0.251***
(0.074) – –
0.085*** (0.029) 0.062** (0.031) 0.189** (0.092)
Real estate – – 0.424***
(0.052) – –
0.386*** (0.020) 0.369*** (0.021) 0.055 (0.064)
Manufacturing – – 0.311***
(0.053) – –
0.088*** (0.020) 0.056*** (0.021) 0.255*** (0.065)
Hotels – – -0.545***
(0.065) – –
-0.777*** (0.030) -0.799*** (0.033) 0.254*** (0.083)
R2 0.002 0.240 0.335 0.004 0.192 0.264 0.268
F statistic 3.99** 118.25*** 85.53*** 71.02*** 826.66*** 567.30*** 277.18***
Test for Welsh variable collective
deletion – – – – – – 8.54***
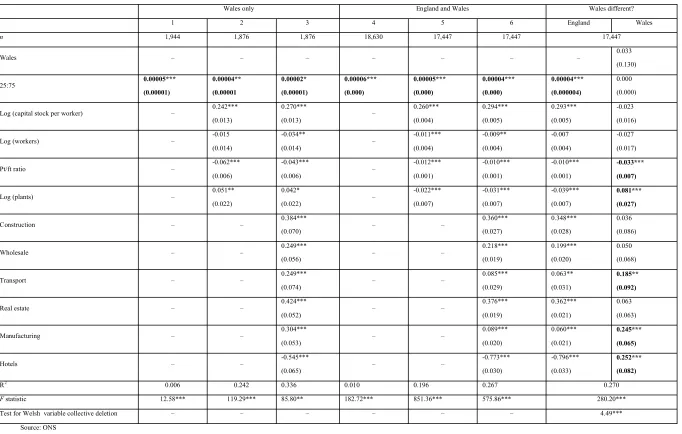
4.13. Table 4.3, 4.4 and 4.5 go on to replicate the analysis above with different weights attached to the core indices (indices 3-5 in table 3.1). Again, the results using
different weightings of these variables are also shown to be very similar. This is not surprising given the similarity between the findings based on the two core indices. 4.14. In addition to the above, several important observations can be made taking tables
4.1-4.5 together. First, almost without exception, the different combinations of peripherality and accessibility are consistently statistically significant in driving labour productivity rates. The only exception is for the peripherality measure and then only when the extra explanatory variables are included in the regression results and for Wales on its own. This suggests that the influence of peripherality alone (index 1 in table 2.1) on Welsh labour productivity may be explained away by the inclusion of the extra explanatory variables. This may be because it is peripherality in relation to London and the South East and other major conurbations within England that matters and that once businesses have passed some threshold level of peripherality, any additional increase in peripherality has little impact.14 On this specific measure, in effect the whole of Wales suffers the effects of peripherality with little distinction between different parts of the country.
4.15. This, however, is not the case for the accessibility variable. Based on this analysis, and because the aim of this analysis is partly to identify the influence of
geographical disconnectedness on labour productivity, we move forward in this analysis by employing the accessibility variable alone as it is consistently a statistically significant driver of labour productivity.
14 This is consistent with the study by Rice and Venables (2004) who found that the adverse effects of drive
Table 4.3: Mean accessibility and peripherality: 50:50
Wales only England and Wales Wales different?
1 2 3 4 5 6 England Wales
n 1,944 1,876 1,876 18,630 17,447 17,447 17,447
Wales – – – – – – – 0.008
(0.156) 50:50 0.00007*** (0.00002) 0.00005*** (0.00001) 0.00003* (0.00001) 0.00007*** (0.000) 0.0006*** (0.000) 0.00005*** (0.000) 0.00004*** (0.000003) 0.000 (0.000)
Log (capital stock per worker) – 0.242*** (0.013) 0.271*** (0.013) – 0.260*** (0.004) 0.295*** (0.005) 0.294*** (0.005) -0.023 (0.016)
Log (workers) – -0.016
(0.014) -0.034** (0.014) – -0.011** (0.004) -0.009** (0.004) -0.006 (0.004) -0.028 (0.017)
Pt/ft ratio – -0.062***
(0.006) -0.043*** (0.006) – -0.012*** (0.001) -0.010*** (0.001) -0.010*** (0.001) -0.033*** (0.007)
Log (plants) – 0.051**
(0.022) 0.042* (0.022) – -0.022*** (0.007) -0.032*** (0.007) -0.039*** (0.007) 0.082*** (0.027)
Construction – – 0.383***
(0.070) – –
0.360*** (0.027) 0.347*** (0.028) 0.037 (0.086)
Wholesale – – 0.248***
(0.056) – –
0.217*** (0.019) 0.198*** (0.020) 0.050 (0.068)
Transport – – 0.249***
(0.074) – –
0.084*** (0.029) 0.062** (0.031) 0.186** (0.092)
Real estate – – 0.423***
(0.052) – –
0.377*** (0.020) 0.362*** (0.021) 0.061 (0.064)
Manufacturing – – 0.305***
(0.053) – –
0.089*** (0.020) 0.059*** (0.021) 0.246*** (0.065)
Hotels – – -0.545***
(0.065) – –
-0.774*** (0.030) -0.797*** (0.033) 0.253*** (0.083)
R2 0.006 0.242 0.336 0.009 0.195 0.266 0.270
F statistic 12.43*** 119.45*** 85.82*** 162.93*** 847.34*** 574.08*** 279.43***
Test for Welsh variable collective
deletion – – – – – – 4.53***
Table 4.4: Mean accessibility and peripherality: 75:25
Wales only England and Wales Wales different?
1 2 3 4 5 6 England Wales
n 1,944 1,876 1,876 18,630 17,447 17,447 17,447
Wales – – – – – – – -0.084
(0.201) 75:25 0.00009*** (0.00003) 0.00007*** (0.00002) 0.00004* (0.00002) 0.00008*** (0.000) 0.0007*** (0.000) 0.00005*** (0.000) 0.00004*** (0.000006) 0.000 (0.000)
Log (capital stock per worker) – 0.242*** (0.013) 0.271*** (0.013) – 0.261*** (0.004) 0.295*** (0.005) 0.294*** (0.005) -0.024 (0.016)
Log (workers) – -0.016
(0.014) -0.035** (0.014) – -0.010** (0.004) -0.008** (0.004) -0.006 (0.004) -0.029 (0.017)
Pt/ft ratio – -0.062***
(0.006) -0.043*** (0.006) – -0.012*** (0.001) -0.010*** (0.001) -0.010*** (0.001) -0.033*** (0.007)
Log (plants) – 0.051**
(0.022) 0.043* (0.022) – -0.023*** (0.007) -0.032*** (0.007) -0.040*** (0.007) 0.083*** (0.027)
Construction – – 0.384***
(0.070) – –
0.359*** (0.027) 0.345*** (0.028) 0.038 (0.086)
Wholesale – – 0.247***
(0.056) – –
0.216*** (0.019) 0.197*** (0.020) 0.050 (0.068)
Transport – – 0.249***
(0.074) – –
0.083*** (0.029) 0.061* (0.031) 0.188** (0.092)
Real estate – – 0.422***
(0.052) – –
0.380*** (0.020) 0.365*** (0.021) 0.057 (0.064)
Manufacturing – – 0.306***
(0.053) – –
0.088*** (0.020) 0.057*** (0.021) 0.249*** (0.065)
Hotels – – -0.545***
(0.065) – –
-0.776*** (0.030) -0.799*** (0.033) 0.254*** (0.083)
R2 0.006 0.242 0.336 0.006 0.265 0.266 0.269
F statistic 10.71*** 119.46*** 85.79*** 118.92*** 570.38*** 574.08*** 278.04***
Test for Welsh variable collective
Table 4.5: Mean accessibility and peripherality: 25:75
Wales only England and Wales Wales different?
1 2 3 4 5 6 England Wales
n 1,944 1,876 1,876 18,630 17,447 17,447 17,447
Wales – – – – – – – 0.033
(0.130) 25:75 0.00005*** (0.00001) 0.00004** (0.00001 0.00002* (0.00001) 0.00006*** (0.000) 0.00005*** (0.000) 0.00004*** (0.000) 0.00004*** (0.000004) 0.000 (0.000)
Log (capital stock per worker) – 0.242***
(0.013) 0.270*** (0.013) – 0.260*** (0.004) 0.294*** (0.005) 0.293*** (0.005) -0.023 (0.016)
Log (workers) – -0.015
(0.014) -0.034** (0.014) – -0.011*** (0.004) -0.009** (0.004) -0.007 (0.004) -0.027 (0.017)
Pt/ft ratio – -0.062***
(0.006) -0.043*** (0.006) – -0.012*** (0.001) -0.010*** (0.001) -0.010*** (0.001) -0.033*** (0.007)
Log (plants) – 0.051**
(0.022) 0.042* (0.022) – -0.022*** (0.007) -0.031*** (0.007) -0.039*** (0.007) 0.081*** (0.027)
Construction – – 0.384***
(0.070) – –
0.360*** (0.027) 0.348*** (0.028) 0.036 (0.086)
Wholesale – – 0.249***
(0.056) – –
0.218*** (0.019) 0.199*** (0.020) 0.050 (0.068)
Transport – – 0.249***
(0.074) – –
0.085*** (0.029) 0.063** (0.031) 0.185** (0.092)
Real estate – – 0.424***
(0.052) – –
0.376*** (0.019) 0.362*** (0.021) 0.063 (0.063)
Manufacturing – – 0.304***
(0.053) – –
0.089*** (0.020) 0.060*** (0.021) 0.245*** (0.065)
Hotels – – -0.545***
(0.065) – –
-0.773*** (0.030) -0.796*** (0.033) 0.252*** (0.082)
R2 0.006 0.242 0.336 0.010 0.196 0.267 0.270
F statistic 12.58*** 119.29*** 85.80** 182.72*** 851.36*** 575.86*** 280.20***
Test for Welsh variable collective deletion – – – – – – 4.49***
Accessibility and productivity – the shape of the relationship
4.16. The relationship between accessibility and productivity might take different forms. It could be a simple, linear relationship where a given increase in accessibility has a given impact on productivity whatever the actual level of the two variables. There are different theoretical reasons for different shapes of this relationship. For instance, a simple explanation might suggest that the relationship should be negative and linear and this would capture the influence of higher transportation costs on the ability to compete on price: greater distances increase transportation costs (in terms of fuel, time and operating costs), reduce the ability to charge lower prices and lower the measured added value in production.15
4.17. Alternatively, access may have strong effects where access is high but its impact may decrease as peripherality reaches higher levels. This would suggest a J shaped relationship with accessibility initially impacting strongly on productivity but tailing of in more peripheral areas.16
4.18. Thirdly, however, transportation costs can work in at least two ways: first they can reduce the ability of geographically disconnected plants to compete in the core of a market, but, second, they can reduce the ability of plants located in the core of the market to compete with plants in geographically disconnected locations (essentially geographically disconnectedness is insulating plants from competition) This might be reflected in higher prices and lower labour costs in more peripheral locations. Because of this two way effect the shape of the relationship between geographically disconnectedness and labour productivity may even be U-shaped. For these reasons the analysis went on to investigate the shape of the relationship between
geographically disconnectedness and labour productivity.
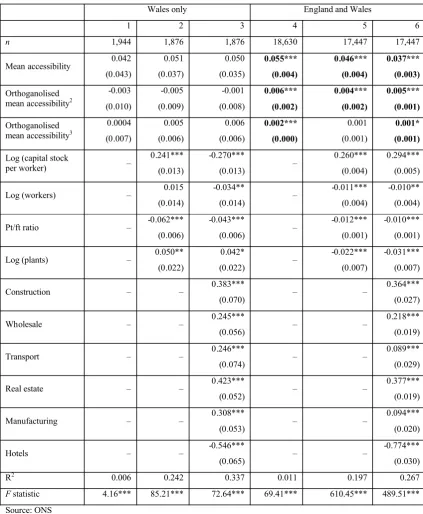
4.19. Table 4.6 presents the same type of results as before but includes three accessibility variables: mean accessibility, orthoganolised mean accessibility squared and orthoganolised mean accessibility cubed to represent possible linear, J-shaped or U-shaped relationships. If, however, we were simply to include the square (and/or cube) of the accessibility variable then there would be a high degree of correlation and multicollinearity between the variables. For this reason the accessibility variables were orthoganolised at higher orders to avoid this econometric problem.
15 Higher transport costs may of course to some extent be offset in more remote locations by lower costs of
labour and premises. Lower wage costs may also explain lower capital stock relative to labour in more remote areas.
Table 4.6: Simple and compound mean accessibility
Wales only England and Wales
1 2 3 4 5 6
n 1,944 1,876 1,876 18,630 17,447 17,447
Mean accessibility 0.042
(0.043) 0.051 (0.037) 0.050 (0.035) 0.055*** (0.004) 0.046*** (0.004) 0.037*** (0.003) Orthoganolised mean accessibility2
-0.003 (0.010) -0.005 (0.009) -0.001 (0.008) 0.006*** (0.002) 0.004*** (0.002) 0.005*** (0.001) Orthoganolised mean accessibility3
0.0004 (0.007) 0.005 (0.006) 0.006 (0.006) 0.002*** (0.000) 0.001 (0.001) 0.001* (0.001)
Log (capital stock
per worker) –
0.241*** (0.013) -0.270*** (0.013) – 0.260*** (0.004) 0.294*** (0.005)
Log (workers) – 0.015
(0.014) -0.034** (0.014) – -0.011*** (0.004) -0.010** (0.004)
Pt/ft ratio – -0.062***
(0.006) -0.043*** (0.006) – -0.012*** (0.001) -0.010*** (0.001)
Log (plants) – 0.050**
(0.022) 0.042* (0.022) – -0.022*** (0.007) -0.031*** (0.007)
Construction – – 0.383***
(0.070) – –
0.364*** (0.027)
Wholesale – – 0.245***
(0.056) – –
0.218***
(0.019)
Transport – – 0.246***
(0.074) – –
0.089***
(0.029)
Real estate – – 0.423***
(0.052) – –
0.377***
(0.019)
Manufacturing – – 0.308***
(0.053) – –
0.094***
(0.020)
Hotels – – -0.546***
(0.065) – –
-0.774***
(0.030)
R2 0.006 0.242 0.337 0.011 0.197 0.267
F statistic 4.16*** 85.21*** 72.64*** 69.41*** 610.45*** 489.51***
Source: ONS
4.21. Of particular interest, however, is the relationship between accessibility and labour productivity. Columns 1-3 show that the more complex shapes of the relationship between accessibility and labour productivity seem to be watering down the general relationship; this is only the case for Wales and this might be because of a relatively small sample of plants.
4.22. The simple linear relationship between accessibility and labour productivity remains for the whole sample even when more complex interactions are also included in the equation. Almost without exception all accessibility variable coefficients are statistically significant at least at the 90% confidence level; all coefficients are positive.
4.23. Table 4.7 presents three sets of econometric results which further explore the shape of the relationship between accessibility and labour productivity. The purpose of this is to identify whether the shape of the relationship between accessibility variables and labour productivity varies with the inclusion of extra explanatory variables and whether the shape of the relationship is different for Wales when compared to England.
4.24. Columns 1-3 all illustrate that we can not be sure the relationship between
Table 4.7: Are Welsh plants different than English plants? – Whole sample, Welsh dummy variables
1 2 3
England Wales England Wales England Wales
n 18,630 17,447 17,447
Wales – -0.175
(0.330) –
-0.199
(0.294) –
-0.204
(0.283)
Mean accessibility 0.047*** (0.004) -0.004 (0.049) 0.039*** (0.004) 0.012 (0.042) 0.032*** (0.004) 0.018 (0.041) Orthoganolised mean accessibility2
0.004** (0.002) -0.007 (0.012) 0.003 (0.002) -0.008 (0.010) 0.004*** (0.002) -0.006 (0.010) Orthoganolised mean accessibility3
0.002*** (0.001) -0.002 (0.008) 0.001 (0.001) 0.004 (0.007) 0.001** (0.001) 0.005 (0.007)
Log (capital stock
per worker) – –
0.258*** (0.005) -0.017 (0.015) 0.292*** (0.005) -0.022 (0.016)
Log (workers) – – -0.009
(0.004) -0.006 (0.017) -0.007* (0.004) -0.027 (0.017)
Pt/ft ratio – – -0.011***
(0.001) -0.051*** (0.007) -0.010*** (0.001) -0.033*** (0.007)
Log (plants) – – -0.032***
(0.007) 0.082*** (0.026) -0.038*** (0.007) 0.081*** (0.027)
Construction – – – – 0.352***
(0.028)
0.031
(0.086)
Wholesale – – – – 0.200***
(0.020)
0.044
(0.068)
Transport – – – – 0.067**
(0.031)
0.180**
(0.092)
Real estate – – – – 0.362***
(0.021)
0.061 (0.063)
Manufacturing – – – – 0.064***
(0.021)
0.244***
(0.066)
Hotels – – – – -0.798***
(0.033)
0.251***
(0.082)
R2 0.014 0.203 0.271
F statistic 37.94*** 295.41*** 239.57***
Test for Welsh variable collective deletion
14.19*** 16.06*** 4.19***