Schmidt-hammer exposure ages from periglacial patterned ground (sorted circles) 1
in Jotunheimen, Norway, and their interpretative problems 2
3
Stefan Winkler1, John A. Matthews2, Richard W. Mourne3 and Peter Wilson4 4
5
1 Department of Geological Sciences, University of Canterbury, Christchurch, New 6
Zealand 7
2 Department of Geography, Swansea University, Swansea, U.K. 8
3 Department of Geography and Environmental Management, University of the West of 9
England, Bristol, U.K. 10
4 Environmental Sciences Research Institute, Ulster University, Coleraine, U.K. 11
12
13
Abstract 14
Periglacial patterned ground (sorted circles and polygons) along an altitudinal profile at 15
Juvflya in central Jotunheimen, southern Norway, is investigated using Schmidt-hammer 16
exposure-age dating (SHD). The patterned ground surfaces exhibit R-value distributions 17
with platycurtic modes, broad plateaus, thin tails, and a negative skew. Sample sites located 18
between 1500 and 1925 m a.s.l. indicate a distinct altitudinal gradient of increasing mean 19
R-values towards higher altitudes interpreted as a chronological function. An established 20
regional SHD-calibration curve for Jotunheimen yielded mean boulder exposure ages in the 21
range 6910 ± 510 to 8240 ± 495 years ago. These SHD ages are indicative of the timing of 22
patterned ground formation, representing minimum ages for active boulder upfreezing and 23
maximum ages for the stabilization of boulders in the encircling gutters. Despite 24
uncertainties associated with the calibration curve and the age distribution of the boulders, 25
the early-Holocene age of the patterned ground surfaces, the apparent cessation of major 26
activity during the Holocene Thermal Maximum (HTM) and continuing lack of late-Holocene 27
activity, clarify existing understanding of the process dynamics and palaeoclimatic 28
significance of large-scale sorted patterned ground as an indicator of a permafrost 29
environment. The interpretation of SHD ages from patterned ground surfaces remains 30
challenging, however, owing to their diachronous nature, the potential for a complex history 31
33
Keywords 34
Sorted circles, periglacial patterned ground, alpine permafrost, Schmidt-hammer 35
exposure-age dating (SHD), RockSchmidt, Holocene climatic variations, Jotunheimen 36
37
38
Introduction 39
40
During the past few decades the Schmidt hammer has been applied to estimating the age 41
of landforms of periglacial, glacial, and mass movement origin such as rock glaciers 42
(Frauenfelder et al. 2005; Kellerer-Pirklbauer et al. 2008; Rode and Kellerer-Pirklbauer 43
2011; Matthews et al. 2013), pronival ramparts (Matthews et al. 2011; Matthews and Wilson 44
2015), snow-avalanche impact ramparts (Matthews et al. 2015), moraines (Matthews and 45
Shakesby 1984; Evans et al. 1999; Aa and Sjåstad 2000; Winkler 2005, Ffoulkes and 46
Harrison, 2014), rock fall/avalanches (Nesje et al. 1994; Aa et al. 2007), fluvial terraces 47
(Stahl et al. 2013) and boulder streams (Wilson et al., submitted). Initially it was used only 48
as a relative-age dating technique based on the principle of relating compressional strength 49
of a bedrock or boulder surface to its degree of surface weathering and, hence, its exposure 50
age (McCarroll 1994; Goudie 2006; Shakesby et al. 2006). Subsequent improvement during 51
the last 10 years has seen the combination of Schmidt-hammer relative-age dating with 52
absolute dating techniques, in particular TCND (terrestrial cosmogenic nuclide dating; 53
Winkler 2009), and the development of Schmidt-hammer exposure-age dating (SHD), which 54
enables the calculation of local or regional calibration curves and provides absolute age 55
estimates for the landforms investigated (Matthews and Owen 2010; Matthews and Winkler 56
2011; Shakesby et al. 2011; Matthews and McEwen 2013; Stahl et al. 2013; Winkler 2014). 57
The Schmidt hammer has also been used in integrated, multi-proxy approaches to dating 58
(e.g. Böhlert et al. 2011). Apart from the predominant chronological and 59
palaeoenvironmental applications, Schmidt-hammer data may also reveal valuable 60
information about the formation processes and dynamics of the landforms investigated, for 61
example rock glaciers (Scapozza et al. 2014) and snow-avalanche impact ramparts 62
(Matthews et al. 2015). 63
Unlike those typical high mountain landforms mentioned above, periglacial patterned ground 65
has not yet been subjected to detailed investigated in the context of SHD. Cook-Talbot 66
(1991) used Schmidt-hammer R-values in her relative-age evaluation of patterned ground 67
in the Glittertinden massif of eastern Jotunheimen, southern Norway, but did not produce 68
exposure ages. Calibrated-age estimates of exposure ages of clasts within patterned ground 69
surfaces potentially provide insights into the processes and dynamics of sorted patterned 70
ground formation as well as their chronology by revealing, for example, for how long the 71
majority of clasts have been exposed at the surface or when the clast-rich margins were 72
established or became inactive (see, for example, Washburn 1956, 1979; Goldthwait 1976; 73
French 1988, 2007; Hallet 1990, 2015; Kessler et al. 2001; Matsuoka et al. 2003; Peterson 74
and Krantz 2008; Ballantyne 2013; Warburton 2013, for more details of patterned ground 75
formation and its classification). 76
77
A well-known, previously described and mapped occurrence of patterned ground on the 78
Juvflya plateau in central Jotunheimen, southern Norway, has been selected as a test area 79
(Ødegård et al. 1987, 1988). Various types of sorted patterned ground (circles, polygons, 80
nets, steps and stripes) occur in this area over an altitudinal range of ~ 1950-1500 m a.s.l. 81
extending down towards the relatively gently-dipping upper slopes of Bøverdalen and 82
Visdalen to the north and east, respectively. Supporting the selection of this particular test 83
area is the availability of information about regional permafrost limits (Ødegård et al. 1992, 84
1996; Isaksen et al. 2002, 2011; Harris 2009; Lilleøren and Etzelmüller 2011; Lilleøren et al. 85
2012) and an established chronology of regional deglaciation and Holocene climate 86
variability (Follestad and Fredin 2007; Matthews and Dresser 2008; Nesje et al. 2008; Nesje 87
2009). Furthermore, regional (Matthews and Owen 2010) and local (Matthews et al. 2014) 88
calibration curves for SHD are available without the necessity to obtain additional local 89
samples for terrestrial cosmogenic nuclide dating (TCND) or other independent dating 90
techniques. 91
92
This first study of the potential of SHD in the context of patterned ground was carried out 93
under the reasonably well understood environmental conditions of central Jotunheimen. It 94
has the following specific objectives: 95
(a) To describe the characteristics of Schmidt-hammer measurements obtained from 96
from other landforms, especially those characterised by diachronous surfaces or long-term, 98
continuous formation processes (e.g. rock glaciers and pronival ramparts). 99
(b) To investigate whether Schmidt-hammer measurements associated with sorted circles 100
exhibit variations between sites located at different altitudes, and interpret any altitudinal 101
gradient detected with reference to the timing of deglaciation, rates of rock weathering, 102
periglacial processes, and climate. 103
(c) To apply regional and local SHD calibration curves, and hence obtain absolute-age 104
estimates, for the boulder surfaces, determine the active or relict status of the sorted circles, 105
and interpret the landforms in the light of existing palaeoclimatic evidence and current 106
understanding their dynamics. 107
108
109
Study area 110
111
The study area, Juvflya, is a small high-level plateau typical of the southern Norwegian 112
mountain area of central Jotunheimen (Figure 1). These plateaux are usually related to a 113
pre-glacial ‘paleic surface’ (Gjessing 1978; Nesje and Whillans 1994) and contrast sharply 114
with the surrounding deeply-incised valleys and the overshadowing mountain peaks and 115
cirques of Pleistocene origin (Figure 2a). The central part of Juvflya constitutes flat to gently 116
sloping terrain of some 8 – 10 km2 at an altitude between 1850 and 1950 m a.s.l. (Figure 117
2b). Towards the edge of the plateau, there is a transition towards the upper slopes of 118
Bøverdalen to the north (Figure 2a) and Visdalen to the east with gradually increasing slope 119
angles but also several small ‘benches’ of flatter terrain (e.g. Dugurdsmålkampen and 120
Svartkampan). 121
122
A variety of patterned ground features dominate the surface of Juvflya, the benches and the 123
adjacent transitional upper valley slopes (Figures 2c, d). Between 1750 and 2000 m a.s.l. 124
Ødegård et al. (1987, 1988) report a 15 – 50 % surface cover of patterned ground at slope 125
angles less than 10°. Whereas they show the flat terrain is dominated by sorted circles and 126
sorted polygons, sorted stripes and boulder tongues dominate where slope angles are 127
between 3 and 17°. Sorted steps are reported from slopes between 2 and 11° but as 128
(substrate), vegetation, soil moisture content etc. – make it difficult to relate specific 130
patterned ground features to specific slope angle thresholds. 131
132
The study was restricted to sorted circles and polygons (simplifying the term “sorted nets 133
and polygons” used by Ødegård et al. 1988) on flat terrain. This decision was primarily driven 134
by the fact that sorted stripe dynamics are affected by slope-related processes that 135
potentially complicate any interpretations of landform age and origins (Harris 1988; French 136
2007; Feuillet et al. 2012). An isolated occurrence of patterned ground at 1500 m a.s.l. was 137
selected as the lower end of an altitudinal profile that includes an additional four sites at 138
altitudes of 1550, 1750, 1850 and 1925 m a.s.l. respectively (Figure 1). The diameters of 139
the fine-grained centres of the sorted circles at the study sites usually vary between 2 to 4 140
m and are encircled by coarse (stone) gutters filled with clasts with an average long axis 141
between 30 and 80 cm (Figures 2e,f). The width of the gutters between the fine-grained 142
centres at most sites range between 1 and 2 m. The diameters of individual sorted circles 143
are therefore up to about 6 m and rarely less than 3m. Individual boulders within the gutters 144
may project above the fine-grained circles by 10 – 30 cm (never > 50 cm). The widest gutters 145
commonly exhibit a depth of a few tens of cm. 146
147
At the lower two sites, the fine centres tend to be covered by mid-alpine tundra-like 148
vegetation and the boulders are heavily covered by a variety of lichen species. The sorted 149
circles at these two sites are therefore clearly relict. Although their centres have a sparser 150
cover of high-alpine species, the patterned ground at the higher altitude sites also appear to 151
be relict (cf. Ødegård et al. 1992) with little evidence of recent cryoturbation disturbing the 152
boulder distribution. With the exception of a small area around Juvasshøi, all the patterned 153
ground below about 2000 m a.s.l. has developed in till (Ødegård et al. 1987; see below), 154
155
A meteorological station at Juvasshøi (1894 m a.s.l.) reports a average mean annual air 156
temperature (MAAT) of 3.5°C for the period AD 2000 to 2014 with annual variability ranging 157
from 2.49°C (2014) to 5.37°C (2010; eKlima data base by met.no). Ødegård et al. (1992) 158
calculated a MAAT of 2.6°C at 1500 m a.s.l. to 6.4°C at 2200 m a.s.l. These data 159
correspond quite well to the 1km-grided MAAT normals (1971 – 2000) between 2.0 and 160
4.0°C given for our five study sites by the SeNorge data base (met.no). Ødegård et al. 161
a borehole near Juvasshytta and gave additional data for shallow MAGT from 163
Dugurdsmålkampen (0,7°C), Galdehøi (4.2 to 4.4°C) and a site near Juvvatnet, the lake 164
close to Vesle-Juvbreen (1.7 to 1.9°C). They also mention strong winds typical for Juvflya 165
resulting in little snow cover and a (late) maximum snow depth of 0.5 m in May. During field 166
work for this study in late July 2015, all of Juvflya was largely snow-free whereas in most 167
other parts of central Jotunheimen the terrain above about 1200 m a.s.l. retained snow-168
cover after a snowy winter and an unusual cold spring season. Isaksen et al. (2011) give 169
800 to 1000 mm as mean annual precipitation (MAP) for the Galdhøpiggen area including 170
Juvflya. 171
172
A number of studies have concluded that the lower limit of discontinuous permafrost in 173
Jotunheimen lies at about 1450 m a.s.l. (Ødegård et al. 1992, 1996; Isaksen et al. 2002, 174
2011; Farbrot et al. 2011, Lilleøren et al., 2012). Ødegård et al. (1987) report an active layer 175
thickness of 1.5 – 2.0 m for the central Juvflya area, which is similar to the range of 1.95 – 176
2.45 m annual thickness reported by Harris et al. (2009) from recent borehole monitoring. 177
178
Central Jotunheimen has been at or near the culmination centre/ice divide of the Late 179
Weichselian Scandinavian ice sheet (Mangerud et al. 2011). As a consequence, the study 180
area experienced a relative late deglaciation and the till in which the patterned ground has 181
been developed is of local origin. The exact date when Juyflya and the upper slopes of 182
Bøverdalen and Visdalen became ice-free has not precisely been determined, but an early 183
Holocene (Preboreal) deglaciation with a date of c. 9,700 cal. yr BP seems very likely. This 184
is consistent with deglaciation following the Erdalen Event in the late Preboreal (Dahl et al. 185
2002; Matthews and Dressser 2008; Nesje 2009; Stroeven et al. 2015) and is supported by 186
the size of the well-developed sorted circles (Cook-Talbot 1991; Falch 2001) and recent 187
permafrost studies (Lilleøren et al. 2012). Owing to its wind-exposed, leeward position in 188
relation to a dominant westerly air flow and in the light of some studies from the more 189
continental part of southern Norway (Dahl et al. 1997; Lie et al. 2004) it cannot completely 190
be excluded that ice-free conditions prevailed slightly earlier. A previous deglaciation model 191
of the region predicted, however, a middle- to late-Preboreal deglaciation (Sollid and 192
Trollvika 1991; Holmsen 1982; Sollid and Reite 1983). 193
Our study sites are located in the central part of Jotunheimen, on rocks of the early-195
Proterozoic Jotunheimen complex, which is dominated by pyroxene-granulite gneiss (Lutro 196
and Tveten 1996). This local bedrock type is also the predominant lithology of the till in which 197
the patterned ground has developed at our study sites. A few boulders of different lithology 198
do, however, occur within the till; for example peridotites that crop out in small areas 199
throughout Jotunheimen. They develop a distinct reddish-rusty surface colour when 200
exposed to subaerial weathering and were easily detected and avoided during Schmidt-201
hammer testing. Furthermore, lithological and mineralogical heterogeneity within the 202
pyroxene-granulite gneiss has not previously limited the application of Schmidt-hammer 203
calibration curves in the region (Matthews and Owen 2010; Matthews and Winkler 2011). 204
205
206
Methods 207
208
Schmidt-hammer measurements were performed at all five sites covering the altitudinal 209
range from 1500 to 1925 m a.s.l. (see Figure 1). Tests were restricted to boulders in the 210
coarse gutters of the sorted circles (the fine-grained centres being free of larger clasts with 211
very few exceptions). Gutters were randomly sampled from every suitable boulder (central 212
gutter depressions as well as gutter edges). This sampling design was consistently applied 213
to all sites and Schmidt hammer impacts were made on horizontal or near-horizontal upper 214
surfaces of boulders. Thus, spatial or seasonal variation in snow distribution, depth or 215
duration (and hence long-term weathering rate) are unlikely to have affected the data. 216
Between 190 and 260 individual boulders were tested with one impact each at all sites using 217
mechanical N-type Schmidt hammers with an impact energy of 2.207 Nm for the plunger 218
(Proceq 2004; see also Shakesby et al., 2006 for more technical details). The instruments 219
were tested on a manufacturer’s test anvil prior to and after the measurements to ensure 220
proper calibration. All tests were performed on lichen-free areas, avoiding any visible cracks 221
or weaknesses in the boulder surfaces. The requirement of boulders not to move during 222
impacts restricted tests to those with a minimum long axis of 40 cm, but those were 223
numerous and randomly distributed through the gutters. The sparsity of much larger 224
boulders did, however, prevent the application of any test design involving multiple impacts 225
on each boulder. 226
The data from each test site were treated as a homogeneous sample. Sample mean 228
R(Rebound)-values and their 95 % confidence intervals ( = 0.05) were calculated using the 229
equation: 230
± ts/√(n-1) (1)
231
where = arithmetic mean, s = sample standard deviation, t = Student’s t statistic, and n = 232
number of impacts (sample size) following Shakesby et al. (2006). Because each area of 233
sorted circles was expected to resemble a diachronous rather than a single-age or 234
synchronous surface (i.e. with a considerable spread of exposure ages as revealed by their 235
R-values), detailed histograms were produced for all sites for further interpretation. Standard 236
statistical analysis of R-values included Kolmogorov-Smirnov tests for normality and Mann-237
Whitney or Kruskal-Wallis ANOVA tests of differences between sites (cf. Schönwiese 1992; 238
Sachs 1999; Lehman 2002) using IBM SPSS Statistics software. The statistical significance 239
of the differences between sites using nonparametric analysis of variance (ANOVA) is 240
appropriate even if samples exhibit non-normal distributions (Sachs 1999). Whereas the 241
Mann-Whitney U-test was used to test pairs of samples, the Kruskal-Wallis H-test was 242
applied simultaneously to three or more samples following standard recommendations 243
(Sachs 1999; Lehmann 2002). 244
245
At sites 2 – 4, additional Schmidt-hammer testing was carried out using the newly introduced 246
electronic N-type RockSchmidt, which has identical impact energy as the mechanical N-type 247
Schmidt hammer (Proceq 2014). The RockSchmidt is basically an improved version of the 248
electronic SilverSchmidt (Proceq 2012; see also Viles et al. 2011) designed for rock testing 249
with more specified software and technical improvements, such as a tighter seal of the 250
impact plunger. A larger sample size (750 boulders) was used at each site, again with one 251
impact per boulder, using the same criteria for boulder selection and raw data processing 252
as for the mechanical Schmidt hammer. Although the R-values obtained with the electronic 253
and mechanical Schmidt hammers are not identical for technical reasons, their results have 254
been shown to be interconvertible (Winkler and Matthews 2014). For this study, no 255
conversion has been considered. Instead, the results are presented separately, the 256
measurements being differentiated by use of the terms ‘R-values’ and ‘RRock-values’ for the 257
mechanical hammer and the RockSchmidt, respectively. 258
At three locations as near as possible to sites 2, 3, and 4, boulders in fresh road cuts along 260
the access road to Juvasshytta were also measured with the mechanical Schmidt hammer. 261
At these sites, 10 boulders with a non-weathered, fresh appearance were selected with the 262
aim of testing the suitability of the ‘young’ control points (unweathered rock surfaces of zero 263
age) used for calibration of R-values and the production of SHD ages. In order to obtain 264
approximate R-values for non-weathered rock surfaces with the same lithology as boulders 265
in the patterned ground, five impacts from the same spot were recorded on each boulder. 266
Following procedures from engineering geological rock testing (Poole and Farmer 1980; 267
Aoki and Matsukura 2007), the fifth impact was used as an approximation to the R-value of 268
non-weathered rock surfaces (see also, Matthews et al., 2016). 269
270
The lack of stable boulders of known age that are sufficiently old for use as an ‘old’ control 271
point, alongside the possible limitations of the boulders from the road cuts as a ‘young’ 272
control point (see below), mean that it has not proved possible to calculate a new local 273
calibration curve for boulders on Juvflya. Instead, two established calibration curves were 274
initially applied: the local Vesl-Juvbreen curve (Matthews et al. 2014) and the regional 275
Jotunheimen curve (Matthews and Owen, 2010). Dating the mean exposure ages of the 276
boulders from the sample sites by using these existing SHD-calibration curves is quite 277
challenging due to uncertainties in their applicability to the specific rock surfaces and 278
environmental conditions that characterize the sorted circles. 279
280
In principle, the local Vesl-Juvbreen calibration curve (Matthews et al. 2014) would be 281
expected to be the more appropriate of the two curves, because of the proximity of its control 282
point locations to the patterned ground sites and hence the closely similar lithology of its 283
control points. This curve is defined by the equation: 284
y = 28749.610 – 500.77841x (2)
285
where y = surface age in years and x = mean R-value 286
The ‘young’ control point for this curve was derived from unweathered, recently deposited 287
boulders on the glacier foreland of Vesl-Juvbreen, whereas the ‘old’ control point was 288
derived from a rare bedrock outcrop outside the glacier foreland. 289
The regional Jotunheimen calibration curve of Matthews and Owen (2010) is defined by the 291
equation: 292
y = 22986.956 – 347.82608x (3)
293
This curve is based on the same general lithology as the patterned ground sites (pyroxene-294
granulite gneiss) but its ‘young’ and ‘old’ control point were both derived from glacially-295
scoured bedrock outcrops from lower altitudinal zones. The main grounds for regarding the 296
regional Jotunheimen curve as applicable to the boulder surfaces associated with the sorted 297
circles are: (1) the generally similar pyroxene-granulite gneiss bedrock throughout the 298
region; and (2) similarity in roughness characteristics between glacially-scoured bedrock 299
surfaces and glacially-abraded boulder surfaces, which are likely to produce similar R-300
values after prolonged weathering. See below for further discussion of the appropriateness 301
of the two calibration curves. 302
303
Confidence intervals around the predicted SHD ages reflect the total error (Ct), which 304
combines the calibration error of the calibration curve (Cc) with the sampling error of the 305
patterned ground (Cs) (Matthews and Winkler 2011): 306
307
Ct = √ (Cs2 + Cc2) (4)
308
309
Cc is derived from the confidence intervals associated with the old control point (Co) and the 310
young control point (Cy), where Ro, Ry and Rs are the mean R-values of the old control point, 311
the young control point and the sampled patterned ground, respectively (Matthews and 312
McEwen 2013): 313
314
Cc = Co – [(Co – Cy)(Rs – Ro)/(Ry – Ro)] (5)
315
316
Csis derived from the slope of the calibration curve (b), Student’s t statistic and the standard 317
error of the mean R-value of the patterned ground, where s is the standard deviation and n 318
is the sample size (Matthews and Owen 2010): 319
320
Cs = ± b [ts/√(n-1)] (6)
322
Finally, 450 individual boulders were sampled from each of sites 2, 3 and 4 for their clast 323
roundness following the visual comparison method of Powers (1953). The aim was to 324
investigate possible sedimentological differences in the substrate where the patterned 325
ground has developed. Clast roundness differences between the sites were analysed 326
graphically using histograms and compared quantitatively using a numerical index of mean 327
roundness (ir) based on assigning a numerical value to each roundness class (very angular, 328
0.5; angular, 1.5 … to well rounded, 5.5; cf. Powers 1953; Matthews 1987; Tucker 1988). 329
330
331
Results 332
333
The statistical distribution of R-values and RRock-values 334
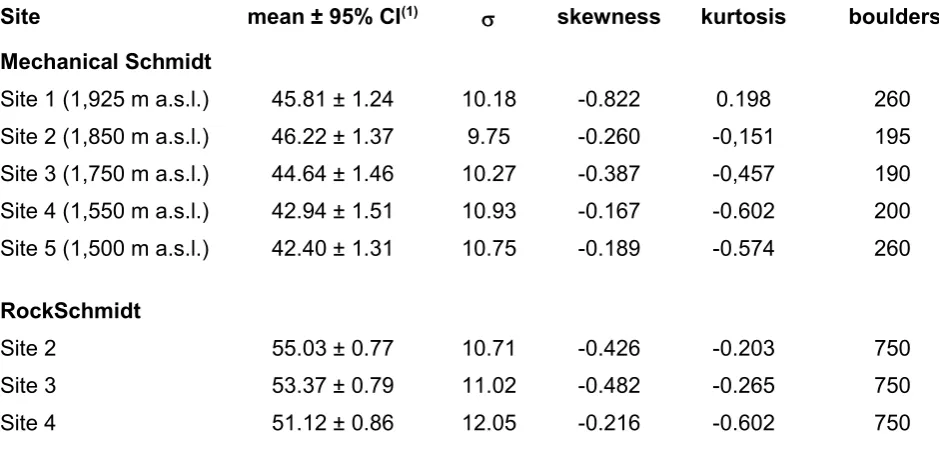
R- and RRock-values from all sites tested are presented as histograms (Figures 3 and 4) as 335
well as numerical parameters (Figure 5, Table 1). R-values from the mechanical Schmidt 336
hammer and RRock-values obtained by the RockSchmidt are highly comparable in terms of 337
relative differences between sites, the overall trend, and most other parameters, but the 95 338
% confidence intervals for the RRock-values are narrower due to the larger sample size. The 339
histograms from both instruments have the same form, confirm the interconvertibility of 340
mechanical and electronic Schmidt-hammer data when allowance is made for the offset in 341
mean values (cf. Winkler and Matthews 2014), and justify SHD using the established 342
calibration curves based on R-values (see below). 343
344
Visual inspection of the histograms reveals differences from those typical of Schmidt-345
hammer measurements from landforms characterized by synchronous rock surfaces, such 346
as moraines, which usually display symmetrical, unimodal, normal distributions (Matthew 347
and Shakesby 1984; Winkler 2014). The histograms from the patterned ground resemble 348
platykurtic distributions with wide plateaus and thin tails, negative skew and (at all but site 349
1) negative kurtosis. Three of the mechanical Schmidt hammer data sets (sample sites 1, 3, 350
and 4) and all three RockSchmidt data sets do not pass one-sample Kolmogorov-Smirnov 351
and Shapiro-Wilk tests of normality. Furthermore, it should be noted that the asymmetry of 352
the number of values at the lower end of the measured range clearly decreases. The non-354
normal distributions, their characteristic shape, and the absence of any clear bi- or 355
polymodal pattern, can all be related to the process of formation of sorted circles and 356
polygons and the exposure of individual clasts to subaerial weathering for varying periods 357
of time (see discussion below). 358
359
The altitudinal gradient in R-values and RRock-values 360
Mean R- and RRock-values exhibit an increase with altitude and a strong linear trend (Figure 361
6). However, the 95 % confidence intervals associated with particular sample sites exhibit 362
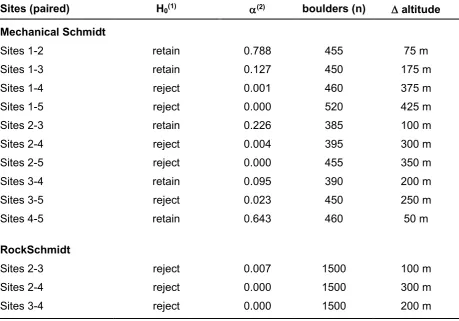
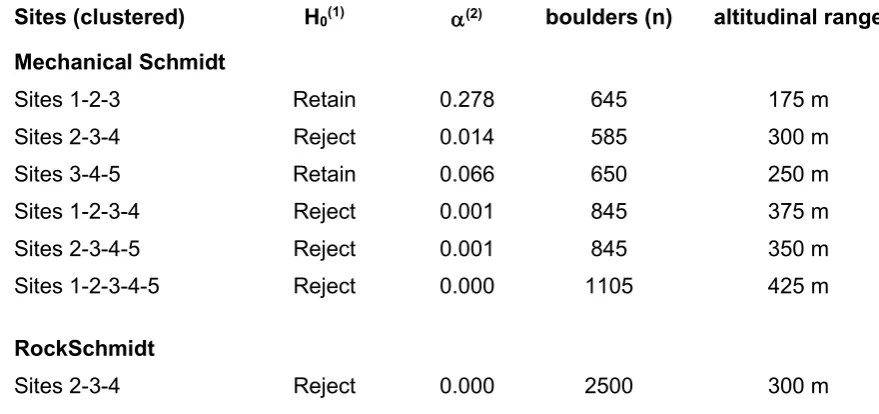
partial overlap (Table 1, Figure 6). The results for the RockSchmidt are unequivocal, with 363
each pair of samples and also the three samples together showing statistically significant 364
differences between their respective distributions (Tables 2 and 3). In contrast, some sample 365
pairs and two tests involving three samples from the mechanical Schmidt hammer indicate 366
differences that are not statistically significant, especially if those sites are within a limited 367
altitudinal range. In fact, all tests which involve sites differing in altitude by 250 m or more 368
exhibit statistically significant differences in their R-value distributions (Table 2). 369
370
The road-cut data 371
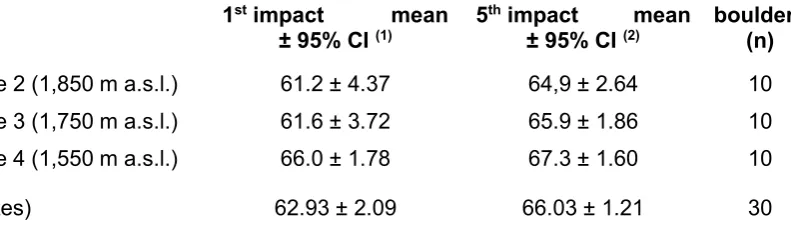
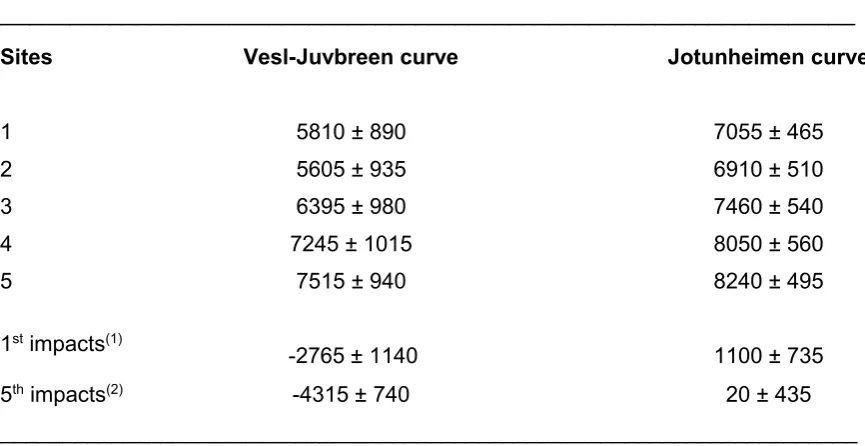
The results from the road cuts are shown in Table 4. For first impacts, overlapping 372
confidence intervals indicate that none of the mean R-values are statistically significantly 373
different. Thus, the three data sets based on first impacts can legitimately be combined to 374
produce the single overall mean R-value of 62.93 ± 2.09. Similar reasoning for fifth impacts 375
leads to an overall mean R-value of 66.03 ± 1.21, which is significantly higher than the 376
overall mean value of the first impacts and therefore the more realistic approximation to the 377
mean R-value of unweathered boulders in the sorted polygons. Nevertheless, owing to the 378
small sample of road-cut boulders, these results should be treated with caution. 379
380
SHD ages 381
SHD results from application of the local (Vest-Juvbreen) and regional (Jotunheimen) 382
calibration curves are shown, together with tests of their efficacy against the ‘young’ road-383
cut data, in Table 5 where all dates are rounded to the nearest 5 years. SHD ages from all 384
8240 ± 495 and 6910 ± 510 years (Jotunheimen curve). It should be noted that the SHD 386
ages (mean boulder ages) predicted by both curves exhibit a decrease with altitude. This 387
age gradient of ~1900 and ~1300 years, respectively, over the ~400 m altitudinal range of 388
the sites results from the increase in mean R-value with altitude previously demonstrated in 389
Table 1 and Figures 5 and 6. Although none of the mean boulder ages derived from the 390
Vesl-Juvbreen calibration curve are statistically different according to their relatively broad 391
confidence intervals, the narrower confidence intervals associated with the predictions from 392
the Jotunheimen curve yield several statistically significant differences between the 393
uppermost and lowermost sites (Figure 7). 394
395
Testing of the two calibration curves against the ‘young’ road cut data interestingly reveals 396
contrasting results (Table 5). Using the Vesl-Juvbreen curve, the unweathered boulders are 397
predicted to have futuristic SHD ages of –2765 ± 1140 years based on first-impact data and 398
–4315 ± 740 years based on fifth impacts. These age estimates deviate widely from the 399
expected result of zero age. In contrast, the Jotunheimen curve predicts SHD ages of 1100 400
± 735 years based on first impacts and only 20 ± 435 years based on fifth impacts. Thus, 401
only the Jotunheimen curve in combination with fifth-impact data successfully predicts the 402
zero age of the road-cut boulders. 403
404
At each of the five sites, moreover, the differences in the estimated mean SHD ages using 405
the two curves decreases with altitude from 1305 years for site 2 to 725 years at site 5 (Table 406
5). Errors in estimating the true exposure age of the boulders in the sorted circles are 407
therefore unlikely to be as great as the underestimates of ~3000–4000 years for the boulders 408
in the road cuts derived from the Vesl-Juvbreen calibration curve. The differences of ~700– 409
1300 years in the predicted SHD ages between the two curves are, moreover, almost wholly 410
the result of differences in the R-values associated with their ‘young’ control points. This 411
must be the case because the mean R-values of the ‘old’ control points for the Jotunheimen 412
and Vesl-Juvbreen curves are almost identical: 38.20 ± 0.56 and 38.04 ± 1.43, for the 413
Jotunheimen and Vesl-Juvbreen curves, respectively, whereas the mean R-values of the 414
‘young’ control points are 65.80 ± 0.33 and 57.31 ± 1.03, respectively (Matthews and Owen 415
2010; Matthews et al. 2014). These test results suggest, therefore, that the Jotunheimen 416
curve is by far the better of the two calibration curves for estimating the exposure ages of 417
419
Clast (boulder) roundness 420
Results of clast roundness measurements are plotted on Figure 8 and show no significant 421
differences between sites. All samples display a sub-angular mode with considerable 422
quantities of sub-rounded and angular clasts but hardly any very angular clasts. Site 4 (at 423
1550 m a.s.l.) has the lowest ir index but there is no altitudinal trend as site 3 (at 1750 m 424
a.s.l.) reveals the highest ir index. The sub-angular mode of the surface material coincides 425
roughly with what is expected for tills in mountain environments (Evans and Benn 2004; 426
Lukas et al. 2013), perhaps with some local effects resulting from the limited availability of 427
rock outcrops and supraglacial debris, which could provide sources of very angular boulders. 428
429
430
Discussion 431
432
Methodological considerations 433
Testing both calibration curves against the road-cut boulders demonstrates that it is the 434
young control point used to construct the Jotunheimen curve that renders this curve 435
preferable to the Vesl-Juvbreen curve in the context of SHD dating of the patterned ground 436
landforms at Juvflya. This interpretation is based on the more accurate prediction of the age 437
of the road-cut boulders by the Jotunheimen curve than the Vesl-Juvbreen curve (see 438
above). The reason for this lies in the nature of the boulder surfaces. The boulders in the 439
sorted circles and the boulders in the road cuts are derived from a similar till substrate and 440
are subangular to subrounded (Figure 8). Such boulders have been glacially abraded 441
(Boulton 1978; McCarroll 1991; Shakesby et al. 2006; Lukas et al. 2013) and are therefore 442
relatively smooth compared to the relatively rough angular and subangular boulders 443
characteristic of the young control point used in construction of the Vesl-Juvbreen calibration 444
curve (Matthews et al., 2014). In contrast, the boulders in the road cuts and the sorted circles 445
both yield relatively high mean R-values that are numerically similar to those derived from 446
the glacially-abraded bedrock used in construction of the Jotunheimen calibration curve 447
(Matthews and Owen 2010). 448
Furthermore, the fifth-impact mean R-value from the road cuts (66.03 ± 1.21; Table 4) is 450
numerically very close to the mean R-value of the young control point used in the regional 451
Jotunheimen curve (65.80 ± 0.33; Matthews and Owen 2010). The fact that the difference 452
between the means of the first and fifth impacts is appreciable (though not quite a statistically 453
significant difference according to the 95 % confidence intervals; Table 4) indicates, 454
however, that there has been some weathering of the boulder surfaces in the road cuts 455
despite their recent excavation. Matthews et al. (2016) has shown that the difference 456
between the mean values of the first and fifth impacts of unweathered abraded rock surfaces 457
of this rock type should be negligible. The road cut data themselves do not therefore appear 458
to provide suitable boulders for use as young control points, most likely due to subsurface 459
weathering of boulder surfaces that were buried at shallow depth for most of the Holocene 460
prior to their excavation during construction of the road cuts. 461
462
Thus, only the Jotunheimen calibration curve can be regarded as yielding meaningful SHD 463
ages from the sorted circles. Our results demonstrate, moreover, some of the interpretive 464
problems associated with dating these asynchronous land surfaces. 465
466
SHD ages in relation to the dynamics of sorted circles 467
The interpretation of SHD ages from patterned ground is far from straightforward. Whereas 468
the boulder exposure ages of synchronous landforms, such as moraines and till sheets, can 469
be clearly related to a single time of formation, the mean boulder exposure age of 470
asynchronous landforms, such as sorted circles, are much more likely to be affected by a 471
relatively long history of development and such factors as inheritance and post-depositional 472
disturbance. 473
474
The starting point for sorted circle formation on Juvflya is assumed to be a till sheet of 475
heterogenic grain-size distribution exposed during deglaciation in the late Preboreal,~9700 476
years ago. In theory, the oldest boulder exposure ages should therefore coincide with 477
deglaciation as a number of boulders would by exposed on the surface of this till deposit. 478
With the process of patterned ground formation mainly related to active layer dynamics 479
above permafrost (Washburn 1956; French 1988) it is likely to have started immediately 480
after local deglaciation (Lilleøren et al. 2012). The significant difference in age of at least 481
according to the Jotunheimen calibration curve is consistent with an appreciable time lag 483
between deglaciation and stabilization of these features. 484
485
Although some aspects of the detailed mechanics of sorted circle formation are still not fully 486
resolved, upfreezing and lateral frost sorting of boulders are the main processes to be 487
considered when interpreting boulder exposure ages (cf. Washburn 1979; Mackay 1984; 488
Williams and Smith 1989; Hallet 1990, 2015; Van Vliet-Lanoë 1991; Ballantyne and Harris 489
1994; Kessler et al. 2001; French 2007; Kääb et al. 2014). Upfreezing, involves boulders 490
that were previously buried below the surface becoming exposed to subaerial weathering. 491
Subsequent lateral frost sorting (migration of boulders towards the coarse zones encircling 492
the fine centres) may involve the boulders being tilted or rotated (Kääb et al. 2014) prior to 493
their deposition and stabilization as they wedge together. Both upfreezing and lateral frost 494
sorting can occur quite fast, resulting in the formation of well developed patterned ground 495
within a few decades (Ballantyne and Matthews 1982; Harris 1988; Haugland 2004, 2006). 496
However, given a thick till cover with a plentiful boulder content, and suitable environmental 497
conditions, formation may take much longer. 498
499
The mean boulder exposure age of the sorted circles is therefore considered to be primarily 500
indicative of the timing of the upfreezing process and the stabilization of the coarse gutters, 501
provided there was no postdepositional remobilisation of the boulders by the convection-like 502
circulation that characterises the active layer (cf, Hallet 1990, 2015; Kessler et al. 2001). 503
Today, frost disturbance of this type seems to be restricted to the fine-grained centres, which 504
are characterised to a greater or lesser extent by patches of bare ground that sometimes 505
exhibit nested smaller-scale patterned ground forms. In contrast, the boulders are almost 506
completely lichen covered with no evidence of recent movement. Accepting that post-507
exposure modification involving boulders is likely to have been unimportant, the mean 508
boulder exposure age of the investigated sorted circles should simultaneously indicate the 509
timing of (1) the most active upfreezing, and (2) the final stabilization of boulders in the 510
coarse gutters. 511
512
Platycurtic R-value distributions (Figures 3 and 4) and the corresponding wide confidence 513
intervals associated with the SHD ages (Table 5, Figure 8) are consistent with a relatively 514
synchronous land surfaces, such as moraines (Matthews and Winkler 2011; Winkler 2014), 516
the peak plateau is very wide. Schmidt-hammer measurements on rock glaciers also display 517
much narrower R-value distributions related to talus entrainment (Frauenfelder et al. 2005; 518
Kellerer-Pirklbauer et al. 2008; Rode and Kellerer-Pirklbauer 2011). R-value distribution 519
from relatively inactive pronival ramparts exhibit somewhat broader plateaus (Matthews and 520
Wilson 2015), as do long-active avalanche-impact ramparts (Matthews et al. 2015). Only 521
those distributions presented by Matthews et al. (2014) from ice-cored moraines are 522
comparable to our distributions from patterned ground, however. 523
524
The rather thin tails towards higher R-values as shown on Figures 3 and 4 support the largely 525
relict status of the sorted circles, and the lichen-encrusted nature of the boulders correspond 526
well with the ‘fossil’ appearance of the sorted forms on Juvflya mentioned by Ødegård et al. 527
(1992). Relict status is also supported by the size of these large sorted forms relative to 528
recently active features, which are much smaller (cf. Ballantyne and Matthews 1982; Cook-529
Talbot 1991; Haugland 2004). Limited recent active dynamics of the patterned ground may 530
seem inconsistent with the evidence presented by Lilleøren et al. (2012) for the continuous 531
existence of mountain permafrost above 1650 – 1700 m in this region throughout the 532
Holocene (see below). With modern permafrost occurrence confirmed for all our sites (see 533
above), the possible reasons for the lack of recent dynamics may, in theory, be related one 534
or more of the following: (a) a decrease of moisture supply within the active layer 535
(Vandenberghe 1988; Van Vliet-Lanoë 1988, 1991; Luoto and Hjort 2004); (b) a change of 536
average freezing rates and/or orientation of the freeze-thaw plane (with slow freezing rates 537
in saturated soils reported as most conducive to upfreezing by Van Vliet-Lanoë 1991); (c) a 538
decrease in frost susceptibility of the surface material (Ødegård et al. 1988, mention that the 539
quantity of fines may not be sufficient to support active frost processes); or (d) exhaustion 540
of boulders from the subsurface of the fine-grained centres. The tail on the other end of the 541
distribution towards lower R-values can easily be explained by the presence of boulders 542
exposed shortly after deglaciation or, less likely, inherited from pre-exposure weathering. 543
544
The Holocene history of the patterned ground in relation to permafrost 545
Whereas small patterned ground features do not require permafrost (Goldthwaite, 1976; 546
Grab, 2002; French 2007; Ballantyne, 2013), and have been demonstrated in Jotunheimen 547
(Harris and Cook 1988; Matthews et al. 1998; Haugland 2006), the size of the patterned 549
ground features on Juvflya are consistent with formation within the active layer of underlying 550
permafrost. Permafrost conditions became established in the area soon after deglaciation 551
in the early Holocene (Lilleøren et al. 2012) and our proposed timing of the onset of 552
patterned ground formation coincides with this. 553
554
Our SHD ages suggest, moreover, cessation of major frost sorting activity with the onset of 555
the Holocene Thermal Maximum (HTM) at c. 8,000 years ago (Seppä and Birks 2001; 556
Jansen et al. 2008; Renssen et al. 2012) when Lilleøren et al. (2012) postulate a rise of the 557
lower limit of permafrost to 1650 – 1700 m a.s.l. This rise seems to coincide most closely 558
with the SHD ages of the lower two sites (sites 4 and 5) that are currently located below the 559
supposed HTM lower permafrost limit. However, sorted circle formation also decreased at 560
the higher altitude sites. Sites 1-3 would, according to Lilleøren et al. (2012), have remained 561
underlain by permafrost throughout the whole of the Holocene. Neither at the lower, nor at 562
the higher altitude sites are there any signs of a substantial re-activation of patterned ground 563
dynamics during late-Holocene climatic deterioration and neoglaciation, the conventional 564
start of which occurred c. 6,000 years ago (Matthews and Dresser 2008; Nesje 2009; Seppä 565
et al. 2009; Matthews 2013). The patterned ground landforms seem to have remained 566
essentially as they are today even during the Little Ice Age (LIA) of the last few centuries 567
when the distribution of permafrost in Jotunheimen attained its greatest Holocene extent 568
(Lilleøren et al. 2012). The likely explanation for this is that most boulders had already been 569
removed from the circle centres and immobilized within the gutters. 570
571
The gradient involving higher mean R-values with increasing altitude shown by our data 572
seems too robust to be a random artefact of, for example, site selection. The data of Cook-573
Talbot (1991) does not show any comparable clear altitudinal trend, but her sample sites 574
were not restricted to as small an area as this study. The strength of the gradient is greater 575
than would be expected in relation to chemical weathering (cf. Dahl 1967; André 2002; 576
Nicholson 2008; Matthews and Owen 2011), and the trend of the gradient is the opposite of 577
one based on physical (frost) weathering intensity and efficiency in mountain environments 578
(Caine 1974; Harris 1988). It may therefore be inferred that the altitudinal gradients in R-579
values and SHD age associated with the sorted circles on Juvflya is determined by 580
chronological factors affecting the stabilization of boulder movement but is not necessarily 581
dynamics and the influence of non-climate-related local factors, the palaeoclimatological 583
interpretation of patterned ground is problematic (Washburn 1979; French 1988, 2007; 584
Ødegård et al. 1992; Ballantyne and Harris 1994). Our age estimates compared to the 585
Holocene variations of the lower limit and distribution of permafrost in Jotunheimen as 586
described by Lilleøren et al. (2012) may be seen as clarifying these concerns. 587
588
Alternative interpretations of the formation process and age 589
Being aware of the limitations of our SHD-approach for determining details of both the 590
formation process and the time constraints on sorted circle formation, our data does not a 591
priori exclude alternative and potentially more complex formation histories. The sorted 592
circles on Juvflya seem to be comparatively large for similar high-mountain environments 593
and a Holocene age (e.g. Washburn 1979; Harris 1988; Williams and Smith 1989; Hallet 594
2015). Such large forms may have required significant thermal-contraction cracking (French 595
2007), a process that does not appear to be characteristic of the permafrost environment at 596
Juvflya at present. This leads to speculation about possible times when a more severe 597
climate may have pertained (cf. Falch, 2001; Winkler 2001). Two alternative hypotheses are 598
considered here. 599
600
The first alternative hypothesis assumes very intense development of sorted circles within 601
a relatively short period of time (several hundred years) during the Younger Dryas-Holocene 602
transition. Permafrost conditions may have been sufficiently severe for thermal-contraction 603
cracking to occur. In this case, at least the general outlines of the features could have been 604
already established at the onset of the Holocene or shortly afterwards during the early 605
Preboreal. Holocene periglacial activity would then merely have modified existing features 606
and led to final stabilization of forms with the onset of the HTM. Although consistent with the 607
lack of any signal for late-Holocene rejuvenation, if this hypothesis was true, older SHD ages 608
would be expected. Without local information about the precise timing of deglaciation at 609
Juvflya this hypothesis must remain speculative. Available regional information (e.g. Barnett 610
et al. 2001; Matthews and Dresser 2008; Nesje et al. 2008, Nesje 2009) points firmly to a 611
late-Preboreal deglaciation, although it is possible that the Juvflya plateau areas became 612
ice-free at a time when large glaciers still filled the surrounding valleys (cf. Dahl et al. 1997). 613
The second alternative hypothesis involves the possibility that patterned ground on 615
mountains and plateaux survived glaciation beneath cold-based ice. If this was the case on 616
Juvflya, it is possible that patterned ground formation occurred much earlier and that sorted 617
circles emerged, fully formed, on deglaciation. Until recently, this was considered unlikely 618
as existing reconstructions of the Pleistocene Scandinavian ice-sheet place Jotunheimen in 619
or close to its culmination zone and continuously glaciated even during mild interstadials 620
(Mangerud et al. 2011). It was thought, moreover, that the occurrence of block fields and 621
associated ‘trimlines’ constitute uncontrovertible evidence for the existence of nunataks 622
during the Last Glacial Maximum (LGM; Nesje et al. 1988; Nesje and Dahl 1990). However, 623
it is now generally believed that blockfields can be preserved beneath cold-based ice 624
(Hättestrand and Stroeven, 2002; Ballantyne et al., 2011; Rea, 2013), and Juliussen and 625
Humlum (2007) have presented evidence of blockfield survival of more than one ice sheet 626
on mountain tops in eastern Norway. The latter interpretation implies that sorted circle 627
formation may date from before the LGM and may even be of pre-Weichselian age. Such 628
relatively old ages would not be reflected in our SHD results because rock weathering rates 629
would be near zero beneath cold-based ice sheets. Although this second alternative 630
hypothesis cannot be ruled out completely, we regard it as an unnecessarily complex 631
explanation and reject it pending new evidence. 632
633
Conclusion 634
635
This first study of Schmidt-hammer exposure-age dating in the context of patterned ground 636
surfaces (sorted circles and polygons) along an altitudinal gradient from 1500 to 1925 m 637
a.s.l. on Juvflya in central Jotunheimen demonstrates the potential of the technique and 638
allows the following conclusions to be drawn: 639
R-value distributions derived from large samples of boulders exhibit a broad plateau 640
with rather thin tails (platycurtic mode) and are negatively skewed. This distribution 641
reflects the diachronous character of patterned ground that has existed in the 642
landscape over a relatively long period of time. 643
The statistical analyses clearly indicate that large sample sizes are necessary to reveal 644
significant differences in R-values and SHD ages between these boulder surfaces. In 645
this respect, the electronic RockSchmidt can be seen as considerably more efficient 646
The low proportions of relatively high R-values indicate essentially relict landforms with 648
only minor recent process dynamics affecting the fine centres of the landforms. 649
Convective processes are concluded to have been ineffective in relation to boulders 650
since their stabilization in the coarse gutters, where a lack of fines and good drainage 651
limit frost susceptibility and cryoturbation. 652
There is a distinct altitudinal gradient in mean R-values, which increase with altitude, 653
and result in younger SHD ages (mean boulder exposure ages) at higher altitudes. 654
Application of the regional Jotunheimen SHD calibration curve (Matthews and Owen 655
2010) reveals early-Holocene mean boulder exposure ages that range from 6910 ± 656
510 to 8240 ± 495 years ago. A local Vesl-Juvbreen calibration curve (Matthews et al. 657
2014) produced SHD ages that considerably underestimates the true boulder surface 658
ages because of the unsuitability of its young control point. 659
The SHD ages are interpreted in a twofold way: (1) as minimum ages for sorted circle 660
formation and associated intense boulder upfreezing activity; and (2) simultaneously 661
as maximum ages for the cessation of activity associated with the stabilization of 662
boulders in the coarse gutters. 663
These SHD ages are consistent with the establishment of regional permafrost shortly 664
after deglaciation in the early Holocene (~9700 years ago) and with subsequent 665
gradual decrease in activity, which affected the sites at the lowest altitudes first 666
following the onset of the Holocene Thermal Maximum ~8,000 years ago. 667
Two alternative interpretations are considered: (1) an initial active period of efficient 668
frost sorting during the Younger Dryas-Holocene transition, with completion of sorted 669
circle formation earlier than indicated by the SHD ages; and (2) formation before the 670
Last Glacial Maximum, preservation beneath cold-based ice, and subsequent 671
emergence of sorted circles fully formed following deglaciation. Neither of these 672
alternative hypotheses can be fully rejected on the basis of currently available 673
evidence. . 674
Despite lowering of the altitudinal limits of permafrost, there is no evidence to support 675
reactivation of these relict landforms, either during late-Holocene climatic deterioration 676
and the onset of neoglaciation ~6000 years ago, or during the Little Ice Age of the last 677
The complex geodynamic processes involved in sorted circle formation leave the mean 679
boulder exposure age as reflecting a relatively long process of formation and 680
stabilization rather than a defined event. Additionally, the palaeoclimatic interpretation 681
of patterned ground must still be considered problematic as non-climatic factors are 682
potentially involved in the stabilization process. 683
684
685
Acknowledgments 686
The fieldwork was carried out on the Swansea University Jotunheimen Research Expedition 687
2015, and this paper constitutes Jotunheimen Research Expeditions, Contribution No..199. 688
We thank Andreas Kellerer-Pirklbauer and an anonymous reviewer for valuable comments 689
on the manuscript. 690
691
692
Word count: 7757 693
694
Names and addresses of authors: 696
697
Stefan Winkler, Department of Geological Sciences, University of Canterbury, Private Bag 698
4800, Christchurch 8140, New Zealand - [email protected] 699
700
John A. Matthews, Department of Geography, Swansea University, Singleton Park, 701
Swansea, SA2 8PP, Wales, U.K. – [email protected] 702
703
Richard W. Mourne, Department of Geography and Environmental Management, 704
University of the West of England, Frenchay Campus, Coldharbour Lane, Bristol 705
BS16 1QY, U.K. – [email protected] 706
707
Peter Wilson, Environmental Sciences Research Institute, Ulster University, Coleraine, 708
BT52 1SA, Northern Ireland, U.K. – [email protected] 709
710
711
712
713
References 715
716
Aa, A.R. and Sjåstad, J.A., 2000. Schmidt hammer age evaluation of the moraine 717
sequence in front of Bøyabreen, western Norway. Norsk Geologisk Tidsskrift, 80, 27 - 32. 718
Aa, A.R., Sjåstad, J.A., Sønstegaard, E. and Blikra, L.H., 2007. Chronology of Holocene 719
rock-avalanche deposits based on Schmidt-hammer relative dating and dust stratigraphy 720
in nearby bog deposits, Vora, inner Nordfjord, Norway. The Holocene,17, 955 – 964. 721
André, M.F., 2002. Rates of postglacial rock weathering on glacially scoured outcrops 722
(Abisko-Riksgrånsen area, 68°N). Geografiska Annaler, 64A, 139-150. 723
Aoki, H. and Matsukura, Y., 2007. A new technique for non-destructive field measurement 724
of rock-surface strength: an application of the Equotip hardness tester to weathering studies. 725
Earth Surface Processes and Landforms, 32, 1759 – 1769. 726
Ballantyne, C.K., 2013. Patterned ground. In: Elias, S.A. (ed.), Encyclopedia of Quaternary 727
Science, 2nd ed., vol. 3, Elsevier, Amsterdam, 452-463. 728
Ballantyne, C.K. and Harris, C., 1994. The Periglaciation of Great Britain. University Press, 729
Cambridge. 730
Ballantyne, C.K. and Matthews, J.A., 1982. The development of sorted circles on recently 731
deglaciated terrain, Jotunheimen, Norway. Arctic and Alpine Research, 14, 341-354. 732
Ballantyne, C.K., McCarroll, D. and Stone, J.O. 2011. Periglacial trimlines and the extent of 733
the Kerry-Cork Ice Cap, SW Ireland. Quaternary Science Reviews, 30, 3834-3845. 734
Barnett, C., Dumayne-Peaty, L. and Matthews, J.A. 2001. Holocene climatic change and 735
tree-line response in Leirdalen, central Jotunheimen, south central Norway. Review of 736
Palaeobotany and Palynology, 117, 119-137. 737
Böhlert, R., Egli, M., Maisch, M., Brandová, D., Ivy-Ochs, S., Kubik, P.W. and Haeberli, W., 738
2011. Application of a combination of dating techniques to reconstruct the Lateglacial and 739
early Holocene landscape history of the Albula region (eastern Switzerland). 740
Geomorphology, 127, 1 – 13. 741
Boulton, G.S., 1978. Boulder shape and grain-size distributions of debris as indicators of 742
transport paths through a glacier and till genesis. Sedimentology, 25, 773-799. 743
Caine, N., 1974. The geomorphic processes of the alpine environment. In: Ives, J.D. and 744
Cook-Talbot, J.D., 1991. Sorted circles, relative-age dating and palaeoenvironmental 746
reconstruction in an alpine periglacial environment, eastern Jotunheimen, Norway: 747
lichenometric and weathering-based approaches. The Holocene, 1, 128 - 141. 748
Dahl, R., 1967. Post-glacial micro-weathering of bedrock surfaces in the Narvik district of 749
Norway. Geografiska Annaler, 49A, 155-166. 750
Dahl, S.O., Nesje, A. and Øvstedal, J., 1997. Cirque glaciers as morphological evidence for 751
a thin Younger Dyras ice sheet in east-central southern Norway. Boreas, 26, 161 - 180. 752
Dahl, S.O., Nesje, A., Lie, Ø., Fordheim, K. and Matthews, J.A., 2002. Timing, equilibrium-753
line altitudes and climatic implications of two early-Holocene readvances during the Erdalen 754
Event at Jostedalsbreen, western Norway. The Holocene, 12, 17-25. 755
Evans, D.J.A. and Benn, D.I., 2004. Practical Guide to the Study of Glacial Sediments. 756
London, Arnold. 757
Evans, D.J.A., Archer, S. and Wilson, D.J.H., 1999. A comparison of the lichenometric and 758
Schmidt hammer dating techniques based on data from the proglacial areas of some 759
Icelandic glaciers. Quaternary Science Reviews, 18, 13 - 41. 760
Falch, K., 2001. Glasialgeomorfologi, holocene prosesser og klimautvikling i området 761
mellom Galdhøpiggen og Raubergstulen, nordlige Jotunheimen, Hovedfagsoppgave, 762
Universitetet i Bergen. 763
Farbrot, H., Hipp, T.F., Etzelmüller, B., Isaksen, K., Ødegård, R.S., Schuler, T.V. and 764
Humlum, O., 2011. Air and ground temperature variations observed along elevation and 765
continentality gradients in southern Norway. Permafrost and Periglacial Processes, 22, 343 766
– 360. 767
Feuillet, T., Mercier, D., Decaulne, A. and Cossart, E., 2012. Classification of sorted 768
patterned ground areas based on their environmental characteristics (Skagafjörður, 769
Northern Iceland). Geomorphology, 139-140, 577 – 587. 770
Ffoulkes, C. and Harrison, S.. 2014. Evaluating the Schmidt hammer as method for 771
distinguishing the relative age of Holocene moraines. Geografiska Annaler, 96 A, 393 – 402. 772
Follestad, B.A. and Fredin, O., 2007. Late Weichselian ice flow evolution in south-central 773
Norway. Norwegian Journal of Geology, 87, 281 – 289. 774
Frauenfelder, R., Laustela, R. and Kääb, A., 2005. Relative age-dating of Alpine rockglacier 775
French, H.M., 1988. Active layer processes. In Clark, M.J. (ed.), Advances in Periglacial 777
Geomorphology. Wiley, Chichester, 151 - 177. 778
French, H.M., 2007. The Periglacial Environment. 3rd ed., Wiley, Chichester.. 779
Gjessing, J., 1978. Norges landformer. Oslo/Bergen/Tromsø, Universitetsforlaget. 780
Goldthwait, R.P., 1976. Frost-sorted patterned ground: a review. Quaternary Research, 6, 781
27-35. 782
Goudie, A.S., 2006. The Schmidt Hammer in geomorphological research. Progress in 783
Physical Geography, 30, 703 – 718. 784
Grab, S., 2002. Characteristics and palaeoenvironmental significance of relict sorted 785
patterned ground, Drakensberg plateau, southern frica. Quaternary Science Reviews, 21, 786
1729-1744. 787
Hallet, B., 1990. Self-organization in freezing soils – from microscopic ice lenses to 788
patterned ground. Canadian Journal of Physics, 68, 842 – 852. 789
Hallet, B., 2015. Stone circles: form and soil kinematics. Philosophical Transactions of the 790
Royal Society A,371, 20120357. 791
Harris, C. and Cook, J.D., 1988. Micromorphology and microfabrics of sorted circles, 792
Jotunheimen, southern Norway. Proceedings of the 5th International Permafrost 793
Conference, Trondheim, Tapir 1, 776-783. 794
Harris, C., Arenson, L.U., Christiansen, H.H., Etzelmüller, B., Frauenfelder, R., Gruber, S., 795
Haeberli, W., Hauck, C., Hoelzle, M., Humlum, O., Isaksen, K., Kääb, A., Kern-Luetschg, 796
M.A., Lehning, M., Matsuoka, N., Murton, J.B., Noezli, J., Phillips, M., Ross, N., Seppälä, 797
M., Springman, S.M. and Vonder Mühll, D.V., 2009. Permafrost and climate in Europe: 798
monitoring and modelling thermal, geomorphological and geotechnical responses. Earth-799
Science Reviews, 92, 117-171. 800
Harris, S.A., 1988. The alpine periglacial zone. In: Clark, M.J. (ed.), Advances in Periglacial 801
Geomorphology. Chichester, Wiley, 369 - 413. 802
Hättestrand, C. and Stroeven, A.P., 2002. A relict landscape in the centre of the 803
Fennoscandian glaciation: geomorphological evidence of minimal Quaternary glacial 804
Haugland, J.E., 2004. Formation of patterned ground and fine-scale soil development within 806
two late Holocene glacial chronosequences: Jotunheimen, Norway. Geomorphology, 61, 807
287-301. 808
Haugland, J.E., 2006. Short-term periglacial processes, vegetation sucession, and soil 809
development within sorted patterned ground: Jotunheimen, Norway. Arctic, Antarctic and 810
Alpine Research, 38, 82 – 89. 811
Holmsen, P., 1982. Jotunheimen - beskrivelse til kvartærgeologisk kart M 1:250.000. Norges 812
Geologiske Undersøkelse 374 Skrifter 37, Trondheim, Norges Geologiske Undersøkelse. 813
Isaksen, K., Hauck, C., Gudevang, E., Ødegård, R.S. and Sollid, J.L., 2002. Mountain 814
permafrost distribution in Dovrefjell and Jotunheimen, southern Norway, based on BTS and 815
DC resistivity tomography data. Norsk Geografisk Tidsskrift,56, 122 – 136. 816
Isaksen, K., Ødegård, R.S., Etzelmüller, B., Hilbich, C., Hauck, C., Farbrot, H., Eiken, T., 817
Hagen, J.O. and Hipp, T.F., 2011. Degrading mountain permafrost in Southern Norway: 818
Spetial and temporal variability of ground temperatures, 1999 – 2009. Permafrost and 819
Periglacial Processes, 22, 361 – 377. 820
Jansen, E., Andersson, C., Moros, M., Nisancioglu, K.H., Nyland, B.F. and Telford, R.J., 821
2008. The early to mid-Holocene thermal optimum in the North Atlantic. In: Battarbee, R.W. 822
and Binney, H.A. (eds), Natural Climate Variability and Global Warming. Wiley-Blackwell, 823
Chichester, 123-137. 824
Juliussen, H. and Humlum, O. 2007. Preservation of block fields beneath Pleistocene ice 825
sheets on Solen and Elgahogna, central-eastern Norway. Zeitschrift für Geomorphologie 826
N.F 51, Supplementary Issue 2, 113 – 138. 827
Kääb, A., Girod, L. and Berthling, I., 2014. Surface kinematics of periglacial sorted circles 828
using structure-from-motion technology. The Cryosphere, 8, 1041 – 1056. 829
Kellerer-Pirklbauer, A., Wangensteen, B., Farbrot, H. and Etzelmüller, B., 2008. Relative 830
surface age-dating of rock glacier systems near Hólar in Hjaltadalur, Northern Iceland. 831
Journal of Quaternary Science, 23, 137 – 151. 832
Kessler, M.A., Murray, A.B., Werner, T.B. and Hallet, B., 2001. A model for sorted circles as 833
self-organized patterns. Journal of Geophysical Research Solid Earth, 106, 13287 – 13306. 834
Lie, Ø., Dahl, S.O., Nesje, A., Matthews, J.A. and Sandvold, S., 2004. Holocene fluctuations 836
of a polythermal glacier in high-alpine eastern Jotunheimen, central-southern Norway. 837
Quaternary Science Reviews, 23, 1925 - 1945. 838
Lilleøren, K.S. and Etzelmüller, B., 2011. A regional inventory of rock glaciers and ice-cored 839
moraines in Norway. Geografiska Annaler, 93 A, 175 – 191. 840
Lilleøren, K.S., Etzelmüller, B., Schuler, T.V., Gisnås, K. and Humlum, O., 2012. The relative 841
age of permafrost – estimation of Holocene permafrost limits in Norway. Global and 842
Planetary Change, 92-93, 209 – 223. 843
Lukas, S.. Benn, D.I., Boston, C.M., Brook, M., Coray, S., Evans, D.J.A., Graf, A., Kellerer-844
Pirklbauer, A., Kirkbride, M.P., Krabbendam, M., Lovell, H., Machiedo, M., Mills, S.C., Nye, 845
K., Reinardy, B.T.J., Ross, F.H. and Signer, M., 2013. Clast shape and clast transport paths 846
in glacial environments: a critical review of methods and the role of lithology. Earth-Science 847
Reviews,121, 96 – 116. 848
Luoto, M. and Hjort, J., 2004. Generalized linear modeling in periglacial studies: Terrain 849
parameters and patterned ground. Permafrost and Periglacial Processes, 15, 327 – 338. 850
Lutro, O. and Tveten, E., 1996. Årdal - berggrunnsgeologiske kart M 1:250.000, Trondheim, 851
Norges Geologiske Undersøkelse. 852
Mackay, J.R., 1984. The frost heave of stones in the active layer above permafrost with 853
downward and upward freezing. Arctic and Alpine Research, 16, 439 – 446. 854
Mangerud, J., Gyllencreutz, R., Lohne, Ø. and Svendsen, J.I., 2011. Glacial history of 855
Norway. In: Ehlers, J., Gibbard, P.L. and Hughes, P.D. (eds.), Quaternary Glaciations – 856
Extent and Chronology. Amsterdam, Elsevier, 279 – 298. 857
Matsuoka, N., Abe, M. and Ijiri, M., 2003. Differential frost heave and sorted patterned 858
ground: field measurements and a laboratory experiment. Geomorphology, 52, 73-85. 859
Matthews, J..A., 1987. Regional variation in the composition of Neoglacial end moraines, 860
Jotunheimen, Norway: an altitudinal gradient in clast roundness and its possible 861
palaeoclimatic significance. Boreas, 16, 173-188. 862
Matthews, J.A., 2013. Neoglaciation in Europe. In: Elias, S.A. (ed.), Encyclopedia of 863
Quaternary Science, 2nd ed., vol.2, Elsevier, Rotterdam, 257 - 268. 864
Matthews, J.A. and Dresser, P.Q., 2008.