The Effects of Changing Projection Geometry on the Perception of 3D Objects
The Effects of Changing Projection Geometry on
Perception of 3D Objects on and around Tabletops
MIGUEL A. NACENTA
University of St Andrews, St Andrews, Scotland, United Kingdom
MARK HANCOCK
University of Waterloo, Waterloo, Ontario, Canada
CARL GUTWIN
University of Saskatchewan, Saskatoon, Saskatchewan, Canada
SHEELAGH CARPENDALE
University of Calgary, Calgary, Alberta, Canada
________________________________________________________________________
Displaying 3D objects on horizontal displays can cause problems in the way that the virtual scene is presented on the 2D surface; inappropriate choices in how 3D is represented can lead to distorted images and incorrect object interpretations. We present four experiments that test 3D perception. We varied projection geometry in three ways: type of projection (perspective/parallel), separation between the observer’s point of view and the projection’s center (discrepancy), and presence of motion parallax (with/without parallax). Projection geometry had strong effects different for each task. Reducing discrepancy is desirable for orientation judgments, but not for object recognition or internal angle judgments. Using a fixed center of projection above the table reduces error and im-proves accuracy in most tasks. The results have far-reaching implications for the design of 3D views on tables, in particular for multi-user applications where projections that appear correct for one person will not be perceived correctly by another.
Categories and Subject Descriptors: • Human-centered computing~Graphical user interfaces • Computing meth-odologies~Perception • Computing methodologies~Virtual reality General Terms: Perception, Human-computer Interaction
Additional Key Words and Phrases: Interactive Tabletops, 3D Perception, 3D Representation, 3D Visualization, Projection, Point-of-View, Center-of-Projection, Fish Tank Virtual-Reality.
This work is supported by the Natural Sciences and Engineering Research Council of Canada (NSERC) through the Digital Surface Software Application Network (Surfnet), by the Canadian Networks of Centres of Excellence (NCE) through the Graphics, Animation and New Media (GRAND) Network, by Sheelagh Carpendale’s Canada Research Chair (CRC) on Information Visualization, by Sheelagh Carpendale’s NSERC/Alberta Innovates Tech-nology Futures (AITF)/Smart Technologies Industrial Research Chair on Interactive Technologies, and by the Scottish Informatics and Computer Science Alliance (SICSA).
Author’s addresses: M.A. Nacenta, School of Computer Science, University of St Andrews, St Andrews KY16 9SX, Scotland, United Kingdom; Mark Hancock, Department of Management Sciences, University of Waterloo, 200 University Avenue West, Waterloo, Ontario N2L 3G1, Canada; Carl Gutwin, Department of Computer Sci-ence, University of Saskatchewan, 110 Science Place, Saskatoon, Saskatchewan S7N 5C9, Canada; Sheelagh Carpendale, Department of Computer Science, University of Calgary, 2500 University Dr. NW, Calgary, Alberta T2N 1N4, Canada.
________________________________________________________________________
1 INTRODUCTION
urban planning discussions using models of real-world structures, and collaboration over 3D visualizations.
These applications rely on a person’s ability to accurately perceive three-dimensional structures in the flat, two-dimensional representations displayed on a screen. Perceiving 3D structure from a 2D representation is not an uncommon task: we do it every day when we view photos (printed or displayed on a monitor), look at 3D diagrams of buildings or objects (e.g., the instructions of build-your-own furniture), or play video games. However, there are specific problems associated with visualizing 3D content on horizontal displays; in particular, images on tabletops can be looked at from any direction, unlike most vertical displays or paper documents where there is a clear up direction. This problem has been identified for 2D content [Scott et al. 2003], but it is much more evident when a 3D repre-sentation is used. Several difficulties can arise, including distortion, problems in recogniz-ing objects or assessrecogniz-ing angles, and communication errors when referrrecogniz-ing to objects (e.g., “the buildings that are tilted towards me” in Figure 1 left will not make sense for an ob-server looking from the other side—Figure 1 right).
Figure 1. Two perspectives on the same presentation of a 3D model on a table; from one side the image looks correct, but from the other the image is distorted.
Although advanced display technologies exist that could address this problem by providing different images for each participant (e.g., [Matshushita et al. 2004, Karnik et al. 2012]), or by generating volumetric images [Geng 2013], at this point in time these are expensive, impractical, and uncommon compared to ubiquitous flat single-image displays. There is currently very little understanding of how different kinds of 3D projections affect people carrying out tasks in tabletop environments equipped with single-image flat displays. This work provides a comprehensive set of empirical data that can be used by designers of 3D tabletop systems. We carried out four studies that evaluated the effects of different perspectives and projections on several perceptual tasks that are fundamental to working with 3D content.
We tested two different types of projection (perspective and parallel), three different locations of the viewer relative to the point of projection, which we call discrepancy (no discrepancy, medium discrepancy, and large discrepancy), and two conditions of motion parallax (i.e., whether real-time head-motion parallax was available or not). Our three per-ceptual tasks were: estimation of object orientation, which is fundamental for comprehend-ing spatial relationships in the model; estimation of internal angles, an integral part of un-derstanding the structure of 3D objects; and object recognition, a high-level task required for effective navigation and manipulation of 3D content.
The findings from the four studies provide a wealth of new information about how people interpret and work with 3D content on tabletop displays. There are three main re-sults from the studies:
• Second, when parallel projection geometry is used in combination with a projec-tion point above the table (between the two viewers), participants more accurately estimated internal angle and orientation, and better recognized objects. This result contradicts two common beliefs: that designers must minimize discrepancy to im-prove interpretation, and that perspective projections provide a more accurate rep-resentation of 3D content.
• Third, participants performed significantly better when interactivity was provided through direct interaction (i.e., touch-based rotation of objects) than when partici-pants manipulated the view through their head motion (i.e., motion parallax) or when no interactivity was available. This suggests that problems of interpretation can also partly be mitigated by providing direct interaction.
The empirical evidence provides several new principles for the design of 3D projections on horizontal surfaces. Overall, our studies show that optimizing the perspective for one person at a shared table is likely to cause major problems for the others in the group, espe-cially in tasks that involve estimation of object orientation, but that providing a neutral projection above the table and using parallel projection geometry can mitigate the prob-lems. In addition, applications that are sensitive to errors must be designed with great care, since some projection types saw large estimation and recognition errors (e.g., up to 60° orientation error), and object recognition rates that were no better than chance. In addition, the performance differences we found must be balanced against several design trade-offs, including the cost and feasibility of introducing viewer tracking (necessary to provide dis-crepancy-free projections), and the problem that an optimal projection for one viewer may imply the worst possible view for another.
The rest of this article is organized as follows: first we provide additional information on the problem of 3D projection for tabletop surfaces, and introduce important concepts and terms that are used in the studies; second, we present a summary of fundamental con-cepts underlying 3D representation and perception and review related work from the areas of interactive displays, information visualization, and perception research; third, we report on the four studies; and fourth, we provide an overall discussion of our findings and impli-cations for designers of 3D tabletop systems.
2 THE PROBLEM OF VIEWING 3D CONTENT ON TABLETOPS
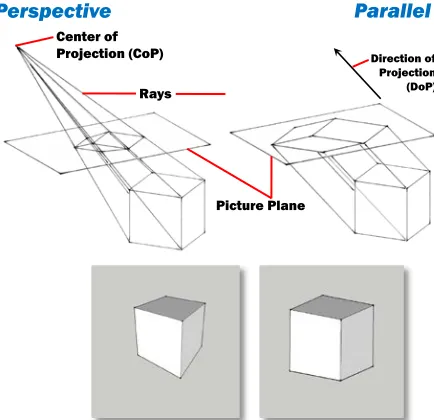
When representing 3D content on horizontal surfaces, one must decide on a particular pro-jection—that is, a method of mapping points from the three-dimensional model to points on the two-dimensional plane1. There are two main kinds of projection: perspective and parallel. A perspective projection maps points to the 2D plane by creating straight lines (rays) from every point in the 3D model to a single origin point; the intersection of the rays with the 2D tabletop determines the geometry of the model on the horizontal surface (see Figure 2, left). The single origin point is called the centre of projection, or CoP. Perspective projection is used in most 3D applications of computer graphics and virtual reality.
The second main type of projection is parallel projection [Carlbom and Paciorek 1978], which creates rays that are parallel to one another from each point of the 3D model (Figure 2, right); the rays project in a fixed direction instead of converging to a CoP, and thus a parallel projection does not have a true CoP (it has a direction of projection—although for simplicity, in this paper we will refer to both as CoP). Parallel projection is often used in
construction and engineering drawings because the image maintains scale and parallelism from the 3D model2.
[image:4.504.144.361.197.407.2]In a tabletop projection of 3D content, there are therefore two important reference points: the point or direction from which the projection emanates (the CoP), and the loca-tion of the viewer’s eyes (i.e., the point of view, or PoV). If the center of projecloca-tion and the point of view are different (i.e., there is a discrepancy between the CoP and the PoV), then the viewer must look at an image that does not correspond geometrically to what a real object would project in their retinas from their current perspective3. As a consequence, the user’s view of the projected image will appear distorted (see Figure 1).
Figure 2. Principles of perspective projection (top left), parallel projection (top right), a cube represented in perspective projection (bottom left), and a cube represented in parallel projection (bottom right).
Distortion caused by discrepancy can lead to misperception of objects. Accurate per-ception of 3D objects is critical in many applications such as medical image visualization [Kitamura et al. 2007, Bichlmeier et al. 2009], and industrial or architectural applications [Kruger et al. 1995, Agrawala et al. 1997]. Moreover, since the distortion effects will be different for different viewers, this can lead to miscommunication between collaborators, who might not be aware of how their point of view affects what they perceive. It is not uncommon to refer to and communicate about objects through attributes such as orientation and size, which can both be affected by perspective distortion4.
2 Several types of parallel projections exist. For example, non-orthographic oblique pro-jections such as cavalier “bends” one of the axes at a non-90° angle in its representation. However, most of the common projections used in current graphics are either perspective, or sub-types of parallel projections (e.g., isometric projection is a parallel projection with a CoP at 45° with respect to all the main references axes).
3 This geometrical correspondence is only part of the match that we can achieve between the retinal images generated by real objects and their representations. Other cues such as focus blur cannot be matched by planar monocular projections.
4 It is technically possible to provide a different image for each viewer of the horizontal display, (e.g., by using a light field display or a multi-image display [Grossman and
Center of Projection (CoP)
Rays
Picture Plane
Direction of Projection (DoP)
Displaying 3D objects on tables therefore presents new problems for designers. Choices made in creating the 3D image such as the location of the CoP, and whether a perspective or parallel projection is used, can change the appearance of the resulting scene. To illustrate the details of the problem, consider the 3D model in Figure 3, which contains a collection of buildings, many of which are not entirely perpendicular to the ground.
Wigdor 2007, Kitamura et al. 2001, Holografika Kft 2011]). However, these technologies are uncommon in current collaborative settings due to price, limitations in angle of view, and because they can require tracking the positions of all participants or rendering images for all possible points of view. The overwhelming majority of tabletop systems currently installed and in production are single-image, that is, monocular.
Figure 3. 3D model used as example in the rest of the article.
Figure 4. Left: CoP and PoV both above the table. Right: CoP above the table and PoV at the end of the table.
Typically, 3D graphics applications use a CoP that is in the centre and directly in front of the screen (above the table for horizontal displays). Figure 4, left shows what one would see if hovering above the table; in this image, the CoP and PoV coincide. Figure 4, right shows a view of the same scene but from the end of the table. There is now a discrepancy between the PoV (at the end of the table) and the CoP (still above the table).
Ideally when standing beside a digital table one would like to get a good 3D impression of this model. For instance, one might expect to see the model as shown in Figure 5, left. This image again has a CoP and PoV which coincide, but this time both are located at the end of the table. However, if one were to walk to the opposite side of the table one would get the experience shown in Figure 5, right.
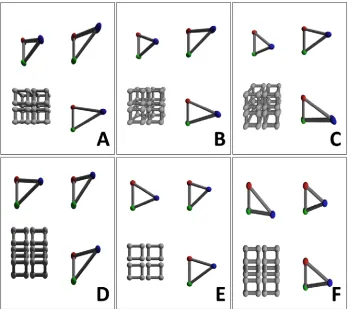
To further illustrate the problem, this same model is projected into the 2D images shown in Figure 6 using different projection geometries and CoPs. The letters A-F corre-spond to the same labels in Figure 7, which shows what the images would look like when observed from different PoVs at a tabletop display. These representations coincide with the conditions of our empirical study.
The problems described above are the subject of our studies below; first, however, we pro-vide additional background on representation and perception of pictorial space.
3 BACKGROUND AND RELATED WORK
Our work draws from three main areas of study: perception, graphics, and human-computer interaction. The following sections offer first a basic overview of the concepts that are necessary to describe our research and present a summary of the state-of-the-art.
3.1 Depth Cues and Perception
The visual system relies on several sources of information—visual cues—for volumetric perception; according to Cutting and Vishton [1995], there are nine basic and independent sources of information for depth perception: occlusion, relative size, relative density, height in visual field, aerial perspective, motion perspective, convergence, accommoda-tion, and binocular disparity, stereopsis, and diplopia. Not all of these sources need to be present simultaneously; in fact, the first four, which together form what is understood as linear perspective [Carlbom and Paciorek 1978], are sufficient to provide a perception of depth, as is evident from our ability to perceive depth in photographs and 3D technical drawings. Furthermore, some of these cues are relevant only for certain ranges; for exam-ple, accommodation is only effective in the first few meters, while aerial perspective—the loss of air transparency shown by very distant objects due to atmospheric light scattering— only applies to objects very far away. Most common existing displays only portray linear perspective, with a few offering binocular disparity and motion perspective. A few other cues such as simulating accommodation via blur are being investigated but are still in early stages of development [Mauderer et al. 2014].
In this research, we focus on the most common display scenario – the widely installed, monoscopic tabletop that relies on non-stereoscopic display technologies. The depth cues that can be applied in this setting are those that arise from linear perspective (occlusion, relative size, relative density, and height in visual field), with the addition of motion per-spective if the objects are in motion or if the viewer can move. In this last case, providing correct viewer-centric motion perspective (motion parallax) requires tracking the 3D loca-tion of the viewer’s eyes in real time.
3.2 The Perception of Pictorial Space
Scientists and artists have long investigated how pictures represented on a 2D plane are able to create the impression of depth – what is called by psychologists and artists the pictorial space. Some researchers indicate that this is possible because pictures can accu-rately reproduce on the retina some of the necessary cues of 3D perception (e.g., the fore-shortening of objects due to linear perspective and the visual change in receding textures [Cutting 1987, 1988, Sedgwick 1993, Ellis et al. 1991, Saunders and Backus 2006]).
However, as we stated in the previous section, flat projections of 3D space only create retinal images equivalent to the 3D scene if the PoV of the observer is located at, or close to, the CoP used to generate the image [Sedwick 1993]. When PoV and CoP are at very different angles to the picture plane, or are at very different distances (e.g., when we look at photographs on a table, a painting from a lateral point of view, or a movie from the side aisle), the differences between correct and distorted retinal projections can be very large. If pictorial perception is dependent only on the geometry of the projected retinal image, this should result in the perception of a space that is deformed compared to the depicted space [Goldstein 1987, Sedgwick 1993, de la Gournerie 1859].
Regardless of the distortion, observers are remarkably good at perceiving a relatively accurate pictorial space [Vishwanath et al. 2005]. However, there is still not a definitive explanation from the perception research community of the underlying processes that sup-port correct space perception from geometrically incorrect retinal images, which is often referred to as space constancy. Some suggest that the visual system corrects distortions based on geometrical information from the represented scene, for example, the visual sys-tem might be assuming that certain angles are straight [Perkins 1973], that objects are rigid [Cutting 1987], or that certain converging lines on the picture are actually parallel in the real scene [Saunders et al. 2006]. Others propose that information about the correct CoP can be recovered from perceptual information about the surface where the picture is pro-jected, such as accommodation [Cutting 1997, Pirenne 1970] and the shape of the frame of the picture [Koenderink et al. 2004].
discussed above (e.g., frame and perceptions of the picture surface through binocular cues [Vishwanath et al. 2005]).
Besides angle, the PoV can be different from the CoP in terms of distance; that is, if the projection is not observed at the right distance, it will not be geometrically correct either, although the distortion produced is more subtle than with angular discrepancy. Taken to the limit, a parallel projection is made from an infinitely far PoV with an appro-priately powerful magnification. This is the reason why images from optical systems that are remotely located and have powerful zooms (e.g., satellite imagery) are almost equiva-lent to parallel projections. The perceptual differences in the perception of 3D objects in the continuum between parallel and close perspective projection were investigated by Ha-gen and Elliott [1976]. They found that parallel projections are perceived as more natural than their perspective counterparts. This finding contradicts the hypothesis that geometri-cally correct perceptions will generate more natural images, although it is not yet known if this holds when the graphics are interactive and motion cues are present. Steinicke Bruder and Kuhl [2011] have also investigated perceptual and manipulation effects of overlapping vs. distant (but mostly aligned) PoV and CoP for monitor based situations, although they discuss these discrepancies in terms of differences between the geometric field of view, and the display field of view. Their results contradict Hagen and Elliott’s results in that they found that overlapping PoV and CoP (or coincident GFOV and DFOV in their terms) are perceived as more realistic.
3.3 Depth from Motion and Action
Any single static view (e.g., a photograph) cannot provide a complete representation of the 3D structure of an object; parts of the object are bound to be hidden, ambiguously inter-pretable, and only partially visible from any single point of view. Recognizing an object that has been captured from a different point of view requires processing time, and is prone to errors [Wexler et al. 2001, Diwadkar and McNamara 1997, Biederman and Gerhardstein 1993]. Many experiments show that image sequences of the object that reveal its different surfaces are integrated by the visual system to contribute to the perception of 3D structures [Rogers and Graham 1979, Simons et al. 2002, Sun et al. 2004]. Moreover, some evidence suggests that motion cues are more dominant for depth perception than binocular cues [Ar-thur et al. 1993], although this evidence has also been contested for different tasks. See [Arsenault and Ware 2004] for a review and evidence.
The changes in the appearance of a 3D object that generate a sequence of images can result from changes in the position and orientation of the object itself, the physical point of view of the observer, the virtual point of view in the virtual space (i.e., virtual space navi-gation), and the center of projection of the scene. Additionally, in computer-based systems, these changes can be caused by interactive control by the viewer, automatic system change (e.g., in an animation or through a piece of experimental software), or both. To make things even more difficult, different display systems couple different combinations of the points of view and the center of projection to each other. For example, in Fish Tank Virtual Re-ality [Ware et al. 1993], the movement of a view (the physical PoV) is coupled to both the Virtual PoV of the Scene and the CoP.
(a baseline, no-motion condition); where the object can be looked at from different points of view controlled by the head motion of the viewer (equivalent to fish tank VR); where besides head-coupled motion, the viewer can manually manipulate the position and orien-tation of the object; and where there is depth motion, which is generated externally without the viewer’s intervention5.
3.4 Collaborative and Volumetric Display Systems
An obvious way to address the problem of discrepancy for collaborative displays is the use of hardware systems that can either provide a true volumetric display where light is pro-duced or reflected at the location in the space where the object is meant to be [Grossman & Wigdor 2007], or can simulate the different light patterns coming into the retinas of individual viewers. These light patterns can be simulated through a variety of technologies, including head-mounted projections (e.g., polarized glasses that filter the adequate image for each person/eye, or screens that provide a separate image to each eyeball [Kiyokawa et al. 2003, Höllerer et al. 1999]), clever filtering techniques on the source content (e.g., spa-tial occlusion [Kitamura et al. 2001], the use of polarization [Sakurai et al. 2008, Karnik et al. 2012], directionally heterogeneous diffusion [Matsushita et al. 2004]), or a combination of several of these techniques [Kulik et al. 2011]. A recent survey of stereoscopic and 3D display techniques is provided by Geng [2013].
Although the state of the art is rapidly advancing, the use of these techniques is still practically limited, expensive, or both. For example, volumetric displays based on rotating devices are expensive, noisy, and tend to have low resolution. Less mechanically-based approaches, such as providing separate images for each person, are expensive and intro-duce technical challenges, like image cross-talk, especially if the system is meant to be binocular and displays can be oblique (which makes the use of polarization problematic). Transparent personal head mounted displays are becoming cheaper, but are still far from ubiquitous and many people will prefer not to have to wear this hardware. Autostereoscopic lenticular displays are also dropping in price, but tend to only provide multiple images in one axis, as they are meant to be mounted vertically for entertainment. Due to existing limitations in multi-user stereoscopic and volumetric display technology, and since the ex-isting base of displays is still overwhelmingly flat and single-image, the study of the effects of perception of 3D images in the latter kind of displays is of great relevance.
3.5 Perception and Projection in HCI Research
The topics of projection, perspective distortions, and perception have also received consid-erable attention in HCI and display research. Virtual reality research has identified single-screen multi-user 3D rendering as an important challenge for shared-display VR systems [de Haan et al. 2007, Simon and Scholz 2005].
Although the distortion in the perception of 3D elements produced by PoV-CoP dis-crepancy is often acknowledged (e.g., [de Haan et al. 2007, Simon and Scholz 2005, Arse-nault, and Ware 2004]), proposed solutions have, so far, only addressed the issue of object manipulation. Previous solutions are based on providing correct perspectives only for the visual elements of the interaction techniques while keeping the CoP in a fixed position
[Simon and Scholz 2005], or as an interpolation of the PoV of the different participants for the 3D scene [de Haan et al. 2007]. Hancock et al. [2007] have also studied effective 3D object manipulation through direct multi-touch input (which due to its direct nature elimi-nates the problem of discrepancy in the interaction technique visuals). More recently, sev-eral groups of researchers have started to explore techniques where perspective manipula-tions and object movement are used to facilitate selection and manipulation of 3D objects [Möllers et al. 2012, Valkov et al. 2012].
Our studies differ fundamentally from this work in that we focus on the perception of 3D objects, not on manipulation performance. Our approach is justified because perception itself is important for the use of 3D systems, but also because perception is a fundamental part of interaction that is bound to affect how manipulation takes place (e.g., through per-spective distortion [Arsenaut and Ware 2005]).
Another related strand of research studies the effects of projecting 2D information in oblique angles and rotations. Wigdor et al. [2007] studied how the slant of the surface affects perception of length, angle, and area for 2D data, and Nacenta et al., showed how perspective distortion affects 2D perception and interaction tasks, and how it can be im-proved through perspective-compensation techniques [Nacenta et al. 2007].
4 STUDY OF 3D PERCEPTION IN TABLETOP DISPLAYS
As discussed in our review of related work, different ways to project 3D information can have a strong impact on how 3D objects are represented, yet little is known about how these factors affect collaborative tabletop scenarios or how the factors interact with each other. This paper contributes a study involving four experiments designed to inform design choices for 3D tabletop applications. In the following subsections we describe the high-level design of the four experiments and their common elements, including independent variables, measures, hypotheses and apparatus. The details of each experiment and its re-sults are discussed separately in Sections 5–8.
4.1 Tasks
We selected three perceptual tasks that are at the core of more complex perceptual activity on tabletops. The first and second tasks were tested in Experiments 1 and 2; the last task was tested in Experiments 3 and 4.
Orientation Estimation—estimating the orientation of 3D objects from the pictorial space into the physical environment; i.e., estimation of the perceived external angle. This task is fundamental in recognizing the spatial relationships between objects represented in the vir-tual space and in the real space. This task is particularly relevant for scenarios where the real world and the virtual world interact with each other. Examples where this task will be common are systems using tangibles, and ubiquitous computing scenarios where infor-mation on displays relates to external objects, devices, or people.
Object Structure Recognition—being able to identify two objects that have the same 3D shape as equal to each other in structure. This is a higher level task because (a) it likely involves several ways to perceive the internal 3D structure of the object (e.g., angles and distances), and (b) it involves the comparison of two perceived objects. This task was se-lected to represent the generic ability to recognize objects through their 3D structure. Alt-hough the task of recognizing a 3D object from memory is somewhat different than com-paring two objects that are visible, we believe this is a reasonable first approximation, since there are no evident reasons to believe that projection will affect the two tasks differently.
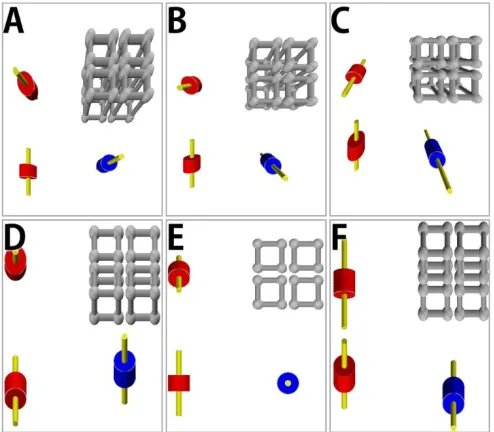
Figure 8. Any angle in a 3D model is susceptible to change when represented with different projections. Incorrectly estimating the model’s angles from the model’s representation indicates a failure to interpret the representation of the model accurately. A-F correspond to the same projections in A-F of Figure 6.
4.2 Common Apparatus
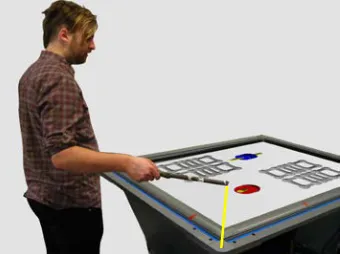
[image:12.504.154.350.421.568.2]For all four experiments, participants stood or sat at an end of a 146 cm × 110 cm bottom-projected table with a resolution of 2800 × 2100 (19 pixels/cm; 2 × 2 tiled projectors with 1400 × 1050 pixels each). The PoV of each participant was tracked using a Vicon™ motion tracking system with markers placed on hats that the participants wore throughout the ex-periment (Figure 9). Participants took part in the exex-periment in pairs, at opposite ends of the table. Although measurements were individual (per participant) and each participant’s task was independent, the presence of another person was useful to simulate conditions of large-discrepancy and parallax imposed by others.
Figure 9. The experimental space photographed from behind the shoulder of one of the participants. The experimenter sat perpendicular to the long side of the table.
4.3 Main independent variables (factors)
medium-discrepancy condition is not just an interpolation of the two extremes; projections that are centered on and perpendicular to the display surface have been used often in 3D tabletop applications (e.g., [Bichlmeier et al. 2009, Hancock et al. 2010]).
Figure 10. The three levels of discrepancy studied across all experiments. The camera icon represents the position of the CoP, the eye icon represents the position of the PoV.
Figure 11 shows the fixed parameters of the projection used throughout the experiment for medium discrepancy: the CoP was placed 41 cm above the center of the table; since the table was 110 cm wide, this implied a view angle of 106°.
A secondary factor is motion parallax—that is, whether the CoP dynamically followed the participant’s PoV, resulting in perspective changes as the participant moved their head. This corresponds to self-generated motion parallax as described in Section 3.3. The motion parallax condition was tested both when the CoP moved with the participant’s PoV and when the CoP moved with a different person’s PoV. Note that with a medium discrepancy parallax is not used, since the CoP is fixed above the table.
The first two factors combine into five discrepancy-parallax conditions: NoDiscrep-ancy/Parallax, NoDiscrepancy/NoParallax, MediumDiscrepancy/NoParallax, LargeDis-crepancy/NoParallax, and LargeDiscrepancy/Parallax. For a full depiction of all conditions and levels see Figure 13.
An additional factor in our study was projection geometry, which had two levels: per-spective and parallel. The combination of all factors, with discrepancy and parallax rolled into one (discrepancy-parallax) and fully crossed with projection geometry, results in a design with 5 × 2 = 10 cells, i.e., ten different combinations of levels (see Figure 12).
Figure 11. Fixed projection parameters for the medium discrepancy condition. The remaining condi-tions used the same near plane, but the CoP was matched to either the participant (in the no-discrep-ancy condition) or their partner (in the large-discrepno-discrep-ancy condition).
41 cm
(eye distance)
110 cm (table width)
106°
Figure 12. The experiment has two main factors: parallax-discrepancy (horizontal), where discrepancy increases from left to right and parallax conditions are at the extremes, and projection type (vertical).
We decided to combine the parallax and discrepancy dimensions into one (as opposed to considering a 3x2x2 model with discrepancy, parallax and projection type as factors) because parallax can be considered as a continuous extension of discrepancy (i.e., parallax alters discrepancy), and because there is no parallax condition for medium discrepancy.
In Steinicke, Bruder, and Kuhl’s [2011] terminology, the variation of our factors keep the geometric and display fields of view as similar as possible in the NoDiscrepancy con-ditions (with the parallax concon-ditions adjusting this in real time), whereas the MediumDis-crepancy condition has different frustums (with the display frustum being an asymmetric display frustum) and the LargeDiscrepancy conditions have two asymmetric (but opposed) display frustums.
To create LargeDiscrepancy conditions, we used the PoV of the other participant. This means that for LargeDiscrepancy conditions, content was rendered for the other participant. Although the LargeDiscrepancy conditions, especially with parallax, might seem some-what artificial and designers will predictably try to avoid them, we decided to include them for three main reasons. First, they represent situations and system designs that are not far-fetched, such as a non-tracked observer entering the space or a more sophisticated perspec-tive design where individual objects are projected differently depending on who is cur-rently manipulating them (but perceivable by everyone). Second, they offer completeness from the experimental point of view and valuable empirical results for the 3D perception community. Third, it enables testing participants in pairs, which provides a slightly more ecologically valid simulation of multi-user environments.
4.4 Dependent variables (measures)
The main dependent variables recorded across all experiments were accuracy, defined spe-cifically for each task, and task completion time (TCT). We also measured subjective as-sessment of each condition with two 7-point Likert-scale questions: one about the difficulty of the task, and one about overall preference.
4.5 Common Hypotheses
All four experiments tested four primary hypotheses: the first concerns the general effect of discrepancy, the second (subdivided in two) tests the combined effect of projection type with discrepancy, the third (subdivided in two) tests the effect of parallax, and the fourth examines the nature of the medium discrepancy conditions as a special case:
H1: As the discrepancy increases, the ability to make spatial estimates degrades. H2: Perspective projection makes the effect of discrepancy more extreme:
No Discrepancy
Parallax: Present No DiscrepancyParallax: Absent Medium Discrepancy Large DiscrepancyParallax: Absent Large DiscrepancyParallax: Present
Perspective
Parallel
NP
Perspective PerspectiveNA PerspectiveMA PerspectiveLA PerspectiveLP
NP
H2.A: With no discrepancy, perspective projection improves spatial estimation. H2.B: With discrepancy, perspective projection degrades spatial estimation. H3: Parallax makes the effect of discrepancy more extreme:
H3.A: With no discrepancy, motion parallax improves spatial estimation. H3.B: With discrepancy, motion parallax degrades spatial estimation.
H4: Medium discrepancy (CoP above) is a special case that improves spatial estimation.
The exact meaning of improving or degrading spatial estimation depends on the meas-ure and the task: better spatial estimation implies better accuracy, less time, less perceived effort, and greater preference. Different measures can conflict (e.g., a condition might be faster but less accurate); therefore, we analyze the contributions to the hypotheses from all measures. All four experiments were also designed to test the secondary hypothesis:
H5: The use of motion parallax requires more time to complete the task.
4.6 Common Analysis
For each of the objective measures (errors and time) we first performed omnibus RM-ANOVA with factors parallax-discrepancy and projection (5 discrepancy-parallax × 2 pro-jection). Different experiments had additional main factors depending on their specific task. We tested for sphericity and applied the Huynh-Feldt correction to the degrees of freedom where necessary.
In addition to the omnibus tests, we performed a series of planned comparisons of se-lected conditions. These were specified before the start of the analysis and, if we found an interaction between the factors, we performed these tests separately on each type of pro-jection geometry (perspective or parallel). If the interaction was not significant, we aggre-gated perspective and parallel conditions before the post-hoc analyses. Post-hocs used Holm-Bonferroni adjustments. Figure 13 summarizes the a priori selected post-hoc tests.
Figure 13. Graphical illustration of the a priori selected post-hoc statistical tests.
Subjective measures were analysed by first transforming the numerical data using the ART procedure [Wobbrock et al. 2011], which allowed us to test for main effects as well as interactions. If the omnibus test yielded a main effect of discrepancy-parallax, we per-formed the same comparisons between conditions as described above for the objective measures. As above, if an interaction between the two factors was found significant, the selected pairwise post-hoc tests were performed separately for the parallel and the perspec-tive projection geometries. The post-hocs were Wilcoxon non-parametric tests performed on the non-transformed data. The analysis was designed to avoid the assumption of nor-mality.
NP – Perspective NA – Perspective MA – Perspective LA – Perspective LP – Perspective
NP – Parallel NA – Parallel MA – Parallel LA – Parallel LP – Parallel No Discrepancy
Parallax: Present No DiscrepancyParallax: Absent Medium Discrepancy Large DiscrepancyParallax: Absent Large DiscrepancyParallax: Present
Perspective
5 EXPERIMENT 1: ORIENTATION ESTIMATION
This experiment was designed to test people’s perception of the orientation of 3D virtual objects with respect to their physical surroundings. That is, when an object is rendered so as to point ‘out’ of the display, how well can people perceive its direction?
5.1 Participants
Twenty-four participants (11 female, 13 male) completed this experiment (ages 19 to 36, Mdn = 28, SD = 4.5). Participants performed a six-item Purdue spatial rotation test [Bodner and Guay 1997] previous to the experiment (correct answers, out of 6: M=4.56, Mdn=5). Participants were recruited in pairs and performed the experiment in pairs (one on each side of the table). The pairs were 3 all-female, 4 all-male, and 5 mixed gender. This study was conducted together with Experiment 4, and so upon completing this experiment, the same pair proceeded to Experiment 4.
5.2 Apparatus
In addition to the common apparatus, Vicon-tracked markers were placed at the end of a wand which was attached to a corner of the tabletop through a string (see Figure 14 and Figure 15). This allowed us to accurately measure the 3D angle of the string, that is, the angle determined by the line from the tip of the wand to the corner of the table. Participants manipulated their own string with their own wand in order to record answers about the angle of the target.
Figure 14. Diagram of the experimental setup for Experiment 1. The left diagram displays elements that concern only the task of participant 1. The right diagram shows how the two participants were actually tested in pairs, with targets on the bottom corresponding to the participant on the left, and targets on the top corresponding to the participant on the right.
5.3 Task
Participants were asked to determine the orientation of virtual objects on the table. For each trial, two 3D target objects were displayed on the screen (one per participant, always dis-played on the half of the display at the participant’s right). Targets were either in the ‘near’ half or the ‘far’ half of the table. Each object was a long thin cylinder inside a shorter thicker cylinder with the same axis. To provide their answer for each task, participants moved the tip of the wand, until the string joining it with the corner of the table was oriented at the same angle as the main axis of the target (Figure 15).
P1 near target P2
near target far target far target
x y z
string
string
(out)
P1
near target far target
x y z
Once both participants had indicated the angle and pressed a ‘done’ button on the table surface with their free hand, the next trial would begin. Although the presentation of conditions and the orientation of the objects were randomized, the orders that the two sim-ultaneous participants saw were complementary to each other’s (e.g., a no-discrepancy trial for one participant would coincide in time with a large discrepancy trial for the other).
To avoid interference or copying, in each trial each participant had to judge the ori-entation of a separate object. The two spaces not occupied by target objects were filled in with two reference objects represented using the same geometry as all other virtual objects on the table. Reference objects are four cube frames in a square configuration (see Figure 15). These were meant to provide additional visual context to the target objects.
5.4 Procedure and Experimental Design
In each of the ten discrepancy-parallax × projection combinations, participants performed all combinations of the remaining factors in random order. Participants carried out six prac-tice trials (one for each combination of location and angle), and twelve testing trials (two for each location/angle combination) for each discrepancy-parallax × projection combi-nation, for a total of 180 trials.
[image:17.504.168.338.91.218.2]As mentioned before, targets could appear either in the ‘near’ or ‘far’ halves of the table, as shown in Figure 14; this additional factor was controlled and randomized. Targets were also shown in three different angular orientations, and in two locations. As shown in Figure 16 and Figure 17, targets could be at either 0° (lying flat on the table and pointing towards the end of the table where the participant was located), 60° (pointing upwards towards the end of the table), or 90° (pointing straight up from the table). Targets never leaned to the left or right. We chose to manipulate only the longitudinal direction of targets because the PoV and CoPs are mostly oblique in that direction, and therefore this is the manipulation most likely to cause relevant perceptual differences.
Figure 16. Left) The virtual volume in which the target objects were placed. Right) The two measures of error taken in the experiment: longitudinal (deviation within the vertical longitudinal plane), and trans-versal (deviation with respect to the projection of the estimation onto the longitudinal vertical plane).
[image:18.504.129.376.319.535.2]To summarize, the study tested 5 discrepancy-parallax conditions × 2 projection geome-tries × 2 stimuli locations × 3 angles in a fully-crossed within-participants design. The 10 discrepancy-parallax and projection geometry pairs’ order of presentation were counter-balanced between participants using a random Latin Square. The different target orienta-tions appeared in randomised order to prevent participants from deriving angle from order.
Figure 17. Table renderings of target objects in each of the orientations. Notice that in a real trial, only two objects (one blue and one red) would appear simultaneously, and another set of grey cubes would take the place of the third object. Figures A-F follow the same arrangement of condition as in Figure 6.
5.5 Measures
We measured error in angle and task completion time (TCT). The error in angle had two parts (Figure 16, right):
Virtual Volume Table Surface Longitudinal Vertical Planes
30°
Longitudinal-Vertical Plane
Perceived
Orientation OrientationPerceived
𝐸𝐸𝜃𝜃: the error within the longitudinal vertical plane (e.g., if the target pointed towards the end of the table with an angle of 60°, and the participant held the wand such that the string had an angle of 65° in the longitudinal vertical plane, the error was 5°).
𝐸𝐸𝜑𝜑: the error between the estimation and the projection of the estimation on the longitudinal plane (transversal error, or left-to-right error). Notice that the targets did not lean in this dimension, but some projections can make targets appear to lean.
The Euclidian combination of both angles sums up to the full error of the angle.
5.6 Experiment 1 Specific Hypotheses
This experiment was designed to isolate errors along the longitudinal vertical plane due to the change in discrepancy. In addition to H1-H5 (see Section 4.5) we derived two second-ary hypotheses:
H6: The type of projection geometry will affect 𝐸𝐸𝜑𝜑 (i.e., errors outside the plane in which the angle is varied).
H7: 𝐸𝐸𝜃𝜃 will be least when the object’s angle is horizontal (0°) and most when the object is vertical (90°). This hypothesis tests the differential rotation effect (DRE) [Goldstein 1987] (Section 3.2).
5.7 Results
The omnibus RM-ANOVAs for this experiment had a 5 discrepancy-parallax condition × 2 projection geometry × 2 location × 3 angle design. The results are discussed grouped by measure and then by hypothesis. For brevity’s sake, some hypotheses that were not sup-ported by the tests are not discussed explicitly for all measures6.
5.7.1 Error within the Longitudinal Plane (𝐸𝐸𝜃𝜃)
The omnibus ANOVA of the main error measure shows strong main effects of discrepancy-parallax (F1.662,38.222 = 127.395, p < .001, ηp2 = 0.847) and projection type (F1,23 = 12.621, p = .002, ηp2 = 0.254), as well as main effects of location and angle, as expected (location: F1,23 = 40.569, p < .001, ηp2 = 0.638; angle: F1.295,29.791 = 15.764, p < .001, ηp2 = 0.407). Many other interactions between factors are significant, but we will only discuss the most relevant7.
Projection type and discrepancy-parallax interact with each other (F3.331,76.721 = 22.825, p < .001, ηp2 = 0.498), which we then analyzed through planned post-hoc tests displayed in Figure 18 and Table 1.
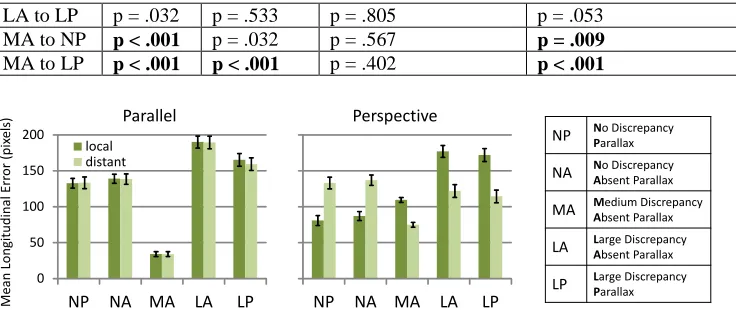
Figure 18. Average errors within the longitudinal plane for the orientation estimation task. Error bars indicate standard error.
Table 1. Planned comparisons for Experiment 1 (orientation estimation task). P-values highlighted with bold type indicate significant tests (α values are adjusted using the Holm-Bonferroni procedure).
Eθ Eϕ TCT
Parallel Perspective Parallel Perspective Parallel Perspective NA to MA p = .131 p < .001 p < .001 p < .001 p = .005 p = .814 MA to LA p < .001 p < .001 p = .015 p = .001 p = .008 p = .830 NP to NA p = .706 p = .803 p = .112 p = .084 p = .006 p = .022 LA to LP p = .525 p = .387 p = .005 p = .231 p = .011 p = .008 MA to NP p = .247 p < .001 p = .005 p < .001 p < .001 p = .059 MA to LP p < .001 p < .001 p = .430 p = .001 p < .001 p = .003
H1 is generally supported by the longitudinal error data; large discrepancy conditions (both with and without parallax) resulted in much larger errors than no-discrepancy condi-tions. These are supported by most of the relevant post-hoc tests. With perspective projec-tions, the medium discrepancy condition resulted in errors roughly between the no-discrep-ancy and the large discrepno-discrep-ancy conditions, which suggests a linear relationship between discrepancy and error. However, as we will discuss below, with the parallel projection, the medium discrepancy is equivalent to the no-discrepancy conditions.
H2.A and H2.B are not supported by the data, since the error levels of no-discrepancy conditions and large discrepancy conditions compared across projections are almost equiv-alent. H2 is therefore not supported. H3.A and H3.B are also not supported, since none of the parallax vs. no-parallax comparisons showed significant differences.
H4 (whether the medium-discrepancy case is special) is supported but only for the par-allel projection geometry: medium discrepancy in the parpar-allel condition has a lower aver-age error than the no-discrepancy conditions and is statistically indistinguishable from them, and statistically different from the large discrepancy cases. Figure 19 shows the source of the main difference between the projection types: 0° and 90° objects were judged very accurately in the parallel projections, but not in the perspective projection.
H7 (a verification of the Differential Rotation Effect – DRE) is generally confirmed by the results, and clearly visible in Figure 19, where the 0 angles (parallel to the surface of the table) showed almost always smaller errors than the 30 and 90 degree conditions.
A further analysis of the effect of location also shows a remarkable difference between the parallel and perspective conditions (Figure 20). With a perspective projection, the me-dium discrepancy condition is similar in its low errors to the no-discrepancy conditions when the objects are placed further away from the observer, whereas the average errors are equivalent to the large discrepancy conditions when the objects are further away. The par-allel projection, however, appears immune to this effect.
0 20 40 60 80
NP NA MA LA LP NP NA MA LA LP
Parallel Perspective
M
ea
n
Lo
ngi
tudi
na
l E
rr
or
(
°
)
NP NParallaxo Discrepancy
NA NAo Discrepancybsent Parallax
MA MAbsent Parallaxedium Discrepancy
LA LAarge Discrepancybsent Parallax
Figure 19. Average errors within the longitudinal plane (per angle) for the orientation estimation task. Error bars indicate standard error.
Figure 20. Average errors within the longitudinal plane (per location) for the orientation estimation task. Error bars indicate standard error.
5.7.2 Transversal Error (𝐸𝐸𝜑𝜑)
Analysis of the transversal error measures showed main effects of discrepancy parallax (F2.804,64.502 = 3.604, p = .02, ηp2 = 0.135), location (F1,23 = 10.519, p = .004, ηp2 = 0.314), angle (F1.415,32.538 = 36.332, p < .001, ηp2 = 0.612), and an interaction between projection type and discrepancy parallax (F1.886,43.275 = 19.64, p < .001, ηp2 = 0.461). The errors in the transversal error are (as expected) much lower than in the longitudinal dimension because the discrepancy between PoV and CoP is aligned in the longitudinal axis. However, as shown in Figure 21, different projections and levels of discrepancy produce distinct effects.
Figure 21. Average transversal errors for orientation estimation. Error bars show standard error.
H7 is supported by the data because, although the overall comparison between parallel and perspective projections was not significant, the interaction was, and the separate anal-ysis of the transversal error for the parallel and perspective conditions (Figure 21 and the post-hocs) shows a much different pattern. Although the size of errors is much smaller in the transversal direction (the scale of the bar chart is kept the same to avoid misleading
0 20 40 60 80
NP NA MA LA LP NP NA MA LA LP
0° 30° 90°
Parallel Perspective M ea n Lo ng itudi na l Er ro r ( ° )
NP NParallaxo Discrepancy
NA NAo Discrepancybsent Parallax
MA MAbsent Parallaxedium Discrepancy
LA LAarge Discrepancybsent Parallax
LP LParge Discrepancyarallax
0 20 40 60 80
NP NA MA LA LP
local distant
NP NA MA LA LP
Parallel Perspective M ea n Lo ng itudi na l Er ro r ( ° )
NP NParallaxo Discrepancy
NA NAbsent Parallaxo Discrepancy
MA MAbsent Parallaxedium Discrepancy
LA LAarge Discrepancybsent Parallax
LP LParge Discrepancyarallax
0 20 40 60 80
NP NA MA LA LP NP NA MA LA LP Parallel Perspective Me an Tr an sv er sal E rr or ( ° )
NP NParallaxo Discrepancy
NA NAbsent Parallaxo Discrepancy
MA MAbsent Parallaxedium Discrepancy
LA LAarge Discrepancybsent Parallax
impressions), the parallel non-discrepancy conditions show significantly larger errors, whereas for perspective projection it is only the medium discrepancy condition which is singled out with significantly more errors than all the other conditions.
5.7.3 Task Completion Time
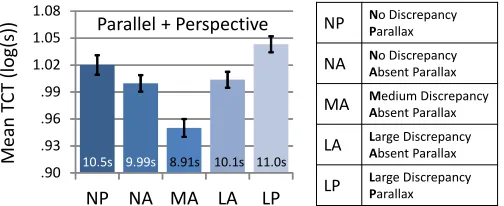
We performed a similar analysis on task completion times. The omnibus ANOVA showed a strong main effect of discrepancy-parallax (F4,92 = 12.414, p < .001, ηp2 = 0.351) and projection type (F1,23 = 12.621, p = .002, ηp2 = 0.354), but no significant main effects of location and angle (location: F1,23 = .249, p = .622, ηp2 = 0.011; angle: F2,46 = 1.464, p = .242, ηp2 = 0.06). The interaction between projection type and discrepancy parallax was significant (F3.378,77.683 = 2.977, p = .031, ηp2 = 0.115) and therefore we performed post-hoc tests separately on parallel and perspective conditions (Figure 22).
Figure 22. Average Task Completion Times (log-transformed) for the orientation estimation task. Num-bers at the bottom of the column represent the untransformed value in seconds for the average of the log-transformed completion times. Error bars represent standard error.
H1 is partially contradicted by the completion time data, since no-discrepancy condi-tions resulted in shorter completion times than the medium discrepancy condition for the parallel projection and resulted in similar completion times to the large discrepancy condi-tions in both parallel and perspective projeccondi-tions.
H2.A is not supported since comparisons of no-discrepancy conditions with perspective and parallel projections do not show an advantage for perspective – in fact, the averages seem to contradict this. H2.B is also not supported since large discrepancy conditions are symmetric to no-discrepancy conditions for both types of projection.
H3.A is partially contradicted, because the parallax condition takes longer to judge, which is exactly what H5 predicts. The results are consistent with H3.B, but it seems more plausible that the source of the increased completion time is parallax itself rather than a difference in difficulty of perceiving large discrepancy conditions with parallax. The sta-tistical support for the H3 hypotheses is only significant for one of the four tests (although the remaining three tests all approach significance). The results do not strongly support H3. H4 is supported by the time data for parallel projection, since the medium discrepancy parallel condition is, as shown clearly by the post-hoc tests, the fastest to judge (more than one second faster than the next fastest), and the medium discrepancy perspective condition is no slower than any of the other conditions with perspective projections.
5.7.4 Subjective Assessment
For the subjective measures, the omnibus ANOVAs of the rank-transformed data showed that the discrepancy-parallax factor had a main effect on the participants’ ratings of diffi-culty (F4,92 = 4.459, p = .002, ηp2 = 0.162) and preference (F4,92 = 4.364, p = .003, ηp2 =
.40 .60 .80 1.00
NP NA MA LA LP NP NA MA LA LP
Parallel Perspective
M
ea
n
TC
T
(lo
g(s
))
5.59s 4.56s 3.72s 4.71s 5.97s 6.14s 5.13s 5.21s 5.14s 6.41s
NP No DiscrepancyParallax
NA No DiscrepancyAbsent Parallax
MA Medium DiscrepancyAbsent Parallax
LA Large DiscrepancyAbsent Parallax
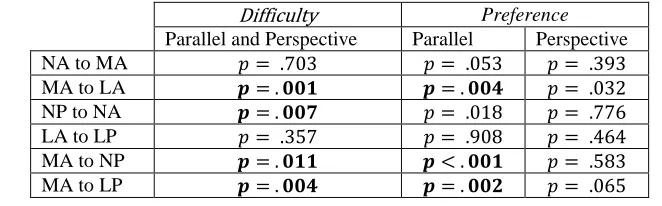
0.159). However, no interaction was found between discrepancy-parallax and projection geometry for either difficulty (F3.4,78.3 = 1.907, p = .13, ηp2 = 0.077) or preference (F3.4,78.3 = 1.907, p = .13, ηp2 = 0.022). The results of the planned post-hoc analyses are displayed in Table 28.
As expected, the statistical analyses of the subjective responses are less powerful than their objective measure counterparts and show fewer significant results. Nevertheless, the post-hoc tests provide some support for H1: larger discrepancy conditions were considered more difficult or were less preferred than the medium-discrepancy condition (Table 2). H2 and H3 are generally not supported. The medium-discrepancy condition had highest pref-erence scores, but the diffpref-erence was not significant.
Table 2. Planned comparisons for subjective Likert results of the orientation estimation task. Since the interaction between projection geometry and discrepancy was not significant, parallel and perspective responses were averaged and analyzed together.
Difficulty Preference
NA to MA p = .979 p = .366
MA to LA p = .128 p = .002
NP to NA p = .759 p = .930
LA to LP p = .055 p = .511
MA to NP p = .324 p = .323
MA to LP p = .005 p < .001
5.8 Summary and Discussion
The results of this experiment indicate that reducing discrepancy is generally beneficial for the accuracy of orientation estimation of objects with respect to the world. The evidence does not support a significant advantage of parallax for angle estimation; on the contrary, providing parallax results in longer estimation times. Perspective and parallel projections result in similar levels of error, with two notable exceptions: the medium discrepancy par-allel projection (CoP fixed above the table) resulted in the lowest errors, and the parpar-allel projections had larger side-to-side (transverse) error in the no-discrepancy conditions. A more detailed analysis showed that part of the general advantage in longitudinal error from the parallel medium discrepancy condition comes from how it is unaffected by the location of the stimuli in the table. Task completion times were also lowest for the parallel medium discrepancy condition. Additionally, the time data indicates that the presence of parallax results in longer judgment times, in exchange for no significant advantage in accuracy.
In practical terms, the results of this experiment suggest that: a) the medium discrep-ancy parallel condition is preferable if both time and accuracy are important; b) dynamic parallax takes extra time, but does not seem to help for angle perception; c) large discrep-ancy has a clear detrimental effect in accuracy with respect to medium discrepdiscrep-ancy and no-discrepancy conditions, and d) the parallel projection seems to have an advantage, espe-cially for medium discrepancy, in terms of time, resilience to the position of the stimuli, and general accuracy, but also results in slightly larger transversal errors in the no-discrep-ancy condition. Since the medium discrepno-discrep-ancy with parallel projection did not seem to be affected by this problem, this orientation task seems best performed by a parallel medium
discrepancy projection, which also has the advantage that it does not require sensing the position of viewers around it.
6 EXPERIMENT 2: INTERNAL STRUCTURE ESTIMATION
This experiment was designed to determine how discrepancy and projection type affect perception of object structure—participants were asked to estimate the internal spatial re-lationships of a simple triangular object. In this study the estimation does not involve the physical space around the table, but only internal relationships within the table space.
6.1 Participants
Twenty-four participants (13 female) completed this experiment (ages 18 to 33, Mdn = 26, SD = 5.2) and were recruited in pairs (4 all-female, 3 all-male, and 5 mixed). Participants performed a six-item Purdue spatial rotation test [Bodner and Guay 1997] previous to the experiment (correct answers, out of 6: M=4.44, Mdn=5). This study was conducted together with Experiment 3, and so upon completing this experiment, the same pair proceeded to Experiment 3.
6.2 Apparatus
We used the same table as described for Experiment 1 (see Section 5.2), but this time par-ticipant responses were entered using a stylus on a tablet PC (one per parpar-ticipant, 25 cm × 18 cm, resolution of 1024 × 768). Tablets were placed next to a participant on a music stand, tilted at 30° to match the stimuli on the table (see Section 6.3 and Figure 23). Par-ticipants were free to alter the height or location of the stand, but did not change the tilt.
Figure 23. 3D simulation of the apparatus for experiment 2. The participant provided input about their perception of objects through a pen on a tablet held by a tripod.
6.3 Task
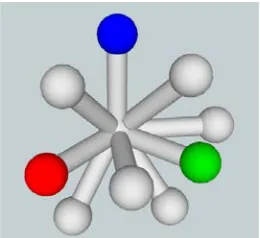
Participants had to match the relationships in a triangular shape representing a simple mol-ecule constructed with three spheres (nodes) and three grey long cylinders (links) connect-ing the spheres (see Figure 25 and Figure 26). The model to be matched appeared repre-sented in 3D on the table, and it had to be replicated by adjusting a 2D model on the tablet, next to the participant (Figure 23). To reduce complexity, the green and red nodes of the molecule were always in the same position. In different trials, the position of the blue node would vary, which effectively changed all the angles in the triangle. Consequently, partic-ipants just had to adjust the position of the blue node on the tablet, to try to reproduce what they perceived to be the shape of the molecule on the table.
of the table, rotated along the x-axis (parallel to the long side of the table, Figure 26). Correspondingly, the tablet computer was tilted to match the 3D model (Figure 23).
The position of the blue node was altered randomly along the x and y axis, but to avoid potential perceptual effects of symmetry and square angles, we limited the possible posi-tions to two square areas that would result in no symmetry in the molecule (Figure 26).
To provide their answers, participants tapped on the tablet PC to indicate the relative position of the blue node with respect to the red and green nodes, following similar methods described by Goldstein [1991]. The representation of the molecule on the tablet was planar (i.e., 2D geometrical shapes), which, combined with the tilting of the tablets and explicit verbal instructions to the participants, conveyed that the shapes on the response tablet’s screen represented the spatial shape of the object rather than a 3D view.
[image:25.504.181.329.497.604.2]Once both participants had entered their answers, the next trial would begin. The dis-tance from the red to green nodes on the table’s surface in the medium-discrepancy condi-tion with parallel geometry was 462 pixels (24.3 cm). The distance from the red to green circles on the tablets was 323 pixels (7.9 cm). This scaling was necessary due to the large difference in size between the tablets and the objects on the table. As in the first experiment, the quadrants of the table not used to display target objects were occupied by reference objects (sets of four cube molecules) using the same representation as the corresponding trial in order to provide some context (one example of these objects is also represented in Figure 27). As in Experiment 1, targets were always at the participant’s right, so they never estimated the structure of the same object simultaneously.
Figure 24. Diagram of the experimental setup for Experiment 2. The left diagram displays elements that concern only the task of participant 1. The right diagram shows the positions of all objects as the partici-pants were tested in pairs.
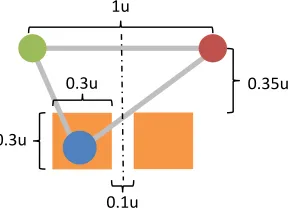
Figure 25. The position of the blue node was randomly selected within the two squares in the figure. These squares were not visible in the experiment. Distances are indicated relative to the distance between the green and red nodes, which was kept constant across all trials.
P1
x y z (out) far for P1
Tablet PC on music stand near for P1
P1 P2
far for P1 far for P2
Tablet PC on music stand
Tablet PC near for P2
near for P1
1u
0.35u
0.3u
0.3u
Figure 26. The position of the molecule in virtual space and the measures of error (Ex and Ey).
6.4 Procedure and Experimental Design
6.5 Measures
Both error and TCT were measured. Errors were considered along the x and y axes: 𝐸𝐸𝑥𝑥: the error measured along the x-axis of the table, calculated as the orthogonal distance between the measured and target positions of the blue node, expressed as a fraction of the distance between the green and red nodes (Figure 26).
𝐸𝐸𝑦𝑦: the error measured along the y-axis of the molecule (at 30° with respect to the y-axis of the table—see Figure 26), calculated as above.
6.6 Experiment 2 Specific Hypothesis
[image:27.504.77.425.90.399.2]The study was designed to isolate errors along the x-axis of the table (𝐸𝐸𝑥𝑥) due to the change in discrepancy. Thus, hypotheses referring to discrepancy (H1-H4, see Section 4.5) apply to the 𝐸𝐸𝑥𝑥 measure, and H5 still refers to the time measure. Additionally, the H6 hypothesis from Experiment 1 (that the type of projection geometry will affect 𝐸𝐸𝑦𝑦) applies to 𝐸𝐸𝑦𝑦 error.
6.7 Results
We performed a 5 discrepancy-parallax × 2 projection geometry × 2 location RM-ANOVA, and planned comparisons for pairwise differences. We report on transversal er-rors (error in x), longitudinal error (error in y), time, and subjective measures.
6.7.1 Error in 𝑥𝑥 (𝐸𝐸𝑥𝑥)
The omnibus ANOVA of the main error measure (Ex – longitudinal error) revealed signif-icant effects of discrepancy-parallax (F3.20,73.50 = 49.334, p < .001, ηp2 = 0.682) and an interaction between discrepancy-parallax and projection type (F3.36,77.22 = 16.836, p < .001, ηp2 = 0.423), but not of projection type (F1,23 = 2.944, p = .1, ηp2 = 0.113) or stimuli location (F1,23 = 2.365, p = .138, ηp2 = 0.093). Additionally, the interaction of all factors was also significant (F3.358,77.224 = 16.836, p < .001, ηp2 = 0.423). Because several of the interactions (notably projection type vs. discrepancy-parallax) were significant, we ran post-hoc com-parisons separately for parallel and perspective projections (see Table 3), and we display longitudinal error in Figure 299.
H1 is not supported by the longitudinal error data: although errors are slightly larger with large discrepancy, especially without parallax, than with no discrepancy, the surpris-ingly low error for the parallel medium discrepancy condition breaks the pattern. If there is a relationship between discrepancy and longitudinal error, this relation is not monotonic or, more likely, the medium discrepancy is a special case (H4).
H2.A is partially supported by the error data, since the error was larger in the low-discrepancy conditions for the parallel projections than for the perspective projection. However, the error was also larger for parallel projections in large-discrepancy conditions, which contradicts H2.B. Overall, H2 is not supported.
H3.A and B do not find any support in the data since none of the post-hocs comparing parallax with non-parallax conditions were significant and the figures show how, if these differences exist, they are very small. H3 is thus also not supported.
H4 (whether the medium-discrepancy case is special) is strongly supported by the data. Almost all post-hoc comparisons that include the medium discrepancy condition show how the error was significantly smaller in this condition.
A further analysis of the effects on error of the location of the stimuli shows an inter-esting difference between the parallel and perspective projections that is clearly visible in Figure 29. Each of the different discrepancy-parallax conditions in the parallel projection have very similar average errors for stimuli that appeared in the close and distant parts of the table. However, when projected in perspective, closer stimuli resulted in smaller errors for low discrepancy and larger errors for large discrepancy, an effect that is inverted for stimuli that are located further away.
Table 3. Planned comparisons for Experiment 2 (internal structure estimation)
EX EY TCT
Parallel Perspective Parallel+Perspective Parallel+Perspective
NA to MA p < .001 p = .004 p = .183 p = .006
MA to LA p < .001 p < .001 p = .192 p = .004
NP to NA p = .433 p = .415 p = .391 p = .384