Encoding complex valued fields using intensity
E
DOARDOD
ET
OMMASI,
1L
UIGIL
AVANGA,
1S
TUARTW
ATSON,
2 ANDM
ICHAELM
AZILU2,∗1Institute for Microelectronics and Microsystems, National Research Council, Via Castellino 111 80131
Naples, Italy
2SUPA, School of Physics and Astronomy, University of St Andrews, North Haugh, KY16 9SS St Andrews,
UK
Abstract: We present an approach enabling the representation of complex values using intensity only fields. The method can be used for imaging with structured illumination and allows the study of new propagating physical quantities with the classical coherent or incoherent light field playing the role of hidden variable. This approach can further be generalized to encode higher order
N-dimensional vectors and ensembles ofNorthogonal fields. Different orthogonal, incoherent illumination patterns (Hadamard, sinusoidal, Laguerre-Gauss) have been experimentally tested in a single-pixel detection imaging scheme in order to compare their performances in terms of obtainable resolution. We show experimentally that our encoding technique allows to reduce the required number of illuminations for a given, desired resolution.
Published by The Optical Society under the terms of theCreative Commons Attribution 4.0 License. Further distribution of this work must maintain attribution to the author(s) and the published article’s title, journal citation, and DOI.
OCIS codes:(110.1758) Computational imaging; (110.2960) Image analysis; (110.3010) Image reconstruction
techniques; (210.1635) Coding for optical storage; (230.6120) Spatial light modulators.
References and links
1. A. R. Hibbs,Confocal Microscopy for Biologists(Springer, 2004).
2. A. Diaspro,Confocal and Two-Photon Microscopy: Foundations, Applications and Advances(Wiley, 2001). 3. A. Diaspro, P. Bianchini, G. Vicidomini, M. Faretta, P. Ramoino, and C. Usai, “Multi-photon excitation microscopy,”
Biomed Eng Online.5, 36 (2006).
4. S. Stewart, R. J. Priore, M. P. Nelson, and P. J. Treado, “Raman imaging,” Annu. Rev. Anal. Chem.5, 337-360 (2012).
5. L. Opilik, T. Schmid and R. Zenobi, “Modern Raman imaging: vibrational spectroscopy on the micrometer and nanometer scales,” Annu. Rev. Anal. Chem.6, 379-398 (2013).
6. A. D. Rodrìguez, P. Clemente, E. Irles, E. Tajahuerce, and J. Lancis, “Resolution analysis in computational imaging with patterned illumination and bucket detection,” Opt. Lett.39, 3888-3891 (2014).
7. H. Rueda, H. Arguello, and G. R. Arce, “DMD-based implementation of patterned optical filter arrays for compressive spectral imaging,” J. Opt. Soc. Am. A32, 80–89 (2015).
8. G. G. Stokes, “On the perfect blackness of the central spot in Newton’s rings, and on the verification of Fresnel’s formulae for the intensities of reflected and refracted rays,” Cambridge Dublin Math. J.4, 1–14 (1849). 9. H. von Helmholtz,Handbuch der physiologischen Optik(Leopold Voss, 1856).
10. F. Soldevila, E. Irles, V. Duran, P. Clemente, M. Fernàndez-Alonso, E. Tajahuerce, and J. Lancis, “Single-pixel polarimetric imaging spectrometer by compressive sensing”, Appl. Phys. B,113, 551–558 (2013).
11. Y.-X. Ren, R-D. Lu, and L. Gong, “Tailoring light with a digital micromirror device,” Ann. Phys.527, 447–470 (2015).
12. V. Studer, J. Bobin, M. Chahid, H. S. Mousavi, E. Candes, and M. Dahan, “Compressive fluorescence microscopy for biological and hyperspectral imaging,” PNAS109, E1679-E1687 (2012).
13. M. F. Duarte, M. A. Davenport, D. Takhar, J. N. Laska, T. Sun, K. F. Kelly, and R. G. Baraniuk, “Single pixel imaging via compressive sampling,” IEEE Signal Proc. Mag.25, 83-91 (2008).
14. F. J. Salgado-Remacha, “Laguerre-Gaussian beam shaping by binary phase plates as illumination sources in micro-optics,” Appl. Opt.53, 6782-6788 (2014).
15. T. Vettenburg, H. I. C. Dalgarno, J. Nylk, C. Coll-Lladó, D. E. K. Ferrier, T. ˘Ci˘zmár, F. J. Gunn-Moore, and K. Dholakia, “Light-sheet microscopy using an Airy beam,” Nat. Methods11, 541–544 (2014).
16. A. C. De Luca, S. Kosmeier, K. Dholakia, and M. Mazilu, “Optical eigenmode imaging,” Phys. Rev. A,84, 021803 (2011).
17. J. Gourlay, P. McOwan, D. G. Vass, I. Underwood, and M. Worboys, “Time-multiplexed optical Hadamard image transforms with ferroelectric-liquid-crystal-over-silicon spatial light modulators,” Opt. Lett.201745-1747 (1993). 18. Z. Zhang, X. Ma, and J. Zhong, “Single-pixel imaging by means of Fourier spectrum acquisition,” Nat. Commun.
6, 6225 (2015).
19. S. Kosmeier, S. Zolotovskaya, A. C. De Luca, A. Riches, C. S. Herrington, K. Dholakia, and M. Mazilu, “Nonre-dundant Raman imaging using optical eigenmodes,” Optica1, 257-263 (2014).
20. M. Chen, K. Dholakia, and M. Mazilu, “Is there an optimal basis to maximise optical information transfer,” Sci. Rep.6, 22821 (2016).
21. R. T. Farouki,Pythagorean-Hodograph Curves: Algebra and Geometry Inseparable, (Springer, 2008). 22. E. De Tommasi, L. Lavanga, S. Watson, and M. Mazilu, “Data underpinning - Encoding complex valued fields
using intensity," University of St. Andrews, St. Andrews, UK, 2016, DOI:10.17630/ac1bd5b8-b6a6-437a-9db1-979e30670261.
1. Introduction
In a conventional imaging system, the light coming from a source uniformly illuminates the object to be imaged. The reflected, scattered, transmitted or diffused light is then typically collected and detected by a CCD camera, characterized bym×npixels. In this case, the resolution of the final image depends on the total number of pixels used. However, the direct use of anm×narray of detectors is not always possible. Many applications such as confocal [1], two-photon [2, 3], Raman [4] and CARS [5] microscopies are relying on pixel-by-pixel scanning and in these cases the resolution is linearly proportional to the acquisition time. The higher the number of single acquisitions, the higher the final resolution and the total acquisition time. This makes it difficult to perform spectral imaging on a living (i.e. moving) sample such as a single cell [6, 7].
On the other hand, Helmholtz reciprocity principle [8, 9] allows to transfer the information relative to spatial resolution from the detector to the illumination side, reducing the detector itself to a “single pixel” device (e.g. a photodiode or a spectrometer [10]). In this case, it is the light emitted by the source that is used to encode more or less complex illumination patterns by means of a spatial light modulator. A digital-micromirror-device (DMD), for example, can reach refresh rates of tens of kHz, allowing the change of the illumination pattern in a short time interval [11]. Each pattern acts like a probe enabling the detection of higher spatial information of the imaged object as the spatial complexity of the illumination increases. The main application of this approach are hyper-spectral microscopy [12] and imaging in wavelength ranges in the absence of CCD or CMOS technology [13].
Depending on the physical properties of the illumination source, it is possible to distinguish between different families of illumination patterns. In the case of coherent illumination, there are many possible beams that can be used to illuminate/excite the sample, such as Laguerre-Gauss beams [14], Airy beams [15] and optical eigenmode beams [16]. In the case of incoherent illumination, Hadamard patterns [17] are used to illuminate the samples. In both cases, the use of orthogonal patterns offers advantages in terms of easy of image reconstructions [18] and in obtaining efficient non-redundant imaging [19]. Orthogonality is achieved when the dot product between the complex fields associated with two beams is zero. However, in the case of incoherent illumination it is difficult to access real orthogonality as the incoherent intensity is a positively defined quantity and not many intensity illumination profiles are orthogonal to each other with respect to this definition. Indeed, only non-overlapping intensity beams are orthogonal to each other. It is therefore advantageous to redefine the problem such that it would be possible to detect negative and complex valued intensities.
In the present paper, we introduce a new way to encode phase and amplitude on intensity-only light patterns. The encoding is based on the representation of complex numbers in a quasi 3D-space involving only positive decomposition coefficients. Going beyond structured illumination, this technique can be used to create new propagating physical quantities where classical electromagnetism plays the role of hidden variable. Here, we consider three different orthogonal incoherent light patterns (Hadamard, sinusoidal and Laguerre-Gauss probes) that we
use in a single-pixel detection scheme. We compare their performance in terms of resolution by retrieving the point spread function (PSF) of the system and by comparing the reconstructed images of several extended targets with the original. Finally, we extended the encoding technique to any set ofNorthogonal fields by representing it in quasiN+1 dimensional space.
2. Negative and complex valued “intensity”
The fundamental idea of structured illumination is to expand the number of optical degrees of freedom (ODoF) detected when imaging by replacing uniform illumination with a family of light fields. Here, the ODoF are defined by the number of linearly independent optical fields that are supported within a finite optical system where linear independence is equivalent to orthogonality [20]. However, in order to achieve general orthogonality the fields need to be able to take positive/negative or complex values. In the case of coherent monochromatic illumination this can be achieved using the phase and amplitude of the electric field. On the other hand, the intensity of incoherent light fields is always positive and as such we need to define a different way to “encode” negative or complex values in the incoherent field.
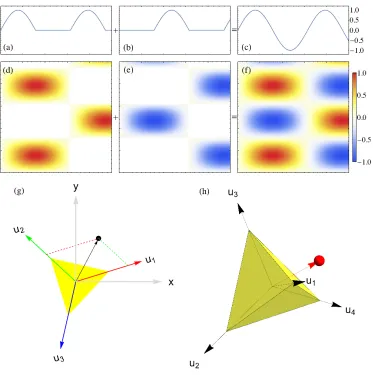
A simple way to encode negative intensities is to use two light patterns for each probe; one to encode the positive part of the illumination and one for the negative part. The intensity measured for the second pattern is then subtracted from the one obtained from the first pattern. This encoding process in represented in Figs. 1(a)-1(f) for a sinusoidal function in one and two dimensions. This procedure implies that, ifNreal valued probes are to be used in a sequence of measurements, then the number of actual illuminations will be 2N. We note here that from a practical point of view, the order of these measurements is important. Indeed, an improved signal to noise ratio (SNR) can be achieved by alternating addition and subtraction rejecting low frequency background fluctuations akin to a lock-in amplifier.
Complex valued field encoding generalizes this idea from the 1-D real axis to the 2-D complex plane. To achieve this we use what we termed the2-simplexencoding technique. Let us consider a complex numberz=x+iywithx,y∈ℜ. Both real and imaginary parts can assume positive or
negative values, so, according to previous approach, for a single complex probe 4 illuminations would be needed. Figure 1(g) illustrates that using the2-simplexconvention only three patterns are necessary: the2-simplexcorresponds to an equilateral triangle and the vectors linking its barycenter to the three vertices are splitting the 2-D plane into three equal parts. Each point in the plane will lie in one of these three parts and can be written as a convex superposition of two of the three vectors partitioning the plane. We can therefore represent a complex number by two positive numbers and one zero component. This encoding convention is a variation of the convex combination in the case of barycentric coordinate system [21]. Using the2-simplex
coordinate system we need to project only 3 illuminations to create a complex valued pattern instead of the 4 illuminations needed when using twice the real valued encoding method. To illustrate, we associate each of the three illuminations with one of the three fundamental colors red, green and blue (corresponding to three intensitiesr,g,b∈ℜ+). Practically, the use of colors
has the potential of replacing the sequential illumination by parallel measures as one can detect the intensities from the three color channels independently from each other.
The2-simplexencoding can be considered as a particular case of the more generalized N-simplextechnique (see Fig. 1(h) for the3-simplex) which can be used to encode higher order vectors of any dimensions. In the general case, we consider aN-dimensional real vector space that is partitioned using the barycentre-vertex vectors of anN-simplexintoN+1 equal parts. Using the same procedure as before, we can represent theNreal values by defining the illumination using N+1 positive values corresponding to the decomposition of the vector in its convex sub-space and one zero component. To represent the whole vector, we needN+1 illuminations instead of 2N.
Fig. 1.(a-f)A single element of a sinusoidal pattern can be expressed as the difference of two elements with no negative values.(g)2-simplexencoding: a complex numberz
can be represented in the complex plane with componentsxandyrespect to the real and imaginary axis or in a three-dimensional “rgbspace" where the components ofzcan assume only positive values and at least one of them equals zero.(h)3-simplexencoding: for each pixelP, a set of 3 orthogonal fields can be represented in a 3-dimensional space with real componentsx,y,zor in a 4-dimensional space with real, positive componentsr,g,b,c, where at least one of them equals zero.
intensity going beyond a complex scalar field to encode higher order vector fields. Indeed any kind of fields can be used and the laws which govern the evolution of the encoded quantities can be changed through the interplay between the encoding mechanism itself and the propagation of the underlying fields. In effect, the underlying fields become hidden variables that can only be observed as statistical fluctuation within the encoded fields. To illustrate this possibility, we consider the following red, green and blue time dependent intensities:
Ir,g,b(t) =A(1+cos(ωt+∆r,g,b)) (1)
whereAis the field amplitude and the three phase delays∆r=0,∆g=2π/3 and∆b=2π/3.
The evolution of the scalar fieldV(t)in the complex z-plane is defined by
V(t) =Ir(t)ur+Ig(t)ug+Ib(t)ub=
3A
2 exp(iωt) (2)
withur= (1,0),ug= (−1/2,
√
3/2)andub= (−1/2,−
√
3/2)defining the three vertex vectors of the2-simplex. This complex field corresponds to a color coded “monochromatic wave” that propagates with the speed of light but not bound by the dispersion relationship linking wave-vector and frequency.
Furthermore, it is worth highlighting that this procedure is not restricted to the encoding onto incoherent fields. Similar results can be achieved using the modulated intensity of coherent beams defined by the beating of two coherent monochromatic waves
fr,g,b(t) =a(cos((ωr,g,b+ω/2)t+∆r,g,b) +cos((ωr,g,b−ω/2)t−∆r,g,b)), (3)
whereωr,g,bdefine three monochromatic carrier waves respectively in the red, green and blue
spectral region. These superpositions deliver the intensities
ir,g,b(t) = fr2,g,b(t) =a
2(1+cos(
ωt+∆r,g,b))(1+cos(2ωr,g,bt)) (4)
where the last term disappears when averaging the signal over the optical period of the carrier wave. However, when considering instantaneous measures then the carrier wave come across as stochastic fluctuations governed by hidden variables.
In the following, to illustrate a possible application of this encoding approach, we use the complex field andN-simplexencoding in the case of incoherent structured illumination for single pixel imaging.
3. Results and discussion
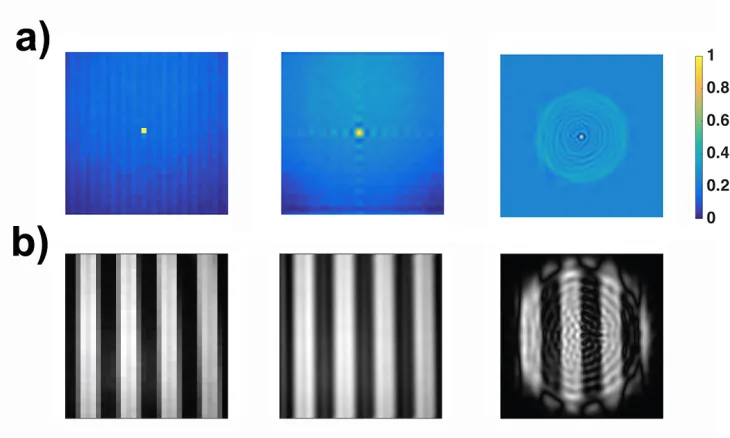
One of the criteria helping distinguish between different families of structured illumination is considering the point spread function (PSF) associated with each family. Here, we experimentally measure the PSF by imaging a point excitation for the system. To achieve this, we made use of a small piece of silver paper put onto a black velvet screen. For it to act as a two-dimensional delta function, it has to be smaller than the smallest feature of the pattern of highest cardinality (equivalent to highest spatial frequency). Some results, for given numbers of probes, are reported in Fig. 2(a). We observe that the PSF obtained using the LG illumination patterns is accompanied by circular sidebands related to the symmetry of Laguerre-Gauss modes (see Eq. (8)). This implies that, even though LG beams guarantee the best performance in terms oflocalresolution (at the center of the imaging domain). This is further illustrated when imaging extended targets where we observe that there is a decrease in off axis resolution for these same illumination family.
This behavior can be understood in terms of local density of ODoF as introduced in [20]. If
tj(x,y)is the detected local intensity associated to each illumination, the local density of ODoF
can be defined as:
ρ(x,y) =
∑
j
tj(x,y) (5)
provided that the illuminationstj(x,y)are orthogonal to each other. Thus, when illumination
Fig. 2. Experimentally retrieved PSFs obtained by making use of 1024 Hadamard probes, 841 sinusoidal probes and 810 LG beams, respectively(a); examples of reconstructions of target 3 for a given cardinalityNusing respectively: 1024 binary masks generated from Hadamard matrices, 625 sinusoidal probes, and 816 LG beams(b).
(FWHM) of the experimental PSF, is higher in the case of the LG probes compared to Hadamard and sinusoidal probes.
Another approach to compare different families of illumination is by imaging larger samples. The four extended targets we used for image retrieval are reported in Appendix. They consist of vertical black and white stripes of increasing density. The presence of straight edges of increasing spatial frequency allows an accurate determination of contrast and retrieval accuracy as a function of the number of illuminating probes. Examples of retrieved images of target number 3 when illuminated using different probes are reported in Fig. 2(b). Contrast has been defined as the standard deviation (SD) of the intensity histogram associated to the image; the bigger the SD, the bigger the contrast. Plots of the contrast as a function of the number of probes, for different targets and illumination patterns is reported in Fig. 4(a). In general, we observe an increase in contrast with the number of projected probes until a more or less pronounced plateau is reached. For Hadamard patterns, due to the binary nature of the corresponding matrices, the SD value reached in the plateau is higher than that relative to sinusoidal and LG patterns, even though the plateau itself is reached by projecting a bigger number of probes.
The accuracy in the reproduction of the targets has been evaluated in terms of Mean Squared Error (MSE) along a linear section of the retrieved image:
MSE= 1
NP NP
∑
j=1(xj−xˆj)2 (6)
whereNPis the total number of pixels along the considered section;xjis the intensity value of
thej-th pixel of the retrieved image and ˆxjis the corresponding value in the target. As can be
seen in Fig. 4(b), a general decrease in MSE as a function of the number of probes is observed for all the considered patterns and for all targets.
The results presented so far relate to the negative and complex intensity encoding method. However, our approach allows for the generalization of the method to encode higher dimensional
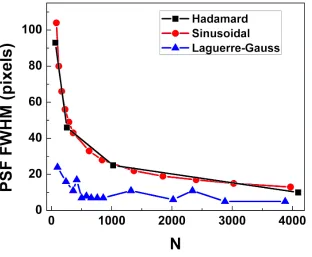
Fig. 3. Full width half maximum (FWHM) of the point spread function (PSF) as a function of the number of probes for different families of structured illumination.
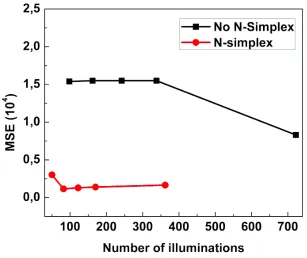
vectors spaces using theN-simplexalgorithm. Let’s considerNsinusoidal probes illuminating our target. In Fig. 5 MSE is plotted, not as a function of the number of probes but as a function of the number of illuminations needed to encode the probes. As it can be see, the use ofN-simplex
encoding strongly affects the accuracy in target reconstruction and allows to reach significantly lower values of MSE for a number of illuminations quite below the ones necessary in its absence. This can be understood by considering the distributive effects of theN-simplexalgorithm on the actual illumination. Indeed, theN-simplexalgorithm mixes equally all orthogonal probes in each illuminations.
4. Conclusions
Fig. 4. Standard deviation (SD) of the intensity histograms(a)and mean squared error (MSE) evaluated along a linear section of the targets(b)as a function of the number of probes for Hadamard (left), sinusoidal (center) and Laguerre-Gauss (right) patterns. Black, red, blue and dark cyan plots refer respectively to Targets 1, 2, 3, and 4 as defined in Fig. 6(c).
5. Appendix A: Numerical simulations
In order to test the proposed technique and evaluate its performance in terms of resolution, we made use of a numerical model that simulates the whole process of illumination of the target and retrieval of its image. In our model the correlation between the orthogonal illumination patterns
E1, ...,EN and the illuminated target provides a series of coefficientsa1, ...,aN. Every coefficient
airepresents the weight of theN-thpattern in the reconstruction algorithm:
ˆ
I=
∑
iaiEi i=1, ...,N (7)
where ˆIis the image to be reconstructed. In these scheme thea1, ...,aN coefficients represent the
detected signals corresponding to every illumination.
We made use of three different families of illumination patterns: binary masks generated from Hadamard matrices, continuous grey scale sinusoidal patterns and Laguerre-Gauss (LG) beams, encoded by the methods reported in section 2 (see Fig. 1).
In particular, for LG beams we considered two different families of functions, distinguished by a different way to define their cardinality. In general, a LG mode is defined as follows:
u(r,φ,z) = Cl p
w(z)
r√2
w(z)
!|l|
e− r2 w2(z)L|l|
p
2r2 w2(z)
·e−ik r2
2R(z)eilφe[i(2p+|l|+1)ζ(z)] (8)
Fig. 5. Mean Squared Error along a linear section in image reconstruction of Target 3 as a function of the number of illuminations and for sinusoidal probes, with (red) and without (black) the application ofN-simplexencoding.
distance from the beam waist along the axis itself;Cl pis a normalization constant;pandlare the
radial and azimuthal parameters;w(z)is the spot size along the axisz;kis the wavenumber;R(z)
andζ(z)are the radius of curvature and the longitudinal phase delay atz, respectively; finallyLlp
are the generalized Laguerre polynomials defined as follows:
Llp(x) =x −lex
p!
dp
dxpe
−xel+p (9)
We defined two kinds of cardinality, which determine two ways of ordering the beams themselves. We called Laguerre-Gauss LG1the ones ordered according to the following cardinalityN:
p=0, ...,N; l=−p, ...,p (10)
while the Laguerre-Gauss beams LG2of orderNare defined by:
n=2p+|l| n=0, ...,N; (11)
Fig. 6.(a)Tested illumination patterns: binary mask generated by Hadamard matrix; continu-ous grayscale sinusoidal pattern;2-simplexencoded Laguerre-Gaussian beam.(b)2-simplex
encoding of a Laguerre-Gauss beam. Every complex value of phase is decomposed inrgb
space where every component corresponds to a fundamental color.(c)Extended targets used in image retrieval.(d)Schematic layout of the experimental set-up. PC: personal computer; DLP: digital light projector; PD: photodiode; DAQ: data acquisition board.
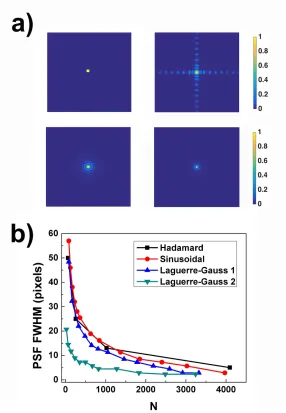
Figure 7(b) shows the full-width at half maximum (FWHM) of the retrieved PSFs as a function of the number of probes for the different tested pattern families. We can observe that Hadamard and sinusoidal patterns present more or less the same performances in terms of resolution, with an improvement of sinusoidal ones respect to Hadamard for high number of illuminations. The most surprising result, on the other way, is the noticeable difference in behaviour of LG1beams respect to LG2ones, with remarkably better performances for the latter. This means that not only the number of probes, but also the order in which they are projected onto the target determines a dramatic difference in the resolution obtained by the system.
6. Appendix B: Experimental Setup
The schematic layout of our experimental set-up is shown in Fig. 6(d). A digital light projector (DLP Light Crafter 4500, Texas Instruments) sequentially illuminates the target, whose image is to be reconstructed, by a set of orthogonal structured light patterns (or probes) generated by a computer. The intensity of the backscattered light is collected by a photodiode (PDA36A-EC, Si Switchable Gain Detector, Thorlabs) acting as a single-pixel detector, whose output signal is digitized by a DAQ board (NI USB-6351, National Instruments) and sent back to the computer to feed the reconstruction algorithm. This is based on the correlation between the projected pattern and the measured backscattered intensity, i.e. each measured value is used as a coefficient to weight the corresponding probe, and the weighted sum of the patterns provide the reconstructed image (see Eq. (7)). The DLP is composed by two principal elements: a digital micro-mirror device (DMD) and a light engine composed by three colored (red, green and blue) light emitting diodes (LEDs). The DMD consists of a matrix of electronically controlled micro-mirrors, acting as a reflective spatial light modulator on the light coming from the LEDs.
Fig. 7. Simulated PSFs for Hadamard (N=1024), sinusoidal (N=841), LG1(810) and LG2
(N=820) probes respectively(a); FWHM of PSFs as a function of the number of probes for the different illumination patterns(b).
The DLP also provides trigger signals that allow a synchronization between the illumination and the acquisition processes. Both the DAQ and the DMD were controlled by customized Matlab scripts. The pattern generation, data treatment and reconstruction algorithm were implemented in Matlab environment, too.
7. Appendix C: Patterns encoding
first built setting to zero all the negative values of the starting mask, and the second setting to zero all the negative values of the inverted mask. These masks were loaded on the DMD, after a rendering via software in order to obtain continuous values, and projected working with all the three LED sources permanently on. By subtracting the measured values of the two masks we could simulate a negative intensity and obtain the intensity values of the original pattern.
For LG beams, according to 2-simplex encoding technique, each complex value of phase corresponds to a triad of positive numbers associated to red, green and blue channels. For each pattern we end up with three new masks obtained turning on only the corresponding LED and maintaining the other two off. The three projected colored patterns give rise to three measured intensity values. After a calibration procedure that takes into account the different sensitivity of the detector to the different colors, the three values are converted back to a unique complex value by an inverse 2-simplex transformation; the result is finally used as weight for the corresponding complex pattern in the reconstruction algorithm.
Research data
The research data supporting this publication can be accessed at [22].
Acknowledgments
We thank the UK Engineering and Physical Sciences Research Council for funding (EP/K503940/1).