Magnetic Order and Spin Model of the Buckled Kagome Lattice Material Cu3Y(SeO3)2O2Cl
K.V. Zakharov,1 E.A. Zvereva,1 P.S. Berdonosov,2 E.S. Kuznetsova,2 V.A. Dolgikh,2 L. Clark,3 C. Black,3 P. Lightfoot,3 W. Kockelmann,4 Z.V. Pchelkina,5,6 S.V. Streltsov,5,6 O.S. Volkova,1,6
and A.N. Vasiliev*1,6,7
1
Low Temperature and Superconductivity Department, Faculty of Physics, M.V. Lomonosov Moscow State University, Moscow 119991, Russia
2
Inorganic Chemistry Department, Faculty of Chemistry, M.V. Lomonosov Moscow State University, Moscow 119991, Russia
3
School of Chemistry, University of St Andrews, St Andrews, Fife KY16 9ST, UK
4
ISIS Facility, Rutherford Appleton Laboratory, Didcot, Oxfordshire OX11 0QX, UK
5
Institute of Metal Physics, Russian Academy of Sciences, Ekaterinburg 620219, Russia
6
Theoretical Physics and Applied Mathematics Department, Institute of Physics and Technology, Ural Federal University, Ekaterinburg 620002, Russia
7
National University of Science and Technology "MISiS", Moscow 119049, Russia
We report a detailed study of the magnetic properties of the buckled kagome compound Cu3Y(SeO3)2O2Cl using heat capacity, magnetization, powder neutron
diffraction, electron spin resonance and first-principles calculations. The crystal structure is confirmed to be isotypic with the mineral francisite, with orthorhombic space group symmetry Pmmn throughout the temperature range 5 – 300 K. Magnetization, heat capacity and neutron diffraction confirm long range magnetic order below TN = 35 K. The electron spin resonance spectra reveal the presence of two modes corresponding to two different crystallographic Cu positions. The principal g-values of the g-tensor of Cu(1) sites were found to be g1 = 2.18(4), g2 = 2.10(6) and g3 = 2.05(9), while the effective g-factor of Cu(2) sites is almost isotropic and is on average g = 2.09(5). At low temperatures, Cu3Y(SeO3)2O2Cl
undergoes a metamagnetic transition, with a critical field BC = 2.6 T at 2 K, due to the suppression of the inter-plane exchange interactions and saturates in modest magnetic field, BS 8 T. The first-principles calculations allow an estimation of both intra-plane and inter-plane exchange interactions. The weakness of the inter-plane exchange interaction results in low values of the critical fields for the metamagnetic transition, while the competition between intra-plane exchange interactions of different signs results in a similarly low value of the saturation field.
INTRODUCTION
The diversity of crystal structures and the peculiar magnetic topologies found in minerals has attracted increasing attention of condensed matter physicists interested in quantum cooperative phenomena at low temperatures [1-5]. Among the recently discussed hot topics in this field are the pressure-induced superconductivity in calaverite AuTe2 [6,7] and the formation
of the gapped (or gapless) quantum spin liquid ground state in Herbertsmithite ZnCu3(OH)6Cl2
[8-11].
The title compound, Cu3Y(SeO3)2O2Cl, is a synthetic analogue of the mineral francisite
Cu3Bi(SeO3)2O2Cl, which crystallizes in the orthorhombic space group Pmmn with cell
[13] and investigations of magnetism and optical birefringence in its synthetic analogues Cu3Bi(SeO3)2O2X (X = Cl, Br, I) [14]. At low temperatures, long-range magnetic order was
established in both Cl-based and Br-based compounds. The variation of the halogens in these phases results in a regular increase of unit cell parameters and elongation of the corresponding bonds. Hence, the magnetic properties of the bismuth oxohalides are very similar, with Néel temperatures of 24.2 K and 23.8 K in the oxychloride and oxybromide, respectively [13].
Subsequent studies have concentrated on Cu3Bi(SeO3)2O2Br. Anisotropic magnetic
properties in this compound have been studied by bulk magnetization measurements as well as powder and single-crystal neutron diffraction [15]. At TN = 27.4K the system develops an
alternating antiferromagnetic order of the kagome layers, which individually exhibit a canted ferrimagnetic moment shown in Figure 2, resulting from competing ferro- and antiferromagnetic intra-layer exchange interactions. A magnetic field BC∼0.8 T applied along the c-axis triggers a
metamagnetic transition, where every second layer flips resulting in a ferrimagnetic structure. Significantly higher fields are required to rotate the ferromagnetic component towards the b-axis (∼7 T) or towards the a-axis (∼15 T). Terahertz transmission spectra have been measured as a function of temperature and magnetic field on single crystals of Cu3Bi(SeO3)2O2Br [16]. In
time-domain spectra in the absence of an applied magnetic field, two resonance absorptions were observed below TN. The corresponding resonance frequencies increase with decreasing temperature reaching energies of 1.28 and 1.23 meV. Multifrequency electron spin resonance transmission spectra as a function of the applied magnetic field show the field dependence of four magnetic resonance modes, which were modeled as a ferromagnetic resonance.
Chemical substitutions can have a significant impact on the crystal structure and ensuing physical properties. For example, the replacement of selenium by tellurium induces a substantial
transformation of the parent structure. In Cu3Bi(TeO3)2O2Cl, this results in the change of one of
the copper coordinations from a CuO4 square plane to a CuO4Cl square pyramid. This leads to a
doubled c parameter and a change in the space group to Pcmn [17]. On the other hand, the
original Pmmn structure was reported for the erbium analogue of francisite, Cu3Er(SeO3)2O2Cl
[18] and no substantial variations in orthorhombic crystal structure were found for the series of
lanthanide oxohalides Cu3Ln(SeO3)2O2X (Ln = La, Nd, Sm, Eu, Gd, Dy, Ho, Er, Yb, Y; X = Cl,
Br). The oxochlorides were formed with all lanthanides, while oxobromides were formed for Ln = La–Gd only [19].
In this present work, we report the first detailed study of the magnetic properties of
Cu3Y(SeO3)2O2Cl with heat capacity, magnetization, neutron diffraction and electron spin
resonance (ESR) studies, supported by first-principles calculations to determine the underlying spin model. This provides an important comparison to the previously well studied analogue
Cu3Bi(SeO3)2O2Br, which displays a unique non-collinear magnetic structure as a result of its
interesting layered and magnetically frustrated topology. Instead of exhibiting the standard
“spin-flop – spin-flip” succession of phase transitions, Cu3Bi(SeO3)2O2Br undergoes a
metamagnetic transition, as discussed above. It is important to determine whether this
spectacular metamagnetic response is a general feature of the francisite family. To eliminate the complications of an additional magnetic sublattice due to a rare earth cation the yttrium-substituted compound was chosen.
EXPERIMENTAL
Cu3Y(SeO3)2O2Cl was prepared from a stoichiometric mixture of high purity Y2O3, CuO,
CuCl2 and SeO2. The selenium dioxide was obtained from selenous acid, which was dehydrated
under dynamic vacuum at a moderate temperature and then sublimed in a flowing mixture of dry
air and NO2 prepared by thermal decomposition of Pb(NO3)2. All preparatory procedures with
SeO2 were carried out in a dry box purged with argon. The stoichiometric reactant mixture was
to 575°C over 12 hours and maintained at this temperature for 72 hours. This produced a green-colored powder product. Preliminary characterization used powder X-ray diffraction collected on a STOE Stadi P diffractometer equipped with a Ge (111) monochromator (Cu Kα radiation, 2θ range 10–115°), which confirmed phase purity according to the previously suggested structural model [19].
Magnetization and susceptibility data were taken on a Quantum Design Physical Property Measurement System (PPMS) over the temperature range 2 – 300 K in applied field strengths up
to 9 T. Heat capacity was measured on a 10 mg sample of Cu3Y(SeO3)2O2Cl in the same PPMS
instrument using the relaxation method in the temperature range 2 – 300 K. Powder neutron
diffraction data were collected for Cu3Y(SeO3)2O2Cl on the GEM diffractometer at the ISIS
spallation neutron source, Rutherford Appleton Laboratory. A 5.18 g powder sample was loaded into an 8 mm outer diameter vanadium can such that the sample covered the 400 mm height of the neutron beam. The sample was placed into a 4He cryostat and diffraction data were taken over the temperature range 5 – 280 K. Rietveld analysis of the data was performed using the GSAS software [20]. ESR studies were carried out using an X-band ESR spectrometer CMS 8400 (ADANI) (f9.4 GHz, B0.7 T) equipped with a low temperature mount, operating in the range T= 5–300 K. The effective gfactor has been calculated with respect to a BDPA (a,g -bisdiphenyline-b-phenylallyl) reference sample with get = 2.00359. The first-principles
calculations were performed on the Uran cluster of the IMM Ural Branch of RAS.
RESULTS AND DISCUSSION
Figure 3 shows the temperature dependence of the magnetic susceptibility of Cu3Y(SeO3)2O2Cl measured in various applied magnetic fields up to 9 T. At lower fields, the
susceptibility data show a sharp peak characteristic of antiferromagnetic order at a Néel temperature TN = 36.3 K. The inset to Figure 3 shows the magnetic susceptibility measured in a 0.1 T field, which exhibits a one third drop for temperatures T<TN consistent with an easy-axis antiferromagnet. An increase in the applied magnetic field strength results in a broadening of the pronounced ordering transition and an apparent shift to higher temperatures. Eventually, the nature of the magnetic susceptibility becomes ferromagnetic for applied fields B > 4 T. The temperature dependence of the susceptibility can be modeled in terms of Curie-Weiss behavior with = 75 K and C = 1.23 emu/mol and a temperature independent term χ0 = –1.56 × 10⁻⁴
emu/mol. The positive sign of the Weiss constant indicates the predominance of ferromagnetic exchange at elevated temperatures and the Curie constant C yields an effective magnetic moment μeff2 = 9.84 μB2 per mole formula unit, which corresponds to a moment of 1.81 μB per Cu2+ cation. The value of χ0 is the summation of individual ions Pascal’s constants [21] and van Vleck magnetism of Cu2+ [22]. The inset of Figure 3 also shows the temperature dependence of the Curie constant, which clearly shows the strengthening of antiferromagnetic interactions upon cooling. The magnetization of Cu3Y(SeO3)2O2Cl as a function of field is shown in Figure 4
measured over the temperature range 5 – 30 K. At low temperatures, the primary linear response changes into sharp upturn at moderate magnetic fields and with increasing temperature this anomaly shifts to lower magnetic fields. The magnetization at 2 K and its field derivative are shown in the inset to Figure 4. The metamagnetic transition at this temperature occurs at a critical field BC = 2.6 T and at high fields the magnetization tends towards a slightly reduced saturated value than the expected Msat= ngSμB = 3.165 μB per formula unit of three Cu2+ cations with g = 2.11. Further evidence for the appearance of long range order in Cu3Y(SeO3)2O2Cl is
given by the heat capacity Cp. The temperature dependence of Cp measured in various magnetic fields in the range 0–5 T are shown in Figure 5. In the absence of a non-magnetic analogue for Cu3Y(SeO3)2O2Cl it is difficult to separate the different contributions to the heat capacity. The
modest magnitude of the peak at TN = 36.3 K allows one to assume that a significant amount of magnetic entropy (Smag) is released well above the transition temperature. Indeed, calculating the
estimation of the lattice contribution gives a value of Smag ~ 1.35 J mol–1 K–1, which is to be
compared with thermodynamic value of 3Rln2 = 17.3 J mol–1 K–1 (where R is the universal gas constant). Evidently, the magnetic entropy released above the transition temperature constitutes more than 90 % of overall magnetic entropy. This fact is in full agreement with the strong deviation of the experimental (T) data from the extrapolation of the high temperature Curie-Weiss law from below ~ 150 K, as shown in the inset to Fig. 3.
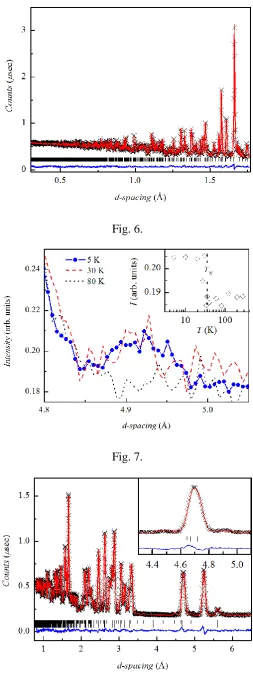
Figure 6 shows the Rietveld refinement of the orthorhombic Pmmn model to powder neutron diffraction data of Cu3Y(SeO3)2O2Cl collected on the high resolution backscattering
bank of the GEM diffractometer at 280 K. Lattice parameters, atomic positions, isotropic thermal parameters, background terms, diffractometer constants, wavelength-dependent absorption correction, scaling and profile parameters refined simultaneously to four histograms (banks 3 – 6) to give an overall Rwp = 2.15 % and χ2 = 3.66 for 81 variables. Table 1 gives a summary for the results of the Pmmn model. Upon cooling, the powder neutron diffraction data confirm the occurrence of the magnetic phase transition observed in the magnetic susceptibility, magnetization and heat capacity data at TN = 36.3 K through the appearance of magnetic Bragg peaks. The main magnetic reflections are present at d-spacings of 4.5 Å and 4.9 Å and can be indexed by the magnetic propagation vector k = (0, 0, 0.5). Figure 7 shows the growth of the (1 1 0.5) reflection of the magnetic unit cell, the form of which as a function of temperature (see Figure 7, inset) is indicative of a second-order magnetic phase transition. In order to calculate the potential symmetry-allowed magnetic structures that can result from such a phase transition representational analysis of the crystal structure with the k-vector was performed using the 2K version of the SARAh-Representational Analysis program [23]. SARAh determines the space group symmetry elements that leave the k-vector invariant, which form the little group Gk and
gives the representation of a crystallographic site in terms of the irreducible representations (IRs) of Gk. For Cu3Y(SeO3)2O2Cl with Pmmn space group symmetry and k= (0, 0, 0.5) there are 8
symmetry elements that leave the k-vector unchanged and the resulting IRs and their associated basis vectors (BVs) ψn are given in Table S1 of Supplementary Information.
From powder diffraction data alone, it was difficult to obtain an unambiguous magnetic structure solution. However, an earlier single crystal neutron diffraction study [15] of the related material Cu3Bi(SeO3)2O2Br, which adopts the same Pmmn structure with the buckled kagome
network of Cu2+ ions and undergoes a magnetic ordering transition at TN = 27.4 K with the same
k-vector (0, 0, 0.5), revealed that the best fit to data was obtained for the magnetic structure given by the Γ3 IR for both copper sites. Given the similarity of the two structures and the nature
of the ordering transition, the Γ3 model was selected as a magnetic model for the low
temperature neutron diffraction data of Cu3Y(SeO3)2O2Cl. The magnetic Rietveld refinement
was performed in GSAS using the SARAh-Refine [23] program to set up the magnetic phase. The lattice parameters, isotropic thermal parameters and profile parameters of the magnetic phase were constrained by the nuclear phase and once again, the nuclear and magnetic models were refined simultaneously to histograms collected on banks 3 – 6. Figure 8 shows the refinement to the small-angle (bank 3) data, where the magnetic reflections are most apparent. The inset shows the fit to the data over the d-spacing range around the two main magnetic Bragg peaks, which demonstrates the excellent agreement between the Γ3 model and the data. The
refined magnetic moments were (0, 0.11(1), 0.40(2)) μB and (0, 0, 1.04(4)) μB for the Cu1 and Cu2 sites, respectively. An overall Rwp = 2.15 % was achieved with a χ2 = 4.28 for 83 variables. The Γ3 magnetic structure is shown in Figure 2, with layers of Cu1 moments canted in the
ac-plane arranged ferromagnetically with the Cu2 moments which are oriented along the c-axis. These layers couple antiferromagnetically with one another, which gives rise to the bulk antiferromagnetic behaviour observed in our low field magnetic study.
We have also attempted to estimate the magnetic exchange parameters of the spin model of Cu3Y(SeO3)2O2Cl through first-principles calculations. There are six Cu2+ cations in the unit
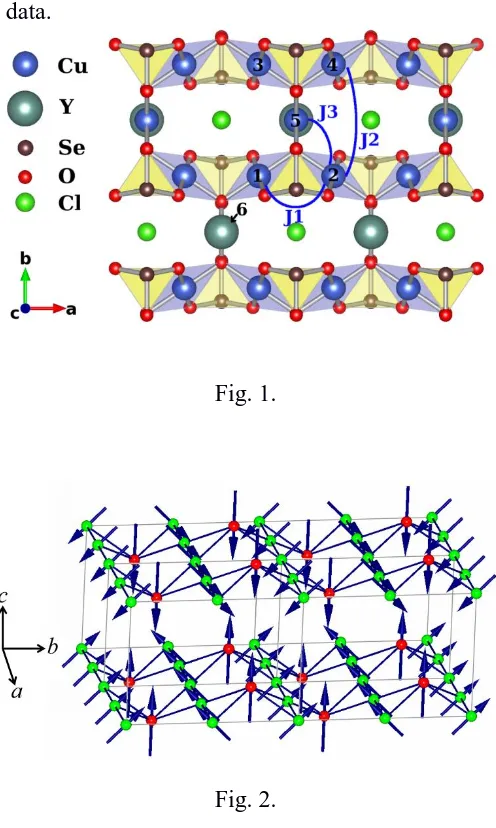
Cu3Y(SeO3)2O2Cl which are denoted J1 (between Cu1 ions along the a-axis), J2 (between Cu1
ions along the b-axis), and J3 (between Cu1 and Cu2 ions) and are shown in Figure 1. These
exchange parameters were calculated by mapping the Heisenberg model to the total energy difference of four magnetic configurations. The following magnetic structures were used: ferromagnetic (FM) FM (uuuuuu), FM_ch (uudduu) and antiferromagnetic (AFM) AFM1 (uuuudd), and AFM2 (udduuu), where “u” and “d” denotes spin-up and spin-down orientations on the corresponding copper site (e.g., in the FM_ch configuration the 1st, 2nd and 5th, 6th Cu ions have a spin-up orientation, whilst the 3rd and 4th are spin-down). The electronic structure calculations for these configurations were performed with the pseudopotential Quantum ESPRESS code [24]. The exchange correlation potential was used in the form proposed by Perdew-Burke-Ernzerhof [25] with a wave-function cut-off of 40 Ry. The GGA+U approximation was used to take the strong Coulomb interaction between the Cu sites into
account. The Hund’s rule exchange and Coulomb repulsion were chosen to be JH= 0.9 eV and U
= 7 eV, respectively [26, 27]. The unit cell of Cu3Y(SeO3)2O2Cl contains only one layer of CuO4
plaquettes. The lowest total energy in this case corresponds to a ferromagnetic state with an energy gap of 0.6 eV. Such a ferromagnetic configuration within one layer corresponds well with the spin model used to fit the low temperature powder neutron diffraction data discussed above and shown in Figure 2. The total and partial densities of states obtained in the GGA+U calculation for the FM1 configuration are shown in Figure 9. The top of the valence band and the
bottom of the conduction band are formed by 3d states of copper, which are strongly hybridized
with oxygen 2p states. The Cu2+ ions have a d9 configuration with the one hole in the 3d shell,
which is clearly seen in the spin resolved density of states for Cu1 and Cu2 ions. The electron
density distribution corresponding to the one hole on a Cu2+ ion obtained in GGA+U calculation
is shown in Figure 10. This orbital has x2-y2symmetry for both copper sites, and is directed
towards the oxide anions within the plaquettes. The spin moments on Cu were found to be 0.6
B, the slight reduction from the expected values is due to hybridization effects.
The calculated values of the exchange parameters are given by J1 = 137 K (FM), J2 =
43 K (AFM), J3 = 78 K (FM), respectively. The Curie-Weiss temperature recalculated from these
exchange constants as S(S+1)J(0)/3 equals 129 K (where J(0) is the sum of all neighboring exchange interaction parameters). This reasonably agrees with corresponding value extracted from the fit to the high temperature magnetic susceptibility data, since the mean-field approximation typically overestimates the Curie-Weiss temperature in 1.5-2 times. The signs of exchange constants also agree with those estimated from the single crystal magnetic
susceptibility measurements on the related compound Cu3Bi(SeO3)2O2Br [15]. In contrast to
Ref. 15, however, which assumes that J1 ~ J3, we have found here that J1 and J3 are quite
different. This difference cannot be explained in terms of a superexchange mechanism since the
Cu-O-Cu superexchange angles for J1 and J3 exchange pathways are nearly the same (111.9° and
112.7°). One of the possible explanations for such a behavior could be the influence of the Se
atoms, that connect two of the Cu(1)O4 plaquettes only. The hybridization with Se 4p orbitals
may effectively change the proportion between FM and AFM contributions to the total exchange
coupling as it was proposed for CuGeO3 [28].
More generally, it is not obvious that such a complex magnetic system can be well described by a simple Heisenberg model. In order to check this,we calculated the total energy of an additional magnetic configuration, AFM3 (uuuuud), and recalculated the exchange parameters using the FM_ch, AFM, AFM2 and AFM3 magnetic structures (excluding the FM configuration). The values of exchange parameters obtained are identical to the ones presented above, which indicates the validity of the application of the Heisenberg model for the description
of magnetic properties of Cu3Y(SeO3)2O2Cl. Since the exchange couplings are known to depend
on the values of the Hubbard U parameter [29] the value of U was varied within a limit of 1 eV
and the corresponding changes in J were within 7% of the original exchange parameter.
There are three possible interlayer exchange pathways connecting the buckled kagome
In order to estimate the interlayer exchange energy the unit cell was doubled along the c-axis. The total energy of the seven different magnetic configurations was calculated within the GGA+U approximation. The lowest total energy was obtained for the spin configuration in which the ferromagnetic layers are stacked antiferromagnetically with respect to one another
along the c-direction, in agreement with the spin model obtained from the magnetic Rietveld
refinement to low temperature neutron diffraction data discussed above. The resulting exchange
integrals are given by J1 = 136 K (FM), J2 = – 42 K (AFM), J3 = 85 K (FM), Jc1 = 1.5 K (FM),
Jc12 =8 K (AFM) and Jc2= 0.9 K (FM).
Finally we turn to a discussion of our ESR study of Cu3Y(SeO3)2O2Cl. The temperature
evolution of the powder ESR spectra of Cu3Y(SeO3)2O2Cl is shown in Figure 11. Over the whole
temperature range studied the ESR powder pattern is characteristic of Cu2+ ions with an anisotropic g-tensor, while the hyperfine structure expected from natural 63Cu and 65Cu isotopes (I=3/2) is suppressed, presumably due to the presence of weak exchange interactions. The anisotropic line L1 is superimposed over the extremely wide background line L2, which is
characterized by a comparable resonance field. The line L2 narrows markedly with decreasing
temperature and grows in amplitude (Figure11(a)). The presence of L2 is most obvious in the
temperature range 40 – 70 K (Figure 11 (b)). Below 50 K this background line L2 rapidly
broadens and eventually disappears at Néel temperature such that it is no longer detectable at low temperatures (Figure 11 (c)). The disappearance of the L2 ESR signal at the Néel temperature is
indicative of the opening of a spin gap for the resonance excitation due to the onset of long range magnetic order.
The complex ESR behavior observed here can be understood by taking into account the presence of two different Cu2+ sites in the crystal structure of Cu3Y(SeO3)2O2Cl in addition to
the several different exchanges pathways of different energy scales, as outlined in the previous section. The different energy scales of the exchange interaction between the two Cu2+ sites are clearly visible from the widths of the ESR branches related to the Cu1 and Cu2. The internal magnetic fields effectively suppress the paramagnetic ESR signal from the Cu2 site at temperatures below TN = 36.3 K, while the signal from the Cu1 remains present even in the low temperature phase. The persistence of the paramagnetic ESR signal below TN has been observed
recently in the mixed dimensionalities system CuP2O6 [30] and was explained by the interplay
between different exchange couplings in two different magnetic subsystems (1D and 2D) when very weak Cu moments appear within 1D magnetic subsystem of CuP2O6. It is worth mentioning
that in contrast to the case of Cu3Y(SeO3)2O2Cl, it was not possible to resolve the two different
crystallographic Cu2+ positions in the ESR spectra of CuP2O6.
A detailed quantitative analysis of the ESR line L2 is complicated due to its extremely
large linewidth over almost the whole temperature range studied. Nevertheless, in order to get some quantitative estimations for line L2 we have fitted the spectra in the temperature range 40 –
90 K in accordance with a single Lorentzian function of the type
22
r
dP d B
dB dB B B B
where P is the power absorbed in the ESR experiment, B is the applied magnetic field, Br is the
resonance field and B is the linewidth. Note that during this analysis we have neglected the middle part of the spectrum related to another component L1. The fitted curves are shown by
dash-dotted lines in the middle panel (b) of Fig. 11. The effective g-factor for line L2 was found
to be about g = 2.090.02, while its linewidth exceeds 200 mT at 50 K and markedly increases with increasing temperature.
To evaluate the main ESR parameters of the line L1 the experimental spectra have been
principal g-values of the anisotropic g-tensor (Figure 12(b)) remain almost constant over the whole temperature range investigated with average values g1 = 2.18(4), g2 = 2.10(6) and g3 =
2.05(9) resulting in g = 2.1150.005, which is comparable to both the g-values reported for the isostructural compounds Cu3Bi(SeO3)2O2Br (g = 2.04(8)) [16] and Cu3Bi(SeO3)2O2Cl (g = 2.16)
[31] and consistent with typical values for Cu2+ ions in other copper oxides [32, 33].The slight
deviation of the g-factors from their high-temperature values below ~ 40 K, see Figure 12(b), is indicative of the development of internal fields upon approaching the long range ordered phase. The observed anisotropy may originate from a sizable spin-orbit coupling , which mixes orbital
excited states of Cu2+ with their Kramer’s ground state doublet, and is reflected in measured g
-factor shifts of g = 0.06-0.18 from the free electron value of 2.0023. Second-order perturbation
theory yields two exchange anisotropy sources, firstly an antisymmetric Dzyaloshinsky-Moriya
(DM) type interaction D (g/g)J (linear in ) and secondly a symmetric anisotropic exchange
(AE) (g/g)2J (quadratic in ). The DM interaction is usually dominant in Cu-based
antiferromagnets, if allowed by symmetry [34].
Several distinct spin dynamic regimes are observed in the temperature dependence of the
ESR line width (Figure 12(c)). The line widths of all three principal components remain
temperature independent at high temperatures (T > 100 K), characteristic of the high temperature
exchange narrowing regime. Below ~ 125 K, a conspicuous increase in linewidths of B1 and
B2 components is observed, while B3 starts to increase noticeably below ~ 80 K. Such a
broadening is usually taken as evidence for the build-up of short range spin correlations at TJ
[35]. The difference in behavior of B1 and B2 in comparison with B3 indicates that the
correlations in Cu3Y(SeO3)2O2Cl are evolving in an anisotropic manner. Typically, ESR spectra
tend to broaden monotonically upon lowering temperature as spin correlations develop, which is
observed in many other Cu2+ based antiferromagnets [36–40]. Nevertheless, the linewidth
observed here for Cu3Y(SeO3)2O2Cl passes through a maximum in the vicinity of Néel
temperature and decreases smoothly upon lowering the temperature further, which again may reflect the saturation of the spin correlation length and the depletion of the spin fluctuation density due to the opening of a spin gap [41].
It should be noted, that both the large width of L2 mode (and, as a consequence, partial
recording of the spectrum within certain temperature ranges) and anisotropic character of L1
mode impede the precise double integration of the derivative absorption curves and leads to noticeable uncertainty in analysis of the integral ESR intensity, which is proportional to a number of spins. For estimation we have used the conventional relation for the integral intensity IESRAESRB2, where AESR is the amplitude of ESR signal. Since the experimental spectra for L1
mode were treated as a sum of three components corresponding to three principal values of g-tensor the total integral ESR intensity can be considered as an average value from those three components. The Fig. 13 shows this product in comparison with the temperature dependence of the magnetic susceptibility. Apparently the dynamic (ESR) data are in reasonable agreement with static (PPMS) ones. Both data sets show deviation from Curie-Weiss law at T>120 K, which is markedly higher than the ordering temperature to be indicative of the strong role of short-range correlations at T>TN for present compound. The integral ESR intensity demonstrates
points to the continuing dynamic processes even in AFM phase similarly to the case of CuP2O6
[30] as described above.
CONCLUSIONS
In conclusion, we have presented a detailed magnetic and first-principles study of the buckled kagome material Cu3Y(SeO3)2O2Cl. Cu3Y(SeO3)2O2Cl undergoes a magnetic ordering
transition at TN = 36.3 K as evidenced by magnetic susceptibility, magnetization, heat capacity and low temperature neutron diffraction experiments. Rietveld analysis of the low temperature neutron diffraction data revealed that the zero field magnetic structure is described by a canted ferrimagnetic orientation of the Cu2+ spins within the buckled kagome layers with an antiferromagnetic stacking between the layers along the c-axis. First-principles calculations have allowed for the estimation of both the intra-plane and inter-plane exchange interactions, which are in excellent agreement with our spin model determined from neutron diffraction. The ESR study reveal the presence of two resonance modes corresponding to two different crystallographic Cu positions, which are characterized by almost temperature independent behavior. The principal g-values of the g-tensor of Cu(1) sites were found to be g1 = 2.18(4), g2 = 2.10(6) and g3 = 2.05(9), while the effective g-factor of Cu(2) sites is almost isotropic and is on average g = 2.09(5). At low temperatures, Cu3Y(SeO3)2O2Cl undergoes a metamagnetic
transition with a critical field BC = 2.6 T at 2 K due to the suppression of the inter-plane exchange interactions. The relatively weak nature of the interplane coupling results in a low critical field strength while the competition between different intraplane exchange interactions leads to a low saturation field of Bsat ≤ 8 T. Our study suggests that this unusual metamagnetic transition is an inherent property of the francisite family and emphasizes the power one has to extend our understanding of the rich and fascinating physics of this group of materials by simple chemical substitutions.
ACKNOWLEDGEMENTS
This work was supported in part from the Ministry of Education and Science of the Russian Federation in the framework of IncreaseCompetitiveness Program of NUST«MISiS»(№ К2-2014-036), by the Russian Foundation for Basic Research projects 12-03-00665,
13-02-00050, 13-02-00174, 13-02-00374, 14-02-00111, 14-02-00245, 14-02-92002, and by the grants
-in-aid of Ministry of Education and Science of Russia MK-3443.2013.2 and MK-7138.2013.2. The collaboration between the University of St Andrews and Moscow State University was funded by a Royal Society International Exchanges grant, in collaboration with the RFBR (12-03-92604). PL and LC also thank the Leverhulme Trust (award RPG-2013-343).
References
1. K. C. Rule, A. U. B. Wolter, S. Suellow, D.A. Tennant, A. Brühl, S. Köhler, B. Wolf, M. Lang, J. Schreuer, Phys. Rev. Lett. 100, 117202 (2008).
2. S. Lebernegg, A.A. Tsirlin, O. Janson, and H. Rosner, Phys. Rev. B 88, 224406 (2013). 3. S. Lebernegg, A.A. Tsirlin, O. Janson, and H. Rosner, Phys. Rev. B 87, 235117 (2013). 4. M. Schapers, A.U.B. Wolter, S.-L. Drechsler,S. Nishimoto, K.-H. Mühller, M. Abdel-Hafiez, W. Schottenhamel, B. Büchner, J. Richter, B. Ouladdiaf, M. Uhlarz, R. Beyer, Y. Skourski, J. Wosnitza, K.C. Rule, H. Ryll, B. Klemke, K. Kiefer, M. Reehuis, B. Willenberg, S. Süllow, Phys. Rev. B88, 184410 (2013).
7. S. Kitagawa, H. Kotegawa, H. Tou, H. Ishii, K. Kudo, M. Nohara, and H. Harima, J. Phys. Soc. Jpn. 82, 113704 (2013).
8. A. Olariu, P. Mendels, F. Bert, F. Duc, J.C. Trombe, M.A. de Vries, A. Harrison, Phys. Rev. Lett.100,087202(2008).
9. T.-H. Han, S.J. Helton, S. Chu, D.G. Nocera, J.A. Rodrigez-Rivera, C. Broholm and Y.S. Lee, Nature, 492, 406 (2012).
10. D.V. Pilon, C.H. Lui, T.-H. Han, D. Shrekenhamer, A.J. Frenzel, W.J. Padilla, Y.S. Lee, and N. Gedik, Phys. Rev. Lett. 111, 127401 (2013).
11. D. Wulferding, P. Lemmens, P. Scheib, J. Röder, P. Mendels, S. Chu, T. Han, and Y.S. Lee, Phys. Rev. B 82, 144412 (2010).
12. A. Pring, B.M. Gatehouse and W.D. Birch, Amer. Mineral. 75, 1421 (1990).
13. E.V. Nazarchuk, S.V. Krivovichev, O.Y. Pankratova, and S.K. Filatov, Phys. Chem. Miner.27, 440 (2000).
14. P. Millet, B. Bastide, V. Pashchenko, S. Gnatchenko, V. Gapon, Y. Ksari, and A. Stepanov, J. Mater. Chem. 11, 1152 (2001).
15. M. Pregelj, O. Zaharko, A. Günther, A. Loidl, V. Tsurkan, andS. Guerrero, Phys. Rev. B
86, 144409 (2012).
16. Z. Wang, M. Schmidt, Y. Goncharov, V. Tsurkan, H.-A. Krug von Nidda, A. Loidl, and J. Deisenhofer, Phys. Rev. B 86, 174411 (2012).
17. R. Becker and M. Johnsson, Sol. St. Sci. 7, 375 (2005).
18. R. Berrigan and B.M. Gatehouse, Acta. Cryst. C 52, 496 (1996).
19. P.S. Berdonosov and V.A. Dolgikh, Russ. J. Inorg. Chem. 53, 1353 (2008).
20. A. C. Larson and R. B. Von Dreele, Los Alamos National Laboratory Report No. LAUR-86-748 (1994).
21.G.A. Bain and J.F. Berry, J. Chem Educ. 85, 532 (2008).
22.M.G. Banks, R.K. Kremer, C. Hoch, A.Simon, B. Ouladdiaf,J.-M. Broto, H. Rakoto, C. Lee, and M.-H. Whangbo, Phys. Rev. B 80, 024404 (2009).
23.A. S. Wills, Physica B 276, 680 (2000), program available from www.ccp14.ac.uk
24.P. Giannozzi et al., J. Phys.:Condens. Matter 21 395502 (2009);URL
http://www.quantum-espresso.org
25.J. P. Perdew, K. Burke, and M. Ernzerhof, Phys. Rev. Lett. 77, 3865 (1996).
26.S.V. Streltsov and D.I. Khomskii Phys. Rev. B 86, 035109 (2012).
27.S.V. Streltsov, M.V. Petrova, V.A. Morozov, G.V. Romanenko, V.I. Anisimov, and N.N. Lukzen, Phys. Rev. B 87, 024425 (2013).
28.W. Geertsma and D. Khomskii, Phys. Rev. B. Condens. Matter 54, 3011 (1996).
29.J. B. Goodenough, Magnetism and the Chemical Bond (Interscience Publishers, New York-London, 1963).
30.R. Nath, K. M. Ranjith, J. Sichelschmidt, M. Baenitz, Y. Skourski, F. Alet, I. Rousochatzakis,andA. A. Tsirlin, Phys. Rev. B 89, 014407 (2014).
31. K. H. Miller,P. W. Stephens,C. Martin,E. Constable,R. A. Lewis,H. Berger,G. L. Carr,and D.
B. Tanner,Phys. Rev. 86, 174104 (2012).
32. R.M. Krishna and S.K. Gupta, Bull. Magn.Resonance,16, 239 (1994).
33. L. Shvanskaya, O. Yakubovich, A.Ivanova, S.Baidya, T.Saha-Dasgupta, E.Zvereva, A. Golovanov, O.Volkova, and A.Vasiliev, New J. Chem. 37, 2743 (2013).
34. T. Moriya, Phys. Rev. 120, 91 (1960).
35. P. M. Richards, Local Properties of Low-Dimensional Antiferromagnets, edited by K. A. Müller (Nord Holland Publishing Company, Amsterdam, 1976).
36. V. Kataev, K.-Y. Choi, M. Grüninger, U. Ammerahl, B. Büchner, A. Freimuth, and A. Revcolevschi, Phys. Rev. Lett. 86, 2882 (2001).
38. Y. C. Arango, E. Vavilova, M. Abdel-Hafiez, O. Janson, A. A. Tsirlin, H. Rosner, S.-L. Drechsler, M. Weil, G. Nénert, R. Klingeler, O. Volkova, A. Vasiliev, V. Kataev, and B. Büchner, Phys. Rev. B 84, 134430 (2011).
39. A. Zorko, F. Bert, A. Ozarowski, J. van Tol, D. Boldrin, A. S. Wills, and P. Mendels, Phys. Rev. B 88, 144419 (2013).
40. A. U. B. Wolter, F. Lipps, M. Schäpers, S.-L. Drechsler, S. Nishimoto, R. Vogel, V. Kataev, B. Büchner, H. Rosner, M. Schmitt, M. Uhlarz, Y. Skourski, J. Wosnitza, S. Süllow, and K. C. Rule, Phys. Rev. B 85, 014407 (2012).
41. F. Chabre, A.M. Ghorayeb, P. Millet, V.A. Pashchenko, and A. Stepanov, Phys. Rev. B 72, 012415 (2005).
Figure captions
Fig. 1.Crystal structure of Cu3Y(SeO3)2O2Clin mixed a ball-and-stick and polyhedral
representation. Large, medium and small circles between corrugated copper-selenium planes represent yttrium, copper and chlorine ions, respectively. The arcs indicate the main intraplane exchange interaction pathways.
Fig. 2. The spin model for Cu3L(SeO3)2O2X (L = Bi, Y, X = Br, Cl)with Cu1 (green) moments
canted from the c-axis towards the b-axis coupled ferromagnetically to the moments on the Cu2 (red) sites which aligned parallel to the c-axis. The buckled kagome layers of Cu1 and Cu2 site cations are antiferromagnetically arranged with respect to one another. Note that the figure only shows one half of the magnetic unit cell along the c-axis.
Fig. 3. The temperature dependence of the magnetic susceptibility of Cu3Y(SeO3)2O2Cl in
applied field strengths of 1 – 9 T, with a field step of 1 T. The inset represents the temperature dependence of the magnetic susceptibility at 0.1 T along with the Curie constant as a function of temperature. The dotted line represents an extrapolation of the Curie-Weiss type dependence from the high temperature region.
Fig. 4. The field dependence of the magnetizationin Cu3Y(SeO3)2O2Cl over the temperature
range of 5 – 30 K in steps of 5 K. The inset shows the field dependence of the magnetization at 2 K and its field derivative.
Fig. 5. The temperature dependence of the heat capacity of Cu3Y(SeO3)2O2Cl measured in zero
field and applied field strengths of up to 5 T. The inset shows the field dependence of the heat capacity around the magnetic ordering transition in clearer detail.
Fig. 6.A plot of the Rietveld refinement of the Pmmn model to powder neutron diffraction data collected for Cu3Y(SeO3)2O2Cl on the high resolution backscattering bank at 280 K.
Fig. 7.Intensity of the neutron diffraction data of Cu3Y(SeO3)2O2Cl at various temperatures
showing the growth of the most distinct magnetic Bragg peak upon cooling below TN. The inset shows the intensity of this magnetic reflection as a function of temperature.
Fig. 8.The Rietveld refinement of the Pmmn nuclear model (bottom tick marks) and the Γ3
magnetic model (top tick marks) to the small angle GEM diffraction data of Cu3Y(SeO3)2O2Cl
collected at 5 K. The inset shows the fit to the two main magnetic reflections.
Fig. 10. The electron density distribution around each Cu2+ cation as determined by the GGA+U calculation. The red and blue orbitals correspond to Cu1 and Cu2, respectively. Oxide anions are shown as black spheres.
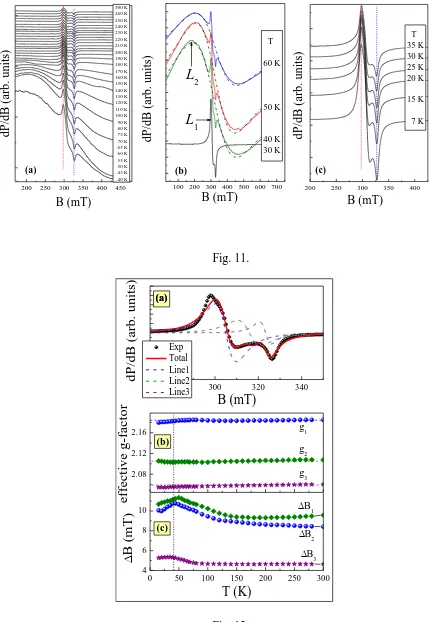
Fig. 11.Temperature evolution of ESR spectra of Cu3Y(SeO3)2O2Cl in the different temperature
ranges: (a) overall high temperature range where the superposition of two modes was observed; (b) the temperature range in the vicinity of Néel temperature (60 – 30 K) highlighting the disappearance of the L2 mode below TN, dash-dotted lines here represent fitting of the L2
resonance mode by Lorentzian profile; (c) low temperature range showing the behavior of L1
mode below TN. Two resonance modes revealed are denoted by the arrows in the middle panel
(b).
Fig. 12. (a) The ESR spectra (circles) of Cu3Y(SeO3)2O2Cl at 200 K with the fits to the data as
described in the text shown by the lines. The dashed lines show the individual Lorentzian fit components and the solid line is the sum of all three. (b) The temperature dependence of principal values of g-tensor. (c) The temperature dependence of the ESR linewidth for three resolved components of the ESR spectra.
Fig. 13. The integral ESR intensity for L1 mode (red filled circles) in comparison with static
[image:11.595.196.444.320.734.2]magnetic susceptibility data.
Fig. 1.
[image:11.595.194.449.515.718.2]Fig. 3.
Fig. 4.
Fig. 6.
Fig. 7.
Fig. 9.
200 250 300 350 400 450 dP /d B (arb. un it s) B (mT) 300 K 260 K 250 K 240 K 230 K 220 K 210 K 200 K 190 K 180 K 170 K 160 K 150 K 140 K 130 K 120 K 110 K 100 K 90 K 80 K 75 K 70 K 65 K 60 K 55 K 50 K 45 K 40 K (a)
100 200 300 400 500 600 700
L
2 B (mT) dP /dB (arb. un it s) T 60 K 50 K 40 K 30 KL
1 (b)200 250 300 350 400
[image:15.595.88.517.67.689.2](c) B (mT) dP /d B (arb. un it s) T 35 K 30 K 25 K 20 K 15 K 7 K Fig. 11.
280 300 320 340
(a)
d
P/d
B
(arb.
u
n
it
s)
B (mT)
Exp Total Line1 Line2 Line3 (a) 2.08 2.12 2.16 (b) g3 g2effect
iv
e
g
-f
ac
to
r
g10 50 100 150 200 250 300
4 6 8 10 (c)
B
(mT)
B3
B2
B1
T (K)
0 50 100 150 200 250 300 0.00
0.05 0.10 0.15 0.20 0.25
M/B (e
mu/
mol
)
T (K)
0.1 T 5 T
Curie-Weiss fit
0 1 2 3 4 5 6
ESR
ESR1
(ar
b.
unit
s)
[image:16.595.194.451.79.276.2]TN
Fig. 13.
TABLE 1. Refined atomic coordinates and isotropic thermal parameters within the Pmmn nuclear structural model for Cu3Y(SeO3)2O2Cl at 280 K (a = 6.2991(1) Å, b = 9.4411(1) Å, c =
6.9724(1) Å).
Atom Site x y z Occ. Uiso / Å2
Y 2a ¼ ¼ 0.2660(1) 1.0 0.0059(3)
Cu1 4c 0 0 0 1.0 0.0081(2)
Cu2 2a ¼ ¼ 0.7955(2) 1.0 0.0081
Se 4e ¼ 0.5605(1) 0.5899(1) 1.0 0.0041(2)
Cl 2b ¼ ¾ 0.1465(1) 1.0 0.0222(3)
O1 4e ¼ 0.1103(1) 0.9969(1) 1.0 0.0044(2)
O2 8g 0.0397(1) 0.5881(1) 0.7373(1) 1.0 0.0079(2)
[image:16.595.152.486.424.551.2]