The Eruption of a Small-scale Emerging Flux Rope as the Driver of an M-class Flare and
of a Coronal Mass Ejection
X. L. Yan1,2,3, C. W. Jiang4 , Z. K. Xue1,3, J. C. Wang1,5, E. R. Priest6 , L. H. Yang1,3, D. F. Kong1,2,3, W. D. Cao7, and H. S. Ji8 1
Yunnan Observatories, Chinese Academy of Sciences, 396 Yangfangwang, Guandu District, Kunming 650216, Yunnan, P. R. China;[email protected] 2
Key Laboratory of Solar Activity, National Astronomical Observatories, Chinese Academy of Sciences, Beijing 100012, P. R. China
3
Center for Astronomical Mega-Science, Chinese Academy of Sciences, 20A Datun Road, Chaoyang District, Beijing, 100012, P. R. China
4
Institute of Space Science and Applied Technology, Harbin Institute of Technology, Shenzhen, 5180055, P. R. China
5Graduate School of University of Chinese Academy of Sciences, Yuquan Road, Shijing-shang Block Beijing 100049, P. R. China 6
Mathematics Institute, University of St Andrews, St Andrews, KY16 9SS, UK
7
Big Bear Solar Observatory, 40386 North Shore Lane, Big Bear City, CA 92314, USA
8
Key Laboratory for Dark Matter and Space Science, Purple Mountain Observatory, Chinese Academy of Sciences, Nanjing 210008, Jiangsu, P. R. China Received 2017 May 3; revised 2017 June 22; accepted 2017 June 23; published 2017 August 8
Abstract
Solar flares and coronal mass ejections are the most powerful explosions in the Sun. They are major sources of potentially destructive space weather conditions. However, the possible causes of their initiation remain controversial. Using high-resolution data observed by the New Solar Telescope of Big Bear Solar Observaotry, supplemented by Solar Dynamics Observatory observations, we present unusual observations of a small-scale emergingflux rope near a large sunspot, whose eruption produced an M-classflare and a coronal mass ejection. The presence of the small-scaleflux rope was indicated by static nonlinear force-freefield extrapolation as well as data-driven magnetohydrodynamics modeling of the dynamic evolution of the coronal three-dimensional magnetic
field. During the emergence of theflux rope, rotation of satellite sunspots at the footpoints of theflux rope was observed. Meanwhile, the Lorentz force, magnetic energy, vertical current, and transversefields were increasing during this phase. The free energy from the magneticflux emergence and twisting magneticfields is sufficient to power the M-classflare. These observations present, for thefirst time, the complete process, from the emergence of the small-scaleflux rope, to the production of solar eruptions.
Key words:Sun: activity –Sun: coronal mass ejections(CMEs)–Sun:flares– Sun: magneticfields–Sun: photosphere –sunspots
Supporting material:animations
1. Introduction
Solarflares and coronal mass ejections (CMEs)are explosive phenomena observed in the solar atmosphere(Wang et al.2002). A huge amount of free magnetic energy stored in the solar atmosphere is released during their eruptions(Forbes2000; Priest & Forbes2002; Schmieder et al.2015). This energy is transformed into radiative energy, bulk kinetic energy, as well as thermal and nonthermal energy (Deng et al. 2013; Lin et al.2015; Xiang & Qu2016).
Previous observations have demonstrated that the accumula-tion of free magnetic energy in the corona may be due to shearing motion(Wang et al.1994; Moore et al.2012), sunspot rotation(Régnier & Canfield2006; Yan & Qu2007; Zhang et al. 2007; Yan et al. 2009; Sturrock & Hood 2016; Zheng et al. 2017), and magnetic emergence or cancellation (Wang & Shi 1993; Chen & Shibata 2000; Sterling et al. 2010) in the photosphere. However, the detailed processes for solar eruptions have been unclear for many years because it is difficult to deduce the three-dimensional magnetic structure in the corona. Several possible models have been proposed for eruptions offlux ropes and the associated reconnection, namely, magnetic breakout, tether-cutting, magnetic non-equilibrium, kink instability, and torus instability (Carmichael 1964; Sturrock 1966; Hirayama 1974; Kopp & Pneuman 1976; Shibata et al.1995; Antiochos et al.1999; Lin & Forbes2000; Moore et al.2001; Amari et al. 2003; Török et al.2004; Kliem & Török2006; Schrijver et al. 2008; Shen et al.2012; Kliem et al.2014; Chen et al.2016; Shen et al. 2017).
With the improvement of the observations, more and more
fine structures of the Sun are revealed during solar eruptions. The model of theflux rope in solar eruptions has been proposed for many years (van Ballegooijen & Martens 1989; Rust & Kumar 1994, 1996). Until recent years, the existence of flux ropes in the solar atmosphere has been evidenced using high-resolution observational data(Tian et al.2010; Cheng & Ding 2016; Hou et al.2016; Li et al.2016a,2016b; Lim et al.2016; Zhou et al.2016). Zhang et al.(2012)reported that aflux rope with a twisted and writhed sigmoidal structure observed by the
Solar Dynamics Observatory (SDO)manifests itself as a hot
channel before and during the solar eruption. A similar observation of a magnetic cloud as the counterpart of a hot channel was studied by Song et al.(2015). They found that the hot channel corresponds to aflux rope in the solar corona. The existence offlux ropes can also be tracked out by material from a surge in a failedfilament eruption(Yang et al.2014). Using New Solar Telescope(NST)observations, Wang et al. (2015) also found that a set of loops developed into aflux rope before a two-ribbon flare. Filippov et al. (2015) presented several
filaments with highly twisted magnetic structure observed by the Transition Region And Coronal Explorer(TRACE)and Big Bear Solar Observatory (BBSO). These observations reveal that flux ropes may be ubiquitous in the solar atmosphere
(Zhang et al.2015a).
motion, convergenceflow, magnetic reconnection, and magnetic cancellation (van Ballegooijen & Martens 1989; Moore et al. 2001; Fan2009; Priest & Longcope2017). Recently, more and more observational evidence of flux rope formation has been obtained from high-resolution observations. Yan et al. (2012, 2015), Yang et al.(2015), and James et al.(2017)found that the formation of the S-shaped filaments or flux ropes is closely related to rotating sunspots that one foot of thefilaments is rooted in. This scenario is confirmed by the research of Vemareddy et al. (2016). They found that the magnetic connections of the sigmoid are driven by the slow motion of sunspot rotation, which
finally transforms into a highly twistedflux rope structure. Joshi et al. (2014) presented a clear case of the formation of a compound flux rope via the merging of two nearby filament channels. Song et al.(2014)presented a direct observation of the
flux rope formation process from a loop arcade during an eruption, which was associated with an M-class flare and a coronal mass ejection(CME)that occurred at the southwest limb on 2013 November 21. Yan et al. (2016) reported that the formation of an inverse S-shaped flux rope was due to the reconnection of two groups of chromospheric fibrils from observations made with the 1 m New Vacuum Solar Telescope
(NVST) (Liu et al. 2014). Kumar et al. (2017) found that the reconnection between the cool Hα loops in the chromosphere during the flares can form an unstable flux rope using high-resolution observations from the 1.6 m New Solar Telescope
(NST)at BBSO. Some indirect evidence of the existence offlux ropes can be deduced by using a nonlinear force-free field
(NLFFF) extrapolation (Cheng et al. 2010; Jiang et al. 2014,2016a,2016b).
A model of the emergence of a flux rope has also been proposed before solar eruptions by some researchers (Rust & Kumar 1994; Fan 2009). Observational evidence is very rare, however. Up to now, only one case was reported of the emergence of aflux rope, and this was by Okamoto et al.(2009). They found that a helical flux rope emerged from below the photosphere into the corona along the polarity inversion line
(PIL) below the preexisting prominence according to the observation that the orientations of the horizontal magnetic
fields along the PIL in the photosphere gradually changed with time from a normal-polarity configuration to an inverse-polarity configuration, and the horizontal magneticfield region exhibited blueshift. However, Vargas Dominguez et al.(2012)argued that the signatures presented by Okamoto et al. (2009) were not sufficient indicators of a twisted flux tube emergence. They found a decrease in the unsignedflux at the PIL rather than the expected increase in the case studied by Okamoto et al.(2009). Furthermore, no shear motion and converging flows were detected in Okamotoʼs research. Several simulations were carried out to address the emergence of convection zoneflux tubes. For instance, Archontis & Hood(2013)presented three-dimensional magnetohydrodynamics(MHD)simulations of the formation of jets triggered by the emergence and eruption of solar magnetic
fields. The similar triggering process of jet and surge were obtained by simulations of Moreno-Insertis & Galsgaard(2013) and Nóbrega-Siverio et al.(2016). Leake et al.(2014)performed three-dimensional MHD simulations of the emergence of flux tubes from the convection zone into a preexisting dipole coronal
field. They found that the external reconnection between the emergence flux tube and the overlying magnetic field lines is vital to the eruption process. That is to say, this external reconnection helps the further expansion of the coronalflux rope
into the corona. MacTaggart & Haynes (2014) considered the formation of twoflux ropes in an MHD solar flux emergence simulation. In their simulation, a shearing motion along the PIL was found during the formation of two flux ropes. Moreover, when thefirst rope approached the top boundary of the domain, it was dissipated. The secondflux rope emerged as a result of the decrease in overlying coronal magnetic fields by reconnection between the emerging flux region and the ambient magnetic
fields.
Here we use NST andSDOmutiwavelength data to investigate the process of the emergence of a small-scale flux rope to the production of an M-classflare and a small CME. Observations and methods are presented in Section2. The results are shown in Section3. Conclusions and discussions are given in Section4.
2. Observations and Methods
2.1. Observations
TiO(7057 Å)images and H-alpha images are obtained from the Visible Imaging Spectrometer(VIS)on the 1.6 m New Solar Telescope at BBSO(Cao et al.2010; Goode & Cao2010). TiO images have a spatial resolution of 0 0342 per pixel and the time cadence is 15 s. H-alpha images have a pixel size is 0 0295, and the cadence is 43 s for VIS to complete a scan at a 0.2 Å step from−1.0 Å to+1.0 Å around the H-alpha line center. H-alpha blue-wing (−0.6 Å), H-alpha center, and H-alpha red-wing
(+0.6 Å)images are used in this study.
Full-disk UV and EUV images with a 12 s cadence and a spatial resolution of 0 6 per pixel observed by SDO/AIA
(Lemen et al.2012)are employed to show the process offlux rope eruption. The vector magnetograms from Space Weather HMI Active Region Patch (SHARP) series observed by the Helioseismic and Magnetic Imager (HMI) (Schou et al. 2012; Bobra et al. 2014; Centeno et al.2014)have a pixel scale of about 0 5 and a cadence of 12 minutes. They are derived using the Very Fast Inversion of the Stokes Vector algorithm
(Borrero et al. 2011). The minimum energy method (Metcalf 1994; Metcalf et al.2006; Leka et al.2009)is used to resolve the 180 degree azimuthal ambiguity. The images are remapped using Lambert (cylindrical equal area)projection centered on the midpoint of the active region(AR), which is tracked at the Carrington rotation rate(Sun2013).
2.2. Methods
2.2.1. Current Calculation
The calculation of current is based on Ampèreʼs law:
J c B
4p , 1
= ( ´ ) ( )
in whichm0is the vacuum magnetic permeability andBdenotes the vector magneticfields. The current density perpendicular to the solar surface can be calculated from Ampèreʼs law by using HMI vector magnetograms according to the equation
B
j c c B
y B
x
4 4 , 2
z z x
y p p = ´ = ¶ ¶ -¶ ¶ ⎛ ⎝ ⎜ ⎞ ⎠ ⎟ ( ) ( )
where Bx and By are the two components of the photospheric
horizontal magnetic field. The distribution of jz on the solar
surface is obtained every 12 minutes. Note that all the equations in this paper are written in cgs.
2.2.2. Calculation of the Magnetic Flux
The integrated positive (fzp) and negative (fzn) magnetic
fluxes are calculated from
B dAz 3
zp
ò
f = + ( )
Bz dA, 4
zn
ò
f = ∣ -∣ ( )
whereBz+andBz-are the vertical positive and negative magnetic
fields, and dAdenotes the area differential.
2.2.3. NLFFF Extrapolation
The vector magneticfields obtained by SDO/HMI are taken as the boundary condition to extrapolate the magneticfields from the photosphere to the corona. The optimization algorithm proposed by Wheatland et al. (2000) and implemented by Wiegelmann(2004)is used to extrapolate the three-dimensional NLFFF structure of the active region. A preprocessing procedure
(fff_temp_pre.pro in SSW) is used to smoothen the bottom boundary vector data before the extrapolation. This removes most of the net force and torque that would result in an inconsistency between the forced photospheric magnetic field and the force-free assumption in the NLFFF models ( Wiegel-mann et al.2006).
2.2.4. Lorentz Force Calculation
The Lorentz force at the photospheric surface is divided into radial and horizontal components, which can be written as follows:
F 1 B B dA
8 A h r 5
r 2 2
ph
ò
p
= ( - ) ( )
F 1 B B dA
8 A . 6
h r h ph
ò
p = ( )Here,BhandBrrepresent the horizontal and radial components of
B, which are parallel and vertical to the photosphere, respectively.
Aphis the area of the white box in the photosphere. These results
are derived from the integral of the divergence of the Maxwell stress tensor.
The total Lorentz force acting on plasma at and above the solar photosphere can be written in terms of surface integrals of products of the photospherefield componentsB=(Bx,By,By) by assuming that the contributions from the top and side boundaries are negligible (Fisher et al. 2012). Thus, the horizontal(F Fx, y)and vertical( )Fz components can be written as follows:
F 1 B B dA
4 A 7
x z x ph
ò
p = ( )F 1 B B dA
4 A y z 8
y
ph
ò
p
= ( )
F 1 B B B dA
8 A x y z . 9
z 2 2 2
ph
ò
p
= ( + - ) ( )
2.2.5. Free Energy Calculation
We use the NLFFF extrapolation to obtain the magneticfields above the photosphere. Then the extrapolated NLFFF fields
(Bext) and potential fields (Bpot) are used to calculate the free energy from the equation
E 1 B B dV
8 v , 10
free
ò
ext2 pot2p
= ( - ) ( )
whereBextandBpotindicate the extrapolated NLFFFfields and
potentialfields, respectively. V is the cube with a height of ten arcseconds, whose bottom is marked by the box in Figure3(b).
2.2.6. Data-driven Simulation
[image:3.612.70.547.50.274.2]which is tracked at the Carrington rotation rate(Sun2013). The full set of time-dependent three-dimensional MHD equations is solved using the bottom boundary condition driven continu-ously by the changing photospheric vector magneticfields from SDO observations (Jiang et al.2016a). Here, the background plasma is initially in a hydrostatic isothermal state with T=106K (sound speed c 128
S= km s−1) in solar gravity. Its density is configured to make the plasma β as small as 2´10-3(the maximum Alfvénv
Ais 4 Mm s−1)to mimic the
coronal low-β and highly tenuous conditions. The plasma thermodynamics are simplified to be adiabatic since we focus on the evolution of the coronal magnetic field. The bottom boundary of the model is assumed to be the coronal base, and in addition, the magnetic field measured in the photosphere is used as a reasonable approximation to the field at the coronal base.
3. Results
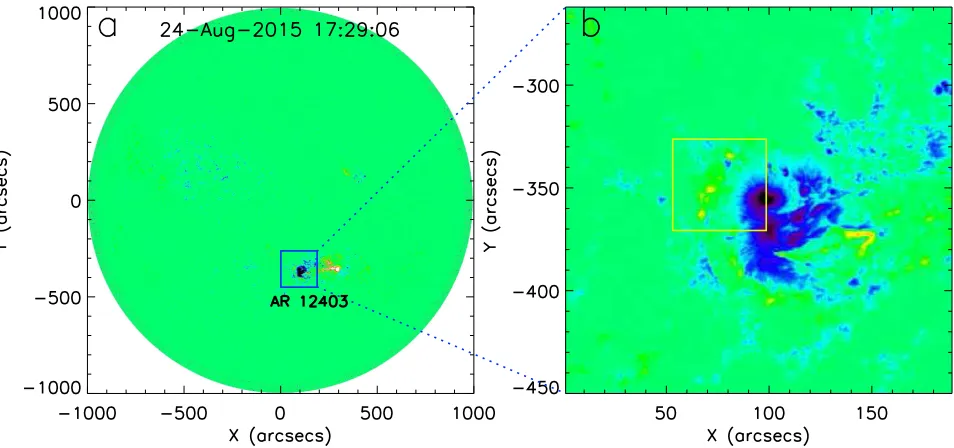
A large active region in the southern hemisphere, named NOAA 12403, on 2015 August 24(see Figure1(a))was located
near the center of the solar disk with aβγδfield configuration of the sunspot group. The SDO observations lasted from the emergence of small satellite sunspots S1 , S2, and S4 near the large sunspot with negative polarity to the occurrence of theflux rope eruption in this active region (see the positions of the satellite sunspots in Figures 2(a)–(d)). Moreover, BBSO high-resolution observations detected the details of the eruption.
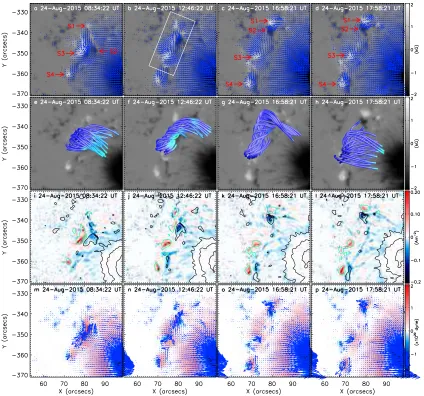
[image:4.612.95.519.50.446.2]The evolution of the vector magnetic fields, NLFFF extrapolations, electric current, and Lorentz force during the formation and eruption of theflux rope is presented in Figure2. The field of view of Figure 2 is marked by a yellow box in Figure1(b). The emergence process of sunspots S1 , S2, and S4 is clearly seen in the animation of Figure 8. Sunspot S2 first emerges to the right of sunspot S3(see Figure2(a)), and then it moves from south to north with a strong shearing motion between S2 and S3 (see Figures 2(b)–(c) and animation of Figure8). The white and black patches indicate the positive and negative magnetic polarities in Figures2(a)–(h). The blue arrows in Figures 2(a)–(d) indicate the transverse magnetic fields. The transverse magneticfields around the four sunspots exhibit Figure 2. Evolution of the vector magnetograms, the magnetic structure of the NLFFF extrapolation, the electric current, and the Lorentz force.(a)–(d)Vector magnetograms observed bySDO/HMI. The red arrows indicate the small satellite sunspots. The white box shows the region used to calculate the magneticflux, the free energy, the current, and the Lorentz force for this event.(e)–(h)The magnetic structure of NLFFF extrapolations.(i)–(l)The evolution of the current. The red and blue patches show the positive and negative current. The green and black lines outline the sunspots with positive and negative polarities, respectively.(m)–(p)The evolution of the Lorentz force. The red and blue patches show the upward and downward Lorentz force. The blue arrows show the directions of the transverse Lorentz force.
clockwise vortex structure. The change in integrated magnetic
flux in the white box of Figure2(b)is shown in Figure3(a). The NLFFF extrapolations in Figures2(e)–(g)present the emergence of the structure of a flux rope, which includes the twisted magneticfield lines and a highly sheared arcade. Note that Space weather SDO/HMI Active Region Patches (SHARP) vector magnetogram data were used to extrapolate the three-dimensional magneticfield of this active region. After the eruption of theflux rope, the twisted structure disappeared and the connections of the magnetic field lines also changed (see Figure 2(h)). The configuration of magneticfields became more potential.
Figures2(i)–(l)show the evolution of the electric current during the emergence of the satellite sunspots and after the eruption of the
flux rope. An increase in the current of sunspot S3 is associated with its emergence. The red and blue patches indicate the positive and negative electric current, respectively. The green and black contours outline the positive and negative magnetic polarities. Note that the levels of the contours are±500 G,±1300 G, and±2100 G. Since sunspots S2 and S3 exhibit a significant rotation during their evolution(see the animation of Figure9), the direction of the Lorentz force also exhibits a vortex shape (see Figures 2(m)–(p)). The rotation direction of the sunspots is consistent with the directions of the Lorentz force. During the emergence of sunspot S2, the upward and transverse Lorentz force between sunspots S2 and S3 increases rapidly from 07:36 UT to 11:12 UT.
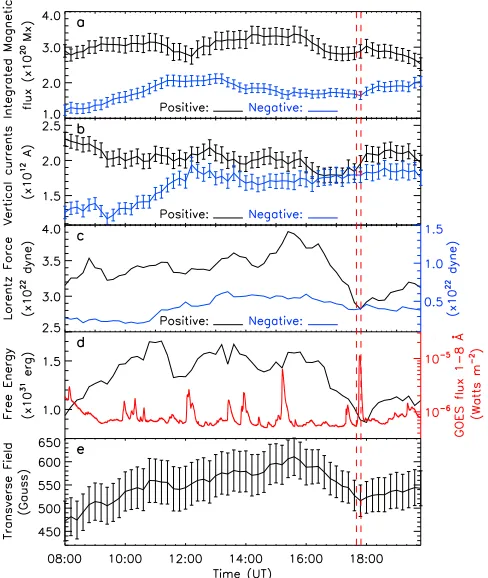
Figure3presents the change in magneticflux, vertical currents, Lorentz force, free energy, GOES X-ray flux, and transverse
fields in the white box of Figure2(b). The black and blue lines indicate the change in positive and negative magnetic flux in
Figure 3(a). It is significant that the negative magnetic flux increases during the emergence of sunspot S2, while the positive magnetic flux remains almost constant. The change in negative vertical currents is similar to the change in negative magneticflux
(see Figure3(b)). The Lorentz force increases rapidly at 08:00 UT
(the beginning of the emergence of sunspot S3) and at about 14:20 UT(three hours before onset of theflux rope eruption). The transverse fields and the Lorentz force reach their maximum values almost simultaneously (see Figures 3(c) and (e)). The positive vertical Lorentz force causes the flux rope to rise. Previous investigation indicates that the Lorentz force plays an important role in solar eruptions(Bi et al.2016). The transverse
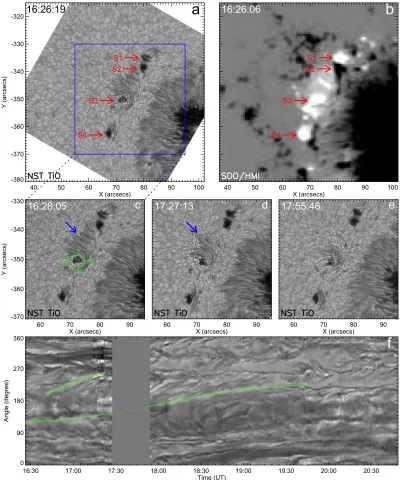
fields and the Lorentz force begin to decrease simultaneously at 15:20 UT. Because the transverse fields and Lorentz force are calculated in the photosphere, the decrease in these values suggests that the emergence of thefield is now completed. The free magnetic energy begins to increase when the flux rope appears(see Figure3(d)). After the emergence of theflux rope is completed, the decrease in free energy may be due to the eruption of some small chromosphericfibrils before theflux rope eruption. Figure4 shows the photospheric evolution of small satellite sunspots near the large sunspot observed by BBSO and SDO/ HMI. The TiO image and line-of-sight magnetogram observed by BBSO/NST andSDO/HMI are presented in Figures4(a)and
(b), respectively. Four small satellite sunspots are labeled S1, S2, S3, and S4 in Figures 4(a) and (b). All of the sunspots have positive polarity, except for S2, which has negative polarity. The four sunspots exhibit a clockwise rotation(see the animation of Figure 8). To obtain the rotation angle of sunspot S3, the circumference of a circle with a radius of 2″is mapped by a polar coordinate r-θframe centered on the middle of S3, as illustrated in Figure4(c). The resolution used in the angular direction is 1° to make the time slices (Zheng et al. 2016). The variation in rotation angle with time is calculated by tracing the penumbra of sunspot S3 (see Figure 4(f)). The green lines that trace two penumbral features show the rotation of penumbral filaments around the center of the circle. The rotation angles are 60°after 42 minutes and 110° after 200 minutes. The rotation of the sunspots implies that the twist is transferred from below the photosphere to the upper atmosphere(Sturrock & Hood2016). This is inferred from the increase of the twist in theflux rope that is associated with the rotation of the sunspot. Figures4(c)–(e) demonstrate the evolution of these sunspots before and after the M-class flare. The M-class flare starts at 17:40 UT, peaks at 17:46 UT, and ends at 17:49 UT (see the red curve in Figure 3(d)). The penumbra between sunspot S2 and sunspot S3 gradually decreases before the onset of the M-classflare(see the blue arrows in Figures4(c)and(d)). The disappearance of the penumbra is associated with the occurrence of the M-classflare
(see Figure 4(e)). That is to say, the disappearance of the penumbra between sunspots S2 and S3 is due to the rising of the
flux rope.
[image:5.612.47.291.53.342.2]The entire eruptive process of the small flux rope was caught by the observation of BBSO/NST. Figure5shows the eruption process for the M-class flare observed by BBSO/ NST (see the animation of Figure 10). The three columns from left to right are the H-alpha blue-wing (−0.6 Å), H-alpha center, and H-alpha red-wing(+0.6 Å)images. The contours superimposed on thefirst-row images are the levels of the line-of-sight magnetic fields. The green and blue contours indicate positive and negative magnetic polarity. The levels of the contours are±300 G and±800 G. The red Figure 3.Evolution of the magneticflux(a), the vertical current(b), the Lorentz
arrows mark the positions of the sunspots. The yellow arrows in Figures5(a)–(c)indicate theflux rope before its eruption. It is clear that the two footpoints of the flux rope are mainly rooted in sunspots S2 and S3. Some threads of theflux rope also seen to be rooted in the outer penumbra of the large sunspot, which is implied by the NLFFF extrapolations
(see Figures2(e),(f), and(g)). Before theflux rope eruption, a series of small chromospheric fibrils at the upper end of the flux rope first begin to erupt from 16:37:19 UT to 17:00:37 UT (see the green arrows in Figures 5(d)–(i)). At 17:09:05 UT, the upper part of the flux rope becomes darker and starts to erupt. A strong blueshift can be seen in the H-alpha blue-wing images. The closed magnetic field lines are opened and followed by a strong redshift in the H-alpha
red-wing images. Theflux rope starts to erupt at 17:40:12 UT, associated with a strong redshift at the upper end of theflux rope. At the beginning of the flux rope eruption, the whole body of the flux rope rotated counterclockwise. After the eruption of the flux rope, the closed magnetic field lines are opened again (see the H-alpha blue-wing and the H-alpha center observation at about 17:50:40 UT). These observations clearly show that before the onset of the large eruption, small eruptions of chromosphericfibrils occur as a precursor. Using observational data from the Swedish 1 m Solar Telescope
(SST) and Hinode, Guglielmino et al. (2010) found that
[image:6.612.106.508.52.532.2]reconnection between the small-scale emerging flux region and the overlying coronalfield produces the brightenings in the chromosphere, transition region, and corona, as well as Figure 4.Evolution of small satellite sunspots in active region NOAA 12403.(a)The NST TiO image shows the appearance of the small satellite sunspots, indicated by the red arrows.(b)The corresponding HMI magnetogram.(c)–(e)The change in small satellite sunspots in TiO images. The change in penumbra between S2 and S3 is indicated by the blue arrows. The green circle is the position of the time slice.(f)Time-slice plot acquired along the circle marked by a green circle in Figure4(c) and the green curved lines indicate the rotation of the penumbrafilament around the center of sunspot S3.
chromospheric surges. Our results are very similar to these observations. The change in topology in our study is also similar to what is found influx emergence simulations when the emerging
field pushes into an overlying field and reconnects with it
(Galsgaard et al.2005; Leake et al.2014; MacTaggart & Haynes 2014). The precursor of aflux rope eruption is also similar to the simulation results of MacTaggart et al.(2015), which show how the surges occur when a small-scale emerging flux region reconnects with ambientfields.
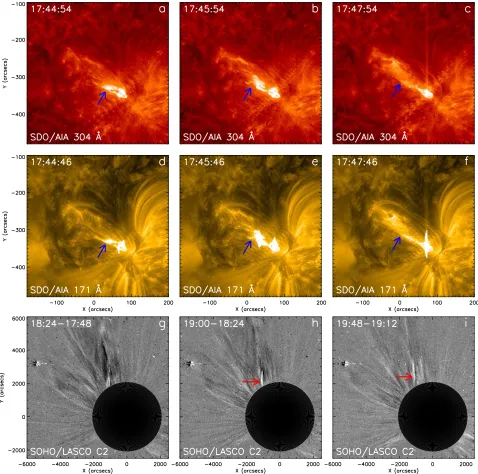
During theflux rope eruption, the plasma is ejected into the upper atmosphere (see Figures 6(a)–(f)). The blue arrows in Figures 6(a)–(f) indicate the flux rope during its eruption in 304 Å and 171 Å images. At 18:24 UT, LASCO C2 observed a coronal mass ejection(see Figures6(g)–(i)).
A data-driven MHD model for solar active-region evolution
(Jiang et al.2016a)is employed to provide further understanding
[image:8.612.67.545.51.525.2]of the process of emergence and eruption of thefield, which is shown in Figure7. Here the MHD simulation starts at 08:00 UT on August 24, when the small sunspot S2 just emerges near the small sunspot S3. The initial conditions consist of an NLFFF extrapolated from the vector magnetogram at this start time and a highly tenuous plasma in a hydrostatic state. Subsequently, the model is continuously supplied with a changing bottom boundary condition from the data stream of photospheric vector magnetograms observed by SDO/HMI. To self-consistently input the vector magnetograms at the boundary, the method of projected characteristics based on the wave-decomposition principle of the full MHD system (Wu et al. 2006) was used. The result of the simulation can be seen in Figures7(a)–(c)and in the animation of Figure 11. The evolution of the electric current in a cross section along (see Figures 7(d)–(f)) and perpendicular(see Figures7(g)–(i))to theflux rope is calculated Figure 6.M-classflare and CME observed inSDO304 Å and 171 Å images, andSOHO/LASCO C2. The blue arrows indicate the plasma ejection from the active region, while the red arrows indicate the small coronal mass ejection after theflux rope eruption.
from the simulation. It is clear that the magneticfield emerges in the course of the simulation fromt=0 to 41, as driven by the evolution of the photosphericfield. During the emergence of the
field, the current increases rapidly along the flux rope, and the rising of theflux rope can also be seen from the cross section of the current perpendicular to the axis of theflux rope. At around t=55, both the twisted magnetic flux and the corresponding current density decreased quickly, indicating the eruption of the
flux rope, which released some of the non-potential energy of the
pre-eruption field, after which the magnetic structure is closer to potential. These observation and simulation confirm the existence offlux rope in the solar eruptions(Xue et al.2016).
4. Conclusions and Discussions
Observational evidence of the emergence of a small-scale
[image:9.612.51.568.53.601.2]SDO. The small sunspot with negative polarity emerges near the small sunspot with positive polarity. During the emergence of the small-scale flux rope, the negative flux, the electric current, the Lorentz force, and the transverse magnetic fields increase gradually. The magnetic free energy calculated from the extrapolated three-dimensional magneticfields is found to be enough to power the M-class flare. The NLFFF extrapola-tion and the data-driven MHD simulaextrapola-tion also reveal the emergence of the flux rope. Moreover, the sunspots in which the flux rope was rooted exhibit clockwise rotation. These observations present a clear picture of solar eruptions: emergence of the small-scale flux rope leads to theflare and the CME.
There are several pieces of evidence that can confirm the emergence of the flux rope. First, the small sunspot with negative polarity emerged near the small sunspot with positive polarity. The negative magnetic fluxes and the electric current obviously increase at the emergence of the flux rope. Most of magnetic field lines of the flux rope extrapolated from the NLFFF were rooted in the two small sunspots. Second, the transverse magnetic fields increase atfirst and decrease about two hours before its eruption. Third, the change in upward Lorentz force also increases at the beginning of theflux rope and then decrease before the eruption of the flux rope, which is similar to that of the transverse of the magneticfields. Fourth, the sunspot rotation was observed during the emergence of theflux rope. Fifth, the twisted magnetic structures can be obtained from the NLFFF extrapolation. Sixth, the data-driven MHD modeling of the dynamic evolution of the coronal three-dimensional magneticfield recreates the emergence of theflux rope. Seventh, the free magnetic energy increases rapidly at the stage of theflux rope emergence. We observed sunspot rotation, shearing between the two opposite polarities, and the separation of the two small sunspots during emergence of thefield. This scenario is very consistent with simulations of the emergence of a twisted
flux tube from the subphotosphere to the corona(Magara2006; Fan 2009; Hood et al. 2009, 2012; Archontis et al. 2014).
Several surge-like eruptions were observed as the precursor of the eruption of the small-scale twistedflux rope. This agrees well with the prediction from emergingflux simulations of Galsgaard et al.(2005)and MacTaggart et al.(2015). Furthermore, as the
flux rope emerges, the Lorentz force produces shearing along the polarity inversion line between the two small sunspots, and the flux rope is carried upward by the positive Lorentz force. These observations match the simulation of MacTaggart & Hood
(2009)very well.
Helicalflux ropes are fundamental magnetic structures in some eruptive-flare models (Priest et al. 1989; van Ballegooijen & Martens1989; Rust & Kumar1994; Amari et al.2003; Gibson et al.2006; Fan2009). However, it is very difficult to determine whether the flux ropes form before or during eruptions. Much observational evidence supports the hypothesis that flux ropes already exist before the onset of solar eruptions(Liu et al.2003; Yan et al.2012; Chintzoglou et al.2015; Su et al.2015; Cheng & Ding2016; Vemareddy et al. 2016; James et al.2017). Others suggest thatflux ropes form during solar eruptions(Song et al. 2014; Cheng et al. 2010). Recent observations show that unwinding motion is often found during active-regionfilament eruptions(Yan et al.2014a,2014b; Zhang et al. 2015b), which implies that the active-region filaments may have twisted magnetic structures. Srivastava et al. (2010) presented direct observational evidence for the existence of a twisted magnetic structure in the corona. Owing to the spatial and temporal resolution of the data, where the twist offlux ropes comes from is not easy to observe, sunspot rotation is one possible way for injecting magnetic twists into the corona, and the twisted magnetic structures or solarfilaments are indeed observed after sunspot rotation(Yan et al.2012,2015; James et al. 2017). In some cases,flux ropes are formed by magnetic reconnection of sheared arcade loops(Chen et al.2014; Yang et al.2016; Wang et al.2017; Xue et al.2017). Another way is the emergence of twisted flux ropes from below the photosphere in many simulations (Magara 2006; Fan 2009; Hood et al. 2009; MacTaggart & Hood2009; Hood et al.2012).
[image:10.612.48.290.51.273.2]The formation process of small-scale flux ropes cannot normally be observed because we lack high-resolution photo-spheric magnetograms and chromophoto-spheric observations. Fortu-nately, the observations of NST andSDOcaught a clear process of the emergence of a small flux rope. In this study, the photospheric and chromospheric observations of NST, supple-mented bySDOobservations, can present the whole process of the formation of aflux rope associated with the emergence of a small sunspot (pore). Moreover, the two small sunspots at the footpoints of the flux rope exhibited a clockwise rotation. Sunspot S2 rotates around its center and moves away from sunspot S3 during emergence of theflux rope. This scenario is consistent with the emergence of a twisted flux rope. The increase in twist in theflux rope with time follows the rotation of small sunspots. It implies that sunspot rotation may play an important role in the increase of the twist of theflux rope, which propagates from below the photosphere to the upper atmosphere. In the past, many simulations have included high twist to generateflux ropes and CMEs in the atmosphere. Our results tie in well with such simulations (Galsgaard et al. 2005; Magara 2006; Fan2009; Hood et al.2009; MacTaggart & Hood2009; Hood et al.2012; MacTaggart et al.2015). Our observations give very strong evidence for small-scale highly twisted ropes emerging to form CMEs, as the simulations predict.
Figure 8.Online animation of vector magnetograms observed bySDO/HMI as shown in Figure2. The 4 s duration animation covers 24 hr on 2015 August 24.
(An animation of thisfigure is available.)
The eruptive mechanism for solar eruptions is also an open issue. Several models have been developed to address this question. Ideal MHD instability is one of these models(Hood & Priest 1979). Török & Kliem 2003 simulated the evolutionary process of a twistedflux rope and found that when the critical value of twist is higher than 2.75π, the flux rope cannot keep stable and will erupt. Some observations can also confirm their results (Srivastava et al. 2010; Kumar et al. 2012; Yan et al. 2014a, 2014b). In this study, the twist of the flux rope extrapolated from NLFFF is about three turns. When the small-scale magnetic region emerged from below the penumbra of the large sunspot, the overlying magneticfield was perpendicular to the axis of the flux rope. The flux rope exhibited a counter-clockwise rotation at the onset of its eruption, however, and the axis of the flux rope became antiparallel to the overlying
magneticfield. External reconnection between the emergingfield and the overlying magneticfield may weaken the tension of the coronalfield. This scenario is very similar to the simulations of MacTaggart & Hood(2009)and Leake et al.(2014). Therefore, reconnection between the emerging field and the preexisting extendedfield of the large sunspot also plays an important role in
flux rope eruption.
[image:11.612.70.546.53.285.2]We would like to thank the NST,SDO/AIA, andSDO/HMI teams for the high-cadence data support. This work is sponsored by the National Science Foundation of China(NSFC)under the grant numbers 11373066, 11603071, 11503080, 11633008, 11533008, by the Key Laboratory of Solar Activity of CAS under numbers KLSA201603, KLSA201508, by the Yunnan Science Foundation of China under number 2013FB086, CAS“Light of West China” Figure 10.Online animation of the NST H-alpha blue-wing, center, and red-wing images shown in Figure5. The 6 s animation covers∼2 hr from 16:25 to 18:35UT.
[image:11.612.52.566.347.527.2](An animation of thisfigure is available.)
Figure 9.Online animation of the evolution of small satellite sunspots in active region NOAA 12403 with NST TiO as shown in Figure4. The 16 s duration animation covers∼4.5 hr from 16:26 to 20:50UT.
Program, by the Youth Innovation Promotion Association CAS
(No.2011056), and the national basic research program of China
(973 program, 2011CB811400). The BBSO operation is supported by NJIT, US NSF AGS-1250818, and NASA NNX13AG14G grants, and the NST operation is partly supported by the Korea Astronomy and Space Science Institute and Seoul National University and by the strategic priority research program of CAS with Grant No. XDB09000000.
ORCID
C. W. Jiang https://orcid.org/0000-0002-7018-6862 E. R. Priest https://orcid.org/0000-0003-3621-6690
References
Amari, T., Luciani, J. F., Aly, J. J., Mikic, Z., & Linker, J. 2003, ApJ,
585, 1073
Antiochos, S. K., DeVore, C. R., & Klimchuk, J. A. 1999,ApJ,510, 485
Archontis, V., & Hood, A. W. 2013,ApJ,769, 21
Archontis, V., Hood, A. W., & Tsinganos, K. 2014,ApJ,786, 21
Bi, Y., Jiang, Y., Yang, J., et al. 2016,NatCo,7, 13798
Bobra, M. G., Sun, X., Hoeksema, J. T., et al. 2014,SoPh,289, 3549
Borrero, J. M., Tomczyk, S., Kubo, M., et al. 2011,SoPh,273, 267
Cao, W., Gorceix, N., Coulter, R., et al. 2010,AN,331, 636
Carmichael, H. 1964, NASSP,50, 451
Centeno, R., Schou, J., Hayashi, K., et al. 2014,SoPh,289, 3531
Chen, H., Zhang, J., Cheng, X., et al. 2014,ApJ,797, 15
Chen, P. F., & Shibata, K. 2000,ApJ,545, 524
Chen, Y., Du, G., Zhao, D., et al. 2016,ApJ,820, 37
Cheng, X., & Ding, M. D. 2016,ApJS,225, 16
Cheng, X., Ding, M. D., Guo, Y., et al. 2010,ApJ,716, 68
Chintzoglou, G., Patsourakos, S., & Vourlidas, A. 2015,ApJ,809, 34
Deng, L. H., Qu, Z. Q., Liu, T., & Wang, K. R. 2013,AN,334, 217
Fan, Y. 2009,ApJ,697, 1529
Filippov, B., Martsenyuk, O., Srivastava, A. K., & Uddin, W. 2015,JApA,36, 157
Fisher, G. H., Bercik, D. J., Welsch, B. T., & Hudson, H. S. 2012, SoPh,
277, 59
Forbes, T. G. 2000,JGR,105, 23153
Galsgaard, K., Moreno-Insertis, F., Archontis, V., & Hood, A. 2005, ApJ,
618, 153
Gibson, S. E., Fan, Y., Török, T., & Kliem, B. 2006,SSRv,124, 131
Goode, P. R., & Cao, W. D. 2010, Proc. SPIE, 8444, 03
Guglielmino, S. L., Bellot Rubio, L. R., Zuccarello, F., et al. 2010,ApJ,
724, 1083
Hirayama, T. 1974,SoPh,34, 323
Hood, A. W., Archontis, V., Galsgaard, K., & Moreno-Insertis, F. 2009,A&A,
503, 999
Hood, A. W., Archontis, V., & MacTaggart, D. 2012,SoPh,278, 3
Hood, A. W., & Priest, E. R. 1979,SoPh,64, 303
Hou, Y. J., Li, T., & Zhang, J. 2016,A&A,592, 138
James, A. W., Green, L. M., Palmerio, E., et al. 2017,SoPh,292, 71
Jiang, C. W., Wu, S. T., Feng, X. S., & Hu, Q. 2014,ApJ,786, 16
Jiang, C. W., Wu, S. T., Feng, X. S., & Hu, Q. 2016a,NatCo,7, 11522
Jiang, C. W., Wu, S. T., Feng, X. S., & Hu, Q. 2016b,RAA,16, 18
Joshi, N. C., Magara, T., & Inoue, S. 2014,ApJ,795, 4
Kliem, B., Lin, J., Forbes, T. G., Priest, E. R., & Török, T. 2014, ApJ,
789, 46
Kliem, B., & Török, T. 2006,PhRvL,96, 255002
Kopp, R. A., & Pneuman, G. W. 1976,SoPh,50, 85
Kumar, P., Cho, K. S., Bong, S. C., Park, S. H., & Kim, Y. H. 2012,ApJ,746, 67
Kumar, P., Yurchyshyn, V., Cho, K., & Wang, H. 2017,A&A,603, A36
Leake, J. E., Linton, M. G., & Antiochos, S. K. 2014,ApJ,787, 46
Leka, K. D., Barnes, G., Crouch, A. D., et al. 2009,SoPh,260, 83
Lemen, J. R., Title, A. M., Akin, D. J., et al. 2012,SoPh,275, 17
Li, L, Zhang, J., Su, J. T., & Liu, Y. 2016a,ApJ,829, 33
Li, T., Yang, K., Hou, Y. J., & Zhang, J. 2016b,ApJ,830, 152
Lim, E. K., Yurchyshyn, V., Park, S. H., et al. 2016,ApJ,817, 39
Lin, J., & Forbes, T. G. 2000,JGR,105, 2375
Lin, J., Murphy, N., Shen, C., et al. 2015,SSRv,194, 237
Liu, Y., Jiang, Y., Ji, H., Zhang, H., & Wang, H. 2003,ApJ,593, 137
Liu, Z., Xu, J., Gu, B. Z., et al. 2014,RAA,14, 705
MacTaggart, D., Guglielmino, S. L., Haynes, A. L., Simitev, R., & Zuccarello, F. 2015,A&A,576, 4
MacTaggart, D., & Haynes, A. L. 2014,MNRAS,438, 1500
MacTaggart, D., & Hood, A. W. 2009,A&A,508, 445
Magara, T. 2006,ApJ,653, 1499
Metcalf, T. R. 1994,SoPh,155, 235
Metcalf, T. R., Leka, K. D., Barnes, G., et al. 2006,SoPh,237, 267
Moore, R. L., Falconer, D. A., & Sterling, A. C. 2012,ApJ,750, 24
Moore, R. L., Sterling, A. C., Hudson, H. S., & Lemen, J. R. 2001,ApJ,
552, 833
Moreno-Insertis, F., & Galsgaard, K. 2013,ApJ,771, 20
Nóbrega-Siverio, D., Moreno-Insertis, F., & Martínez-Sykora, J. 2016,ApJ,
822, 18
Okamoto, T. J., Tsuneta, S., Lites, B. W., et al. 2009,ApJ,697, 913
Priest, E. R., & Forbes, T. G. 2002,A&AR,10, 313
Priest, E. R., Hood, A. W., & Anzer, U. 1989,ApJ,344, 1010
Priest, E. R., & Longcope, D. W. 2017,SoPh,292, 25
Régnier, S., & Canfield, R. C. 2006,A&A,451, 319
Rust, D. M., & Kumar, A. 1994,SoPh,155, 69
Rust, D. M., & Kumar, A. 1996,ApJ,646, L199
Schmieder, B., Aulanier, G., & Vrsnak, B. 2015,SoPh,290, 3457
Schou, J., Scherrer, P. H., Bush, R. I., et al. 2012,SoPh,275, 229
Schrijver, C. J., Elmore, C., Kliem, B., Török, T., & Title, A. M. 2008,ApJ,
674, 586
Shen, J. H., Wang, Y., Zhou, T. H., & Ji, H. S. 2017,ApJ,835, 43
Shen, Y., Liu, Y., & Su, J. 2012,ApJ,750, 12
Shibata, K., Masuda, S., Shimojo, M., et al. 1995,ApJ,451, 83
Song, H. Q., Chen, Y., Zhang, J., et al. 2015,ApJL,808, L15
Song, H. Q., Zhang, J., Chen, Y., & Cheng, X. 2014,ApJ,792, 40
Srivastava, A. K., Zaqarashvili, T. V., Kumar, P., & Khodachenko, M. L. 2010,
ApJ,715, 292
Sterling, A. C., Chifor, C., Mason, H. E., Moore, R. L., & Young, P. R. 2010,
A&A,521, 49
Sturrock, P. A. 1966,Natur,211, 695
Sturrock, Z., & Hood, A. W. 2016,A&A,593, A63
Sturrock, Z., Hood, A. W., Archontis, V., & McNeill, C. M. 2015, A&A,
582, 76
Su, Y. N., van Ballegooijen, A., McCauley, P., et al. 2015,ApJ,807, 144
Sun, X. 2013, arXiv:1309.2392
Tian, H., Yao, S., Zong, Q., He, J., & Qi, Y. 2010,ApJ,720, 454
Török, T., & Kliem, B. 2003,A&A,406, 1043
Török, T., Kliem, B., & Titov, V. S. 2004,A&A,413, L27
van Ballegooijen, A. A., & Martens, P. C. H. 1989,ApJ,343, 971
Vargas Dominguez, S., MacTaggart, D., Green, L., van Driel-Gesztelyi, L., & Hood, A. W. 2012,SoPh,278, 33
Vemareddy, P., Cheng, X., & Ravindra, B. 2016,ApJ,829, 24
[image:12.612.47.289.57.259.2]Wang, H. M., Cao, W. D., Liu, C., Yan, X., et al. 2015,NatCo, 7, 7008
Figure 11.Online animation of the data-driven MHD simulation offlux rope emergence and eruption shown in Figure 7. The 6 s animation covers 60 timesteps of the simulation.
(An animation of thisfigure is available.)
Wang, H. M., Ewell, M. W., Zirin, H., & Ai, G. X. 1994,ApJ,424, 436
Wang, J. C., Yan, X. L., Qu, Z. Q., Xue, Z. K., & Yang, L. H. 2017,ApJ,839, 128
Wang, J. X., & Shi, Z. X. 1993,SoPh,143, 119
Wang, Y. M., Ye, P. Z., Wang, S., Zhou, G. P., & Wang, J. X. 2002,JGR, 107, 1340
Wheatland, M. S., Sturrock, P. A., & Roumeliotis, G. 2000,ApJ,540, 1150
Wiegelmann, T. 2004,SoPh,219, 87
Wiegelmann, T., Inhester, B., & Sakurai, T. 2006,SoPh,233, 215
Wu, S. T., Wang, A. H., Liu, Y., & Hoeksema, J. T. 2006,ApJ,652, 800
Xiang, N. B., & Qu, Z. N. 2016,AJ,151, 76
Xue, Z. K., Yan, X. L., Cheng, X., et al. 2016,NatCo,7, 11837
Xue, Z. K., Yan, X. L., Yang, L. H., Wang, J. C., & Zhao, L. 2017,ApJL,
840, L23
Yan, X. L., Priest, E. R., Guo, Q. L., et al. 2016,ApJ,832, 23
Yan, X. L., & Qu, Z. Q. 2007,A&A,468, 1083
Yan, X. L., Qu, Z. Q., Kong, D. F., & Xu, C. L. 2012,ApJ,754, 16
Yan, X. L., Qu, Z. Q., Xu, C. L., Xue, Z. K., & Kong, D. F. 2009,RAA,9, 596
Yan, X. L., Xue, Z. K., Liu, J. H., et al. 2014a,ApJ,782, 67
Yan, X. L., Xue, Z. K., Liu, J. H., Kong, D. F., & Xu, C. L. 2014b,ApJ,
797, 52
Yan, X. L., Xue, Z. K., Pan, G. M., et al. 2015,ApJS,219, 17
Yang, B., Jiang, Y., Yang, J., Bi, Y., & Li, H. 2016,ApJ,830, 16
Yang, B., Jiang, Y., Yang, J., Hong, J., & Xu, Z. 2015,ApJ,803, 86
Yang, S. H., Zhang, J., Liu, Z., & Xiang, Y. Y. 2014,ApJ,784, L36
Zhang, J., Cheng, X., & Ding, M. D. 2012,NatCo,3, 747
Zhang, J., Li, L., & Song, Q. 2007,ApJ,662, 35
Zhang, J., Yang, S. H., & Li, L. 2015a,A&A,580, 2
Zhang, Q. M., Ning, Z. J., Guo, Y., et al. 2015b,ApJ,805, 4
Zheng, J., Yang, Z., Guo, J., et al. 2017, RAA, 17, 81
Zheng, J. C., Yang, Z. L., Guo, K. M., Wang, H. M., & Wang, S. 2016,ApJ,
826, 6