Manuscript version: Author’s Accepted Manuscript
The version presented in WRAP is the author’s accepted manuscript and may differ from the published version or Version of Record.
Persistent WRAP URL:
http://wrap.warwick.ac.uk/109411 How to cite:
Please refer to published version for the most recent bibliographic citation information. If a published version is known of, the repository item page linked to above, will contain details on accessing it.
Copyright and reuse:
The Warwick Research Archive Portal (WRAP) makes this work by researchers of the University of Warwick available open access under the following conditions.
Copyright © and all moral rights to the version of the paper presented here belong to the individual author(s) and/or other copyright owners. To the extent reasonable and
practicable the material made available in WRAP has been checked for eligibility before being made available.
Copies of full items can be used for personal research or study, educational, or not-for-profit purposes without prior permission or charge. Provided that the authors, title and full
bibliographic details are credited, a hyperlink and/or URL is given for the original metadata page and the content is not changed in any way.
Publisher’s statement:
Please refer to the repository item page, publisher’s statement section, for further information.
Mobility and Poisoning of Mass-Selected Platinum
Nanoclusters during the Oxygen Reduction Reaction
Jon Ustarroz*, Isabel M. Ornelas, Guohui Zhang, David Perry, Minkyung Kang, Cameron L.
Bentley, Marc Walker, Patrick R. Unwin*
Department of Chemistry, University of Warwick, Coventry CV4 7AL, U.K.
Nanoscale Physics, Chemistry and Engineering Research Laboratory, University of Birmingham,
Birmingham B15 2TT, U.K.
Research Group Electrochemical and Surface Engineering (SURF), Vrije Universiteit Brussel,
Pleinlaan 2, 1050 Brussels, Belgium
KEYWORDS
Oxygen Reduction Reaction (ORR); mass-selected nanoclusters; SECCM; carbon corrosion;
ABSTRACT
A major challenge in electrocatalysis is to understand the impact of electrochemical processes on
the physicochemical properties of nanoparticle or nanocluster (NC) ensembles, especially for
complex processes, such as the oxygen reduction reaction (ORR) considered herein. We describe
an approach whereby electrocatalysis at a small number of well-defined mass-selected Pt NCs
(Pt923±37, diameter, d≈ 3 nm) deposited from a cluster beam source on carbon-coated TEM grids,
can be measured by a scanning electrochemical cell microscopy (SECCM) setup, in tandem with
a range of complementary microscopy and spectroscopy techniques. The SECCM set up delivers
high mass transport rates and allows the effects of transient reactive intermediates to be elucidated
for different Pt surface coverage (NC spacing). A major observation is that the ORR activity
decreases during successive electrochemical (voltammetric) measurements. This is shown to be
due to poisoning of the Pt NCs by carbon/oxygen containing moieties that are produced by the
reaction of reactive oxygen intermediates (RIs), generated by ORR, with the carbon support. The
effect is most prominent when the Pt surface coverage on the carbon support is low (< 6%).
Furthermore, the NC deposition impact energy affects drastically the resulting Pt NC stability
during electrochemistry. For lower impact energy, Pt NCs migrate as a consequence of the ORR
and are rearranged in characteristic groups on the support. This previously unseen effect is caused
by an uneven flux distribution around individual NCs within the ensemble and has important
INTRODUCTION
Understanding electrocatalytic processes in nanoparticle (NP) assemblies is very challenging
because of the complex time- and history-dependent structure-activity-mechanism-stability
relationships that operate in such systems. This is particularly true for the oxygen reduction
reaction (ORR), for which the behavior of the most efficient (Pt and Pt alloy) catalysts is still not
completely understood.1–4 ORR processes on extended Pt surfaces have been extensively studied
by employing well-defined Pt single crystals,2,5,6 but highly dispersed supported NPs that provide
large surface areas and enhanced mass-specific activities are needed for practical applications. The
effects of catalyst loading and inter-particle interactions on the ORR mechanism, selectivity,
stability and the inherent activity remain under discussion and are undergoing revision.1,4,7–14 A
major consideration in the ORR is the balance between the 2 e- process (leading to H
2O2) and 4 e
-process (yielding H2O) and the action of the reactive oxygen intermediates (RIs) produced.
Most experimental studies have been performed on Pt NP dispersions, normally synthesized by
wet-chemistry methods, and deposited on high-surface-area carbon materials.1,15–18 Although there
have been important advances in understanding aspects of electrocatalysis,1,3,15,16,19–21 such
approaches incur difficulties, such as relatively poor control over the size, loading and spatial
distribution of the catalyst NPs. Moreover, solution-synthesized metal colloids are normally
stabilized by ligands and may undergo unwanted aggregation during deposition onto activated
carbon, inhibiting catalytic activity.22 Subtle differences in NP size, loading and geometrical
arrangement have recently been shown to affect drastically the catalyst activity1,7,12 and selectivity
(H2O2 vs H2O yield).8,23,24 Higher ORR activity for higher Pt loading (and hence smaller inter-NP
distance) is generally seen, for which there have been two explanations. Most simply, as H2O2 is
that H2O2 is reduced to H2O, enhancing the overall activity.23,24 Another hypothesis is that
decreasing the distance between NPs enhances the overlap between the electrical double layers of
neighboring NPs, which alters the energetics of adsorbed inhibiting species, which in turn
increases the surface-specific activity.7 Thus, the study of electrochemical processes in
well-defined and characterized NP geometries has become the priority in the field.4 To achieve this
goal, experiments need to satisfy a number of requirements as outlined below.
First, arrays of Pt NPs with very small size dispersion (ideally, none) and fine control over NP
coverage and inter-NP distance are required. This has been achieved by depositing mass-selected
clusters by vacuum deposition techniques on a variety of substrates,7,25 by dendrimer
encapsulation,26 or through the use of arrays of nanoelectrodes as a model.23,27,28
Second, the deposited NPs or nanoclusters (NCs) need to be characterized with the highest
possible resolution. Although in-situ electron microscopy29,30 and spectroscopy31 techniques
provide an improved understanding of nano-catalyst structure-activity relationships and
degradation mechanisms, beam damage29 or insufficient resolution can impose limitations. Ex-situ
TEM, especially aberration-corrected HAADF-STEM provides atomic resolution and is a
powerful technique to characterizeNCs32,33 even in three dimensions.33–35 Further, carbon-coated
TEM grids (CCTGs) can be used as electrodes for electrochemistry and have been proven suitable
for studies of catalyst degradation21,33,36–50 and electrochemical deposition.51–54 Notably, Identical
Location (IL)-TEM, has been successfully employed to discriminate between different
degradation mechanisms such as carbon corrosion, Ostwald ripening, NP migration-aggregation
and NP dissolution.21,36–41,43–46,48–50 However, high resolution TEM studies have not previously
Third, for the electrochemical response to be accurately linked with the structure, chemical
composition, geometrical arrangement, etc., probing the electrochemistry of a small number of
NCs is ideal. This has been tackled in different ways. ORR activities have been measured on
individual entities, such as single nanowires55 and NPs24,56 grown on (ultra)microelectrodes. High
resolution electrochemical imaging has been employed to probe other electrocatalytic reactions at
individual NPs,57,58 but these methods are normally limited to NPs of several tens of nm in
diameter, and the effects of catalyst loading and inter-particle distance are only just beginning to
be addressed.59 NP impact experiments are a further means of assessing the electrocatalytic
activity60 of individual entities within a small population, but studies relating activity to the
structure of a single NP from this type of experiment are rare.61 The use of nanopipettes to
characterise the size of individual NPs and deliver them to a support electrode is a further prospect
that will enhance such measurements.62
Fourth, it is also relevant to study the ORR under proton-exchange membrane fuel cell
(PEMFC)-like conditions, meaning high O2 mass transport rates, very low catalyst loadings (≤
1-10 µg/cm2), and extended potential range (E = 0.5-1 V).63,64 The study of model catalysts under
high mass-transport rates has been achieved by using flow cells,23,26,65 floating porous gas diffusion
electrodes64 or by growing single sub-micron Pt particles on carbon electrodes.24
Here, we present a novel multi-technique approach, designed to address all of the above
requirements. Our approach provides electrochemical measurements of a small number of
well-defined and characterized NCs, over an extended potential range and under high mass transport
rates. The NCs are studied on carbon-coated TEM grids which serve as an electrode and enable
subsequent HAADF-STEM imaging of a large proportion of the cluster population subjected to
information of the effect of electrochemistry on the arrangement of NPs on surfaces. These studies
are further complemented with XPS measurements. Together with the electrochemical
measurements, these studies reveal many insights on catalyst and support degradation processes.
RESULTS AND DISCUSSION
Depositing mass-selected clusters from a cluster beam source provides control over NC size and
density independently.66,67 Furthermore, the binding strength between NCs and the substrate can
be tuned by the voltage that is applied to the substrate during deposition.68 In this work,
mass-selected Pt NCs of 923 ± 37 atoms (Pt923; d≈ 3 nm) were synthesized in a magnetron-sputtering,67
gas-aggregation cluster beam source and deposited on CCTGs with two different impact energies
(0.54 and 1.6 eV/atom) and two different deposition coverages. More details are given in the
Methods section and Supporting Information, Section S1. Further information can be found
elsewhere.66,67 Representative HAADF-STEM images, size distributions, and NC distribution
parameters (diameter, d, particle density, N and surface coverage, SC) are shown in the Supporting
Information, Section S2. For clarity, hereafter, we refer to these samples as Low Density - Low
Impact Energy (LD-LIE, N≈ 5.2 – 6.1 x 1011 cm-2, SC ≈ 5.5 ± 1.1%), Low Density - High Impact
Energy (LD-HIE, N ≈ 6.3 - 6.5 x 1011 cm-2, SC ≈ 6.1 ± 1.0%), and High Density – High Impact
Energy (HD-HIE, N ≈ 2 – 2.3 x 1012 cm-2, SC ≈ 36.9 ± 1.9%). These distributions correspond to
Pt loadings of, approximately, 0.1 µg/cm2 and 0.85 µg/cm2 for the low and high density,
respectively, which are in the range or even lower than the catalyst loadings presently been
investigated for PEMFCs (≤ 1-40 µg/cm2).1,64
The Pt/CCTGs were studied with a scanning electrochemical cell microscopy (SECCM) setup
of the probe containing a Pd-H2 quasi-reference counter electrode (QRCE), filled with 0.1 M
HClO4 supporting electrolyte. The CCTG was placed on an inverted optical microscope, allowing
micron spatial resolution optical visualization of the positions where the electrochemical
measurements were performed (Figure 1b); see Methods section for further information. The
working electrode probe was brought into meniscus contact with the CCTG to create a working
electrode of ca. 1 m diameter. By means of this approach, the electrochemical activity of
approximately 5000 to 16000 clusters (depending on the cluster density) was measured. Ex-situ
HAADF-STEM analysis could subsequently be performed in the area exposed to the
electrochemical process, as such areas appeared brighter (Figure 1c) as a consequence of the ORR
measurements (this phenomenon is discussed later). This approach also allowed the study of
catalyst NC degradation processes, since a representative region ‘just outside’ the area probed
electrochemically (equivalent to the situation before electrochemistry) could also be imaged for
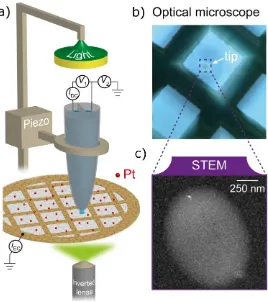
Figure 1 a) Schematic of the carbon-coated TEM grid (with Pt NCs) mounted on an inverted optical
microscope equipped with a dual-barrel SECCM setup. b) Optical microscope image showing the
exact position where the SECCM tip is landed on the TEM grid. c) HAADF-STEM image showing
the footprint of the area that was in contact with the SECCM meniscus (≈ 1 µm2)
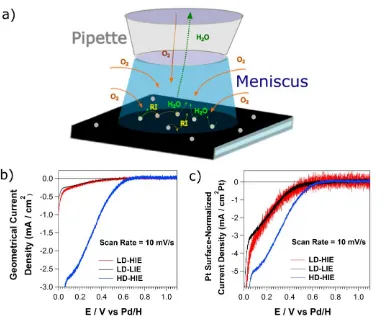
The diffusion of O2 to the CCTG surface is both through the electrolyte solution (from the
pipette) and across the aqueous-air phase72 (see also scheme in Figure 2a), providing
mass-transport rates of the order of 0.1 cm s-1 or higher,72 at least an order of magnitude higher than with
the standard rotation rates employed in an RDE setup (1000 - 2000 rpm).19 This 3 phase
[image:9.612.179.447.71.373.2]Oxygen reduction reaction on mass-selected Pt NCs
Figures 2b and 2c show cyclic voltammograms (CVs) recorded at 10 mV s-1 in air-saturated
0.1 M HClO4 solution for the two different particle densities and impact energies during
deposition. The currents were normalized: (a) by the footprint of the droplet (see Figure 1, bottom
right), in order to obtain the geometrical current densities; and (b) by the Pt surface area of each
individual experiment, as obtained from STEM imaging (see, for example Figure S2, Supporting
Information, Section S2) considering each nanocluster as hemispherical.7
Although electrochemical cleaning is normally carried out to remove contamination from the Pt
NCs, accelerating the ORR kinetics, it can also affect the structure and organisation of the NCs on
the surface. To demonstrate this, a standard electrochemical cleaning procedure was carried out
on LD-HIE and HD-HIE samples and was shown to reduce the overpotential for the ORR onset in
approximately 80 mV, but to cause significant changes in the Pt NC distribution (see Supporting
Information, Section S3). Therefore, we did not apply any cleaning treatment to the substrates after
NC deposition, to avoid any possible change in the structure and organisation of the NCs on the
surface.
Figures 2b and 2c show that, in the absence of electrochemical cleaning, the onset potential of
the ORR is about 0.7 V for the high density sample and shifts to about 0.6 V for the two low
density samples. Similar onset potentials have been reported for the ORR on extended Pt surfaces
(flame annealed and protected by a droplet of water before study, and also subjected to in-situ
electrochemical cleaning) under high mass transport conditions72 and on small Pt nanoclusters (d
< 1 nm).8,25,65 More specifically, an onset of approx. 0.7 V vs RHE can be found for a distribution
between 3 and 25 times higher than the loadings reported in the current manuscript (0.1 and 0.85
µgPt cm-2). The ORR proceeds in kinetic or mixed control over an extended potential range, down
to E ≈ 0.2 V. This behavior has been reported when the ORR is measured under high mass transport
rates.23,24,26,72 At E ≈ 0.2 V, the current starts to level-off. At E ≈ 0.05 V, before having reached a
plateau, the current magnitude increases drastically, which can be attributed to H2 evolution.
For the SECCM configuration with a tip of this size, a limiting current of roughly 6 mA/cm2
would be expected72 for a 4 e- ORR process on the HD-HIE sample where essentially complete
diffusional overlap would occur (Pt surface coverage ca. 37%). However, the apparent limiting
current measured for the HD-HIE sample is only about 2.7 mA/cm2. It is known that hydrogen
adsorbs in Pt at E ≤ 0.3 V and that, in this potential range, the 4e- ORR is no longer possible due
to adsorbed hydrogen.6,15,73–77 In this potential range, a 2e- process would be expected, in line with
the currents measured. For the LD samples, the maximum current densities measured before H2
evolution proceeds are, approximately, 0.3 mA/cm2. Such low current densities cannot be related
to O2 diffusion limitation, even if a 1e- reduction was considered. With low Pt NC coverage (<
6%) and the high mass transport rates provided by the SECCM setup, the current limitation arises
from the blocking of active sites by adsorbed hydrogen and a poisoning of the Pt surface, even
during the course of the first voltammetric scan (discussed later). This would also explain why the
Figure 2 a) Schematic of the fluxes of reactants and products in the SECCM setup. The flux of O2
towards the electrode is provided by diffusion down the barrels of the pipette as well as across the
air-water interface. The flux of RIs and H2O out from the interface is only possible up the barrel.
RI: reaction intermediate. Linear sweep voltammograms (LSVs) recorded with a dual-barrel
SECCM setup on a carbon-coated TEM grid with mass-selected Pt NCs, deposited with various
NC densities and impact energies: geometrical (b) and Pt surface normalized (c) current densities.
All the voltammograms were recorded at 10 mV s-1 in an air-saturated 0.1 M HClO
4 solution.
When normalized by the Pt surface area (Figure 2c), the CVs also show that a slightly lower
current density for the samples with lower Pt NP coverage, over the whole potential range. This
further emphasizes that, under these conditions (low Pt NP coverage (< 6%) and high mass
[image:12.612.115.505.72.399.2]being further reduced,8,23,24,26 resulting in a lower average number of electrons transferred than in
the HD-HIE sample, as well as promoting side reactions with the carbon support. The mass
transport asymmetry of the experimental setup (enhanced flux of reactants due to gas/liquid
transfer, see Figure 2a), whereas reaction intermediates (RIs) and products are confined to the
solution, promotes this effect, as discussed later.
In addition, it must be noted that the Pt surface-normalized current densities for the two different
LD samples are very similar, independent of the deposition impact energy. This means that subtle
differences in the shape (i.e., aspect ratio) of the clusters caused by the different impact energies
(see Supporting Information, Section S2) do not influence significantly the ORR activity. Further,
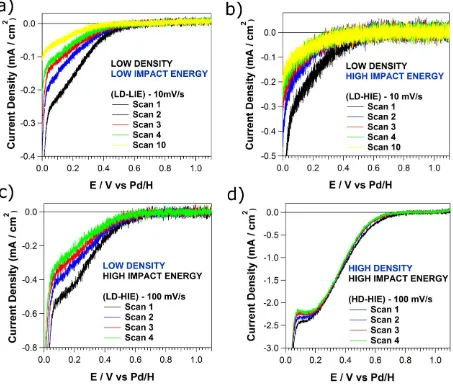
Figures 3a and 3b show consecutive scans recorded at 10 mV s-1 on the LD-LIE (3a) and LD-HIE
(3b) samples. In both cases, a decrease of the electrochemical current across the entire potential
Figure 3 Consecutive LSVs recorded on a carbon-coated TEM grid with mass-selected Pt NCs,
deposited with (a) low NC density and low impact energy, (b and c) low NC density and high
impact energy and (d) high density and high impact energy. The voltammograms were recorded
at (a,b) 10 mV s-1 and (c,d) 100 mV s-1 in an air-saturated 0.1 M HClO
4 solution.
Figures 3c and 3d show consecutive scans recorded at 100 mV s-1 on the LD-HIE (3c) and
HD-HIE (3d) samples. A comparison of Figures 3c and 3b reveals that the current densities measured
voltammetric scan is more gradual. This reinforces the idea that, when the scan rate is low (long
timescale), the Pt surface is more susceptible to poisoning. In contrast, there is almost no change
in current-voltage response for the HD-HIE sample at 100 mV s-1 (3d). We can therefore conclude
that a decrease of the ORR activity after consecutive CV scans, and even during the first scan for
low scan rates, occurs for very low Pt surface coverage. In the next sections we examine the
possible causes of the electrochemically induced activity loss.
Decrease of the ORR activity under high mass-transport conditions
The decrease of the electrochemical activity of carbon supported Pt NP or NC catalysts, Pt/C,
during ORR has been reported extensively.3,21,37,39,44,78 The degradation mechanisms considered
are Pt dissolution, Pt cluster migration-aggregation, Ostwald Ripening, Pt surface poisoning and
carbon corrosion which could induce weakening of the Pt-C surface interaction, inducing NP
migration or the detachment of Pt NPs. In principle, the decrease of current density with
consecutive scans reported in Figure 3 could be caused by any of these mechanisms.
Pt NCs (d < 1nm) are particularly prone to surface passivation by organic adsorbates,25 among
which CO is the most extensively studied.78 Carbon is oxidized to CO
2 electrochemically79 at E >
0.207 vs RHE and although the kinetics are very slow at E ≤ 1V,80 this process is catalyzed by
small Pt NCs.81 The carbon support may also be oxidized chemically by the attack of RIs,82–86
which can be generated transiently in the ORR.
The most prominent RI generated through the ORR is hydrogen peroxide, which may attack
carbon chemically.82,84,85 To assess whether this was important for the processes studied herein, a
series of cyclic voltammograms were run with different amounts of H2O2 on the LD-HIE working
was involved in the poisoning of the Pt NCs. H2O2 did not affect the ORR current-voltage response
or the pattern of voltammetric deterioration with scan number. Thus, any catalyst poisoning is as
a consequence of the ORR and is related to RI by-products other than H2O2.
The superoxide anion radical (O2•-)87–90 hydroxyl radical (•OH),91–93 and hydroperoxyl radical
(•OOH)94 have all been detected as products from the ORR in PEMFCs91,95,96 or in aqueous
alkaline or neutral solutions.89,90,94,97–99 They have also been detected directly88,94 or indirectly99 in
small concentrations and suggested75,76,100 as ORR reaction intermediates in acidic solutions.
Whereas at an extended Pt electrode, these RIs will be further reduced to hydrogen peroxide or
water at vicinal Pt sites, due to the high mass transport rates in an SECCM setup and the small size
and low coverage of the Pt NCs, these RIs can readily diffuse to, and react with, the carbon support
near the NCs,81 and the product(s) of this reaction (including CO) may adsorb on, and poison, the
Pt NCs.84 This effect would obviously be more prominent for the LD NC ensembles, as found
herein.
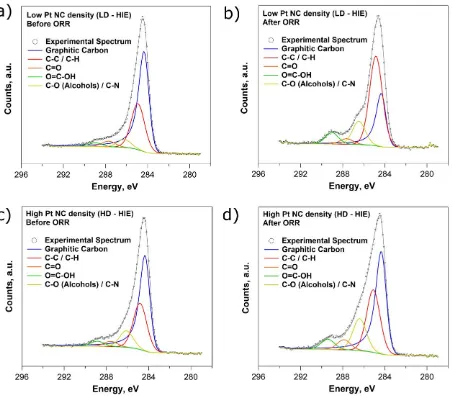
XPS measurements were performed on the LD-HIE and HD-HIE samples before and after a
series of CVs (200 scans at 200 mV s-1) to investigate the effect of the ORR on the chemical
composition of the carbon support.36,80,101 The relative composition of Pt, C and O before and after
ORR is summarized in the Supporting Information, Section S5, Table S3. Interestingly, the oxygen
to carbon ratio increased significantly after the ORR for the LD-HIE case (from 0.16 to 0.38)
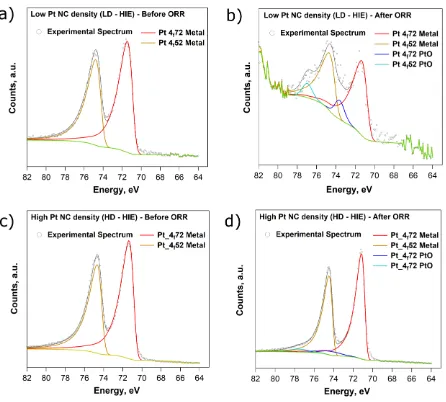
whereas it stayed almost constant in the HD-HIE case (change from 0.25 to 0.28). Figure 4 shows
XPS spectra between the binding energies Eb = 278 eV and Eb = 296 eV, corresponding to the C
1s peak and its deconvolution into different chemical bonds. It can be seen by inspection of Figures
4a (before ORR) and 4b (after ORR) that the chemical signature of carbon changes significantly
amount of graphitic carbon decreased significantly (from 53% to 22%), whereas the contribution
from C-C/C-H and C-O increased significantly (from 34% to 53% and from 6% to 14%,
respectively). The contribution of O=C-OH and C=O remained almost unchanged, before and after
electrochemistry (4-7% and 3% respectively). In contrast, for the HD-HIE sample (Figures 4c and
4d), the ratio between graphitic carbon and C-C/C-H, was largely unaffected by the ORR (the
contribution of graphitic carbon slightly decreases from 48% to 40% and the contribution of
C-C/C-H remains about 33%). An increase in C-O is apparent (from 12% to 17%) and the relative
Figure 4 XPS spectra of the C 1s peak from a carbon-coated TEM grid with mass-selected Pt NCs
deposited with (a,b) low NC density and (c,d) high NC density, (a,c) before and (b,d) after 200
voltammetric scans from E = 0 V to E = 1.1 V vs Pd-H2 at 200 mV s-1.
The different evolution of the surface chemistry of the carbon support for the LD and HD
samples, after driving the ORR for the same time and extent, is clear evidence of differences in
geometrical arrangement of NCs on the carbon support. When the coverage of Pt NCs is low, RIs
are more likely to escape from the Pt surface and chemically attack the carbon support. The
hydroxyl (•OH) or hydroperoxil (•OOH) radical have been suggested as the cause of increase in
oxygen containing functional groups of carbon supports after ORR in acidic solutions,36 and the
•OH radical preferentially attacks sp2 graphitic carbon.83 When the coverage of Pt NCs is higher
(HD-HIE), RIs are less likely to attack the carbon support, because this process is in parallel with
the further reduction of RIs species at the higher coverage of neighboring Pt NCs. Note that XPS
spectra of the same CCTGs with no Pt NCs were also acquired before and after the same CV cycle
regime (not shown) and no changes in the carbon C 1s peak were detected. Therefore, it is clear
that the RIs that attack the carbon support are formed at the Pt NCs during the ORR and that the
extent of attack increases as the Pt NC coverage decreases.
Figure 5 shows XPS spectra between the binding energies Eb = 63 eV and Eb = 82 eV,
corresponding to the Pt 4f peak and its deconvolution into metallic and oxidized Pt for both the
LD-HIE sample, before (a) and after (b) the ORR, and the HD-HIE sample, before (c) and after
(d) ORR. The relative contributions of both oxidation states are shown in the Supporting
Information, Section S5, Table S5. Only metallic Pt is seen before the ORR, for both samples.
Since, the CVs are finished at E = 1 V, it would be expected that, after the ORR cycles, the Pt NCs
would be partially oxidized. However, although an error of ±2% must be borne in mind, it is
evident from Figure 5 and Table S5 of the Supporting Information that the ratio of oxidized to
metallic Pt is larger in the LD (0.15 ± 0.03) than in the HD (0.03 ± 0.02) case. We note that the
HD sample consists of both isolated and aggregated clusters, but a detailed analysis of the STEM
images indicates that the Pt surface to volume ratio of the LD sample is only 1.25 times higher
ratios between these two samples. Rather, these data suggest that carbon surface oxides, from the
carbon corrosion process, are bound to the Pt NCs and explain the severe poisoning seen, for the
[image:20.612.77.523.165.567.2]LD samples.
Figure 5 Figure 4 XPS spectra of the Pt 4f peak recorded on a carbon-coated TEM grid with
mass-selected Pt NCs deposited with (a,b) low NC density and (c,d) high NC density, (a,c) before and
Further analysis of the Pt 4f peak revealed a difference in the binding energy of the oxidized Pt
contribution between the HD (Eb = 74.2 eV) and LD (Eb = 73.6 eV) samples, with a larger peak
separation for the HD case. The low amount of Pt in the LD case and the consequent noise of the
Pt 4f XPS spectra, does not allow us to draw definitive conclusions about the Pt surface state, but
it is clear that, when the Pt NC density is low, driving the ORR leads not only to a higher amount
of oxidized Pt, but also a surface that is chemically distinct from the HD case.
HAADF-STEM analysis
A deterioration of the carbon support, as identified in the previous section, has been related to
the detachment or migration-aggregation of Pt NCs,36 which induce electrochemical activity
losses. To reveal whether Pt NC migration-aggregation, detachment, dissolution or Ostwald
Ripening contribute to the gradual loss of activity seen in the voltammetric scans (Figure 3), a
thorough microscopic analysis of the Pt NC distributions was performed just outside (equivalent
to “before ORR”) and inside (equivalent to “after ORR”) the areas where the ORR was executed
for different times (voltammetric scan rates). This analysis considered the effect of deposition
impact energy on NC stability.
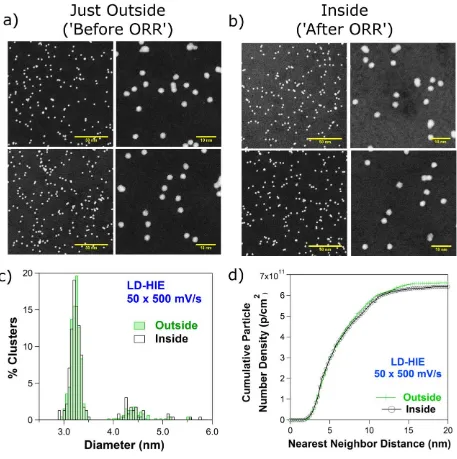
Figure 6 shows representative HAADF-STEM images and corresponding size and cumulative
Nearest Neighbor Distance (NND) histograms of the LD-HIE sample after a series of cyclic
voltammograms. Figure 6a displays HAADF-STEM images taken just outside two SECCM
regions where 50 scans at 500 mV s-1 (first row) and 15 scans at 10 mV s-1 (second row) were
performed, while Figure 6b shows characteristic images taken inside these spots. At first sight,
there are no obvious differences in NC size or geometrical arrangement between these neighboring
Figure 6 Representative HAADF-STEM images of Pt NCs deposited on a carbon coated TEM grid
with low NC density and high impact energy (a) before and (b) after (first row) 50 scans at 500
mV s-1 and (second row) 15 scans at 10 mV s-1. Pt NC (c) size and (d) cumulative nearest neighbor
Figures 6c and 6d show the particle size and cumulative NND histograms for the case of 50
scans at 500 mV s-1. The particle size is almost identical outside (‘before ORR’) and inside (after
‘ORR’) the electrochemically measured area. The geometrical NC arrangement, as indicated by
the cumulative NND histogram, is also unchanged by the electrochemistry. This was found for the
whole range of cyclic voltammograms recorded for different number of cycles and scanning rates
of the LD-HIE sample (see Supporting Information, Section S6).
The data in Figure 6 are highly significant: one can rule out Ostwald Ripening, Pt dissolution
and Pt NC detachment as being responsible for the loss of electrochemical activity. NC
migration-aggregation can also be excluded, since there is no increase in the number of aggregates
(Supporting Information, Section S7, Figure S11a). A similar analysis was performed on the
HD-HIE sample. There were no obvious changes in the size distribution or geometrical arrangement
(including sintering) of the Pt NCs (Supporting Information Section S7).
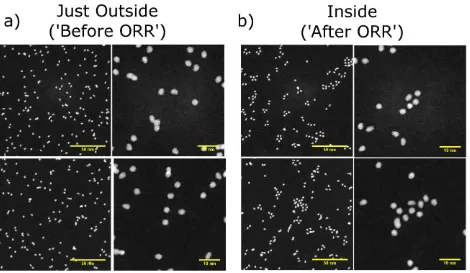
Figure 7 shows representative HAADF-STEM images of the LD-LIE sample after cycling
through the ORR with different scan rates. Figure 7a displays HAADF-STEM images from the
region immediately outside two SECCM spots where 20 voltammetric scans at 50 mV s-1 (first
row) and 50 scans at 100 mV s-1 (second row) were carried out. Figure 7b shows characteristic
HAADF-STEM images inside the spots. Substantial differences in the geometrical arrangement of
NCs after voltammetric scanning are found: the NCs become arranged in groups of several NCs
Figure 7 Representative HAADF-STEM images of Pt NCs deposited on a carbon coated TEM grid
with low NC density and low impact energy (a) before and (b) after (first row) 20 scans at 50 mV
s-1 and (second row) 50 scans at 10 mV s-1.
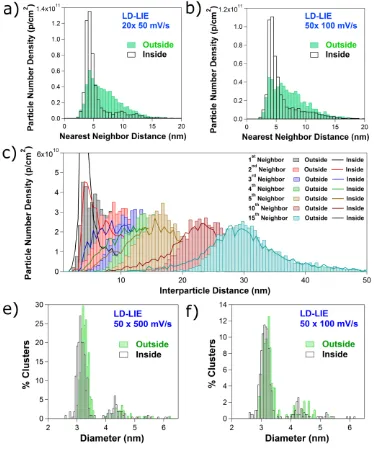
The drastic changes in the Pt NC arrangement for the LD-LIE sample, upon electrochemical
cycling, are quantitatively represented by the NND histograms shown in Figures 8a and 8b and the
cumulative NND histograms shown in the Supporting Information, Section S8, figure S12b and
S12c. Whereas before cycling, the NND is broadly distributed between 3 and 15 nm, after driving
the ORR, approximately 75% of the clusters are separated by less than 5.5 nm from their nearest
neighbor.
To quantitatively assess the arrangement of the Pt NCs, an analysis of the Nth Nearest Neighbor
Distance (with N from 1 to 15) before and after 50 voltammetric scans at 100 mV s-1 is shown in
values, being particularly evident for the 5 nearest neighbors, but also seen for higher neighbor
[image:25.612.116.490.142.592.2]numbers, such as 10th and 15th neighbors.
Figure 8 Nearest neighbor distance histograms before and after (a) 20 scans at 50 mV s-1 and (b)
50 scans at 100 mV s-1. (e) Interparticle distance histograms for the 15 nearest neighbors before
and after 50 scans at 100 mV s-1. Pt NC size histograms before and after (e) 50 scans at 500 mV s
The analysis of HAADF-STEM images after other series of cyclic voltammograms with
different voltammetric scan rates (see Supporting Information Section S8, Figure S12) leads to the
same conclusion: NC re-arrangement within the LD-LIE sample occurs during ORR voltammetric
experiments and a larger extent of clustering is found for longer total polarization times. To be
certain that the contact and release of the meniscus did not affect the stability of the Pt NCs for the
LD-LIE sample, the same pipette was approached and left in meniscus contact with the CCTG for
a similar time as for the voltammetric measurements reported, but without applying any potential.
After removal of the meniscus, no changes in the NC distribution were observed.
The size distributions of the LD-LIE NCs before and after 50 scans at 500 mV s-1 and 50 scans
at 100 mV s-1 are shown in figures 8e and 8f. These is a slight shift towards smaller sizes: the
average NC diameter changes from 3.22 ± 0.12 nm to 3.11 ± 0.14 nm (e) and from 3.16 ± 0.15 to
3.09 ± 0.15 nm (f), indicating that a small extent of Pt dissolution may occur, but not to account
for the significant decrease of electrochemical activity during ORR reported in Figure 3a. A
summary of all parameters deduced from microscopy, before and after ORR experiments, is given
in Supporting Information section S8, Table S7.
The high magnification images in Figure 7b, and the statistical evaluation of the number of
singlets, doublets and larger clusters inside and adjacent to the areas probed by SECCM
(Supporting Information, Section S7, Figure S11b), indicates that NCs are arranged into
characteristic groups, but without aggregation. A similar arrangement has been observed
previously for Pt NCs soft-landed on HOPG with lower impact energy (typically at 0.1
eV/atom).102–104 Among reasons for this behavior,102–104 NC patterns of this type have been
readily adsorb on the Pt surface even under UHV conditions. In our case, the edge-to-edge distance
between NCs is ca. 1.5 nm, close to the ~ 1.2 nm seen in UHV deposition studies. This further
reinforces the idea, proposed above, that RIs generated during the ORR react with the carbon
support, and as a consequence, a layer of carbon and oxygen containing reaction products adsorbs
at the surface of the Pt NCs. This would, on the one hand, prevent the Pt NCs from sintering, and
on the other hand, hinder the ORR at the poisoned surface, as observed.
Although STEM imaging cannot identify which species may be covering or poisoning the Pt
surface, the brighter background in the STEM images of regions of the CCTGs where
electrochemical measurements have been made (e.g. Figure 1c) is reminiscent of contamination
build-up during STEM imaging, caused by the polymerisation of carbonaceous species induced
by the electron beam.105,106 It is tempting to speculate that the brighter background observed is
caused by a similar process, but one induced by electrochemistry, in line with the XPS analysis
presented earlier.
Nanocluster migration during ORR
The migration of weakly bound supported NCs during electrochemistry is an emerging
phenomena that has been reported during electrodeposition52–54,107,108 and other electrochemical
processes,50,109,110 but the physicochemical processes that drive this migration have not been
analyzed in detail. The experimental SECCM setup (see Figure 1 and Figure 2a) does not presently
allow the measurements to be done in oxygen-free electrolyte. Thus, although random (or
directional) movement of the clusters caused by potential cycling alone (rather than by the ORR)
measurement time, rather than the voltammetric scan rate (Supporting Information, Figure S12)
favors the idea that the movement is caused by the ORR.
Recently, it has been postulated that when a NP is weakly bound to a surface and an
electrochemical reaction occurs non-uniformly at the NP surface, there is an electrochemical
propulsion of the NP, resulting in its detachment from the surface.111,112 Self-generated motion of
nano-objects has been investigated for NPs, nanorods and microparticles in solution, with113–116
and without117–121 an applied external electric field. In essence, when different (i.e., bipolar)
electrochemical reactions occur at the opposite sides of a nanoentity, gradients of ions and of other
chemical species are generated. Two possibilities for driving NP motion have been considered: (i)
the electrical field resulting from a gradient of ions drives the motion of the NPs by
self-electrophoresis; (ii) gradients in the concentration of solute molecules generates fluid flow which
results in the motion of the NPs in the opposite direction by self-diffusiophoresis.119 In this regard,
since local chemical gradients can also cause local surface tension gradients, Marangoni effects
could locally drive the liquid from low to high surface tension, resulting in NP motion in the
opposite direction.117
Although our studies concern monometallic Pt NCs, chemical concentration gradients of ions
(protons), reactants (O2 and protons) and reaction products (ROS) are generated because the NCs
are non-uniformly distributed on the support surface and the flux of reactants (O2 and protons)
and products will be higher at those (parts of) NCs, which are less diffusionally coupled to
(shielded from reactants by) neighboring NCs. This would result in non-uniform electric fields
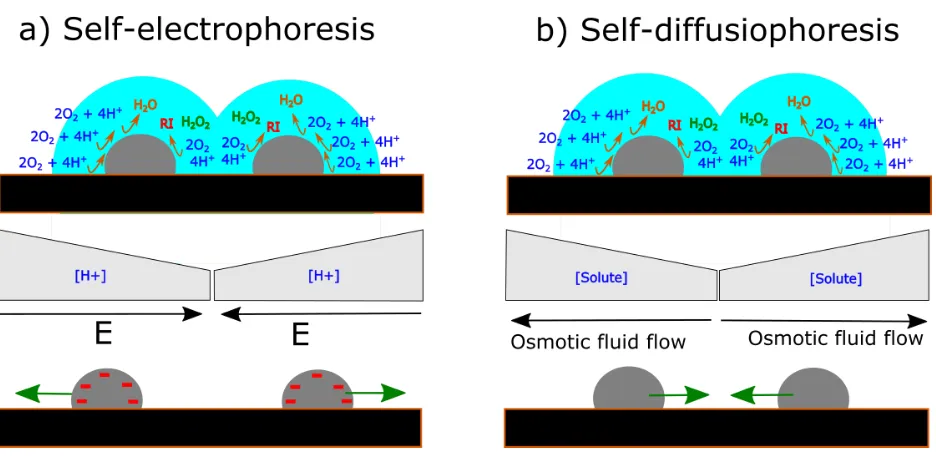
Figure 9 Schematic representation of two possible driving forces for NC migration due to
non-uniform rates of ORR at different parts of Pt NCs as a result of different extents of diffusional
shielding. a) Self-electrophoresis: a gradient of protons generates an electric field that would push
the particles away from each other. b) Self-diffusiophoresis: the stoichiometry of the ORR would
lead to a gradient of solute molecules that would drag the solvent through osmosis towards the
diffusionally uncoupled region. This in turn would exert a force into the NCs in the opposite
direction.
Although a self-electrophoretic mechanism (Figure 9a) could contribute to NC motion, the
proton concentration will be lower at the coupled (shielded) parts of the NCs, leading to an electric
field that would push the negatively charged Pt NCs away from each other, which is opposite to
what is seen experimentally. Alternatively, a self-diffusiophoretic mechanism, which has also been
shown to result in motility of colloids,119 would be a more plausible driving force since it would
FEM simulations were implemented to test the reasonableness of these arguments through a
model which precisely represented the NC geometrical arrangement on the support surface. Full
details of the simulations are presented in the Supporting Information, Section S9. Briefly, NC
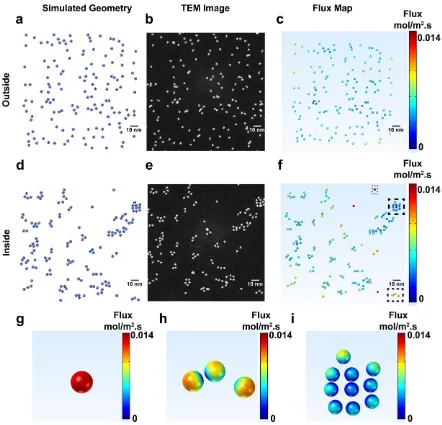
locations were extracted from TEM images taken from areas that were located immediately outside
(Figures 10a and 10b) or inside (Figures 10d and 10e) the SECCM meniscus on the LD-LIE sample
in order to precisely mimic the experimental arrangement of NCs. The NCs were electrochemically
active, the support was inert, with reactant species, A (concentration 0.2 mM, similar to O2 in
aerated solution), undergoing simple diffusion-controlled electron transfer at the NCs.
From these simulations, flux maps could be extracted, as exemplified in Figures 10c and 10f.
Due to the randomness of the NC distribution before any electrochemical measurement (Figures
10a, 10b and 10c), there is an inhomogeneous distribution of flux around different NCs. Zooming
in on individual NCs in Figures 10g, 10h and 10i, it can be seen that this uneven distribution of
flux around individual NCs is highly dependent on their clustering. Where NCs are shielded by
neighboring NCs, a lower flux is seen whereas isolated particles exhibit more even distributions
of higher flux. The flux distribution becomes more inhomogeneous when the particles move closer
Figure 10 Simulated Pt NC positions (a,d) taken from STEM micrographs (b,e) in a region just
outside (a-c) or at which SECCM measurements had been performed (d-f). Flux maps (c,f)
extracted from FEM simulations,revealing an uneven distribution of flux around individual NPs.
The fluxes at individual NCs highlighted in (f) are shown in (g-i).
Since re-arrangement of the Pt NCs could affect the electrochemical current measured for ORR,
Supporting Information Section S9, a model array of 9 NPs with varying separation is considered,
with a schematic of the simulation domain presented in Figure S14. As expected, as the NC
separation becomes smaller, there is significant diffusional overlap between neighboring NCs.
Analysis of the overall diffusion-limited current for the NC distributions typical of inside and
outside the SECCM meniscus, presented in Figure 10, reveals only ca. 2% fall in the current
following the change in NC arrangement between ‘out’ and ‘in’, and this cannot account for the
significant decrease in electrochemical activity observed experimentally during voltammetric
cycling such as presented in Figure 3. Thus, although NCs can move around on the surface, this
would have little impact on the overall mass transport limited currents. The ORR is more complex,
involving transient RIs, and the overall current will be more sensitive to the NC arrangement.
While NC movement on the surface will contribute to some of the loss of activity seen for the
ORR in NC arrays, the main factor responsible is poisoning of the surface, for which the NC
density is particularly important.
CONCLUSIONS
We have presented an approach that allows electrocatalytic measurements of a small number of
well-defined and characterized NCs under high mass transport rates, combined with high
resolution HAADF-STEM imaging of a large fraction of the same NCs. The interpretation of
electrochemical data combined with statistical analysis of high resolution STEM images and XPS
characterization of the substrate surface, has provided major insights into the ORR mechanism at
the nanoscale under conditions of low catalyst loading, high mass transport conditions and
Under the high mass transport conditions inherent in the SECCM setup, the ORR
electrochemical response at Pt923 NCs (d≈ 3 nm) becomes limited by H adsorption at E ≤ 0.2 V,
and is strongly affected by the extent of voltammetric measurements are made, deteriorating with
time, especially when the Pt surface coverage is low. Under these experimental conditions, particle
detachment, Pt dissolution, Ostwald Ripening, NC migration, aggregation/sintering and H2O2
poisoning can all be excluded as major causes of the decrease of electrochemical activity during
ORR cycling. Rather, XPS and HAADF-STEM analysis indicate that the decrease in activity is
primarily related to the formation of carbon/oxygen groups (i.e., CO) that are generated by the
reaction of reactive oxygen species, produced as intermediates, with the carbon support surface,
that adsorb and poison the surface of the Pt NCs. The extent of this process depends on the Pt NC
surface coverage, being most noticeable for low Pt NC coverages on the carbon support surface.
The deposition impact energy, i.e., adhesion of the Pt NCs to the carbon substrate, does not
influence the ORR activity, but affects drastically the Pt NC stability on the carbon substrate. For
the higher deposition impact energy employed in this work (1.6 eV/atom), the cluster geometrical
arrangements are essentially identical before and after the electrochemical measurements.
However, for the lower deposition impact energy (0.54 eV/atom), Pt NCs migrate during the ORR
measurements and form characteristic arrangements on the surface, without aggregating, in groups
of up to more than 15 NCs. With the support of FEM simulations, we postulate that such directional
NC migration is caused by an uneven distribution of electrochemical flux around individual NPs
caused by the initial random NC distribution across the surface, which generates non-uniform
METHODS
Cluster Synthesis Setup. Mass-selected Pt clusters were produced in a magnetron-sputtering,
gas-aggregation cluster beam source with a lateral time-of-flight filter, as described in Supporting
Information, Section S1 and elsewhere.66,67 The substrate voltage was set to either 500 V (0.54
eV/atom) or 1500 V (1.6 eV/atom) during deposition.
HAADF-STEM. STEM images were recorded using a 200 kV JEOL JEM-2100F scanning
transmission electron microscope with an incorporated spherical aberration corrector (CEOS
GmbH) and using a high-angle annular dark field (HAADF) detector, operated with inner and
outer collection angles of 62 and 164 mrad, respectively.
SECCM Setup and electrochemical measurements. The SECCM setup was presented in
Figure 1 and the related discussion, and has been described in detail.71 A dual-barrel borosilicate
capillary (o.d. 1.5 mm, i.d. 1.2 mm, TGC 150-10, Harvard Apparatus) was pulled to generate a
pipette with a tapered end of ~ 1 µm, using a CO2-laser puller (P-2000, Sutter Instruments). Two
palladium wires (saturated with H2 by applying -3.0 V for 30 min in 0.1 M HClO4) were placed
into each barrel and used as QRCEs in all the electrochemical measurements. The pipette was
mounted vertically on a z-piezoelectric positioner (P-753.1CD LISA, PhysikInstrumente), over the
substrate (Pt-loaded TEM grid) and the coarse and fine approaches of pipette towards the substrate
were conducted with control of a picomotor (Newport, 8303 Picomotor Actuator) and the z
-piezoelectric positioner, respectively. A data acquisition rate of ca. 390 points/s (each point the
average of 256 readings) was achieved by use of an FPGA card (PCIe-7852R) with a LabVIEW
2013 (National Instruments) interface. With reference to Figure 1, the meniscus was landed on the
current at the substrate (arising from double layer charging). The electrolyte was air-saturated 0.1
M HClO4 aqueous solution. Pd-H2 wires were used as QRCEs in all the electrochemical
measurements. The H2O2 measurements were performed with identical conditions, except that the
solutions (0.1 M HClO4) included contained 1 or 5 mM H2O2.
XPS Characterization. For XPS characterization, the TEM grids with Pt NCs were immersed
in a 0.1 M solution of HClO4 and 200 CV scans were performed from 1.1 V to 0.05 V vs Pd-H2
reference electrode, with a scan rate of 200 mV s-1, using a commercial bipotentiostat (730A, CH
Instruments,inc., Austin, USA). The grids were then mounted on to a metallic sample bar using
electrically-conductive carbon tape and loaded in to a Kratos Axis Ultra DLD spectrometer. XPS
measurements were performed in a pressure below 1 x 10⁻⁹ mbar with the sample illuminated using
an Al k monochromated x-ray source. The binding energy scale and the transmission function of
the spectrometer were calibrated using clean Ag foil prior to the experiments commencing. Survey
spectra were acquired using a pass energy of 160 eV while high resolution core level spectra were
acquired at a pass energy of 20 eV (resolution approx. 0.4 eV). All measurements were performed
using an analysis area 110 m in diameter. Data were analysed using CasaXPS, employing Voigt
lineshapes for all peaks except the metallic Pt contributions to the Pt 4f region where an
asymmetric Lorentzian lineshape, LA(1.5,90,30), was used
Finite Element Simulations. FEM simulations were performed in COMSOL Multiphysics 5.2a
with the transport of diluted species module. For full details, please see Supporting Information,
Supporting Information Available: Cluster deposition setup and procedure. Cluster
characterization before electrochemical measurements: Effect of the substrate voltage on the
cluster shape and size distribution. ORR measurements with added H2O2. XPS Analysis.
HAADF-STEM analysis for the LD-HIE sample. Analysis of the singlets, doublets and larger
particles for the LD-HIE, LD-LIE and HD-HIE samples. HAADF-STEM analysis for the LD-LIE
sample. FEM Simulations: effect of Clustering on Electrochemical Response. This material is
available free of charge via the Internet at http://pubs.acs.org.
Corresponding Authors
* Jon Ustarroz, jon.ustarroz@vub.be
* Patrick R. Unwin, P.R.Unwin@warwick.ac.uk
Author Contributions
The manuscript was written through contributions of all authors. All authors have given approval
to the final version of the manuscript.
Funding Sources
J.U. was supported by the Fonds Wetenschappelijk Onderzoek (FWO) in Flanders (postdoctoral
grant 12I7816N). I.M.O. was supported by EPSRC, Birmingham Science City. P.R.U. thanks the
Royal Society for a Wolfson Research Merit Award. D.P. was supported by the Leverhulme Trust
and G.Z. and M.K. by University of Warwick Chancellor’s International Scholarships.
ACKNOWLEDGMENT
J.U. acknowledges funding from the Fonds Wetenschappelijk Onderzoek (FWO) in Flanders
(postdoctoral grant 12I7816N). P.R.U. thanks the Royal Society for a Wolfson Research Merit
Award. The STEM instrument used in this research was obtained through the Birmingham Science
City project “Creating and Characterising Next Generation Advanced Materials”, supported by
Advantage West Midlands (AWM) and partly funded by the European Regional Development
Fund (ERDF). D.P. was supported by the Leverhulme Trust and G.Z. and M.K. by University of
REFERENCES
(1) Nesselberger, M.; Ashton, S.; Meier, J. C.; Katsounaros, I.; Mayrhofer, K. J. J.; Arenz, M.
The Particle Size Effect on the Oxygen Reduction Reaction Activity of Pt Catalysts:
Influence of Electrolyte and Relation to Single Crystal Models. J. Am. Chem. Soc. 2011,
133 (43), 17428–17433.
(2) Gómez-Marín, A. M.; Rizo, R.; Feliu, J. M. Oxygen Reduction Reaction at Pt Single
Crystals: A Critical Overview. Catal. Sci. Technol.2014, 4 (6), 1685.
(3) Katsounaros, I.; Cherevko, S.; Zeradjanin, A. R.; Mayrhofer, K. J. J. Oxygen
Electrochemistry as a Cornerstone for Sustainable Energy Conversion. Angew. Chemie -
Int. Ed.2014, 53 (1), 102–121.
(4) Crooks, R. M. Concluding Remarks: Single Entity Electrochemistry One Step at a Time.
Faraday Discuss.2016, 193, 533–547.
(5) Gómez-Marín, A. M.; Rizo, R.; Feliu, J. M. Some Reflections on the Understanding of the
Oxygen Reduction Reaction at Pt(111). Beilstein J. Nanotechnol.2013, 4 (1), 956–967.
(6) Kuzume, A.; Herrero, E.; Feliu, J. M. Oxygen Reduction on Stepped Platinum Surfaces in
Acidic Media. J. Electroanal. Chem.2007, 599 (2), 333–343.
(7) Nesselberger, M.; Roefzaad, M.; Fayçal Hamou, R.; Ulrich Biedermann, P.; Schweinberger,
F. F.; Kunz, S.; Schloegl, K.; Wiberg, G. K. H.; Ashton, S.; Heiz, U.; et al. The Effect of
Particle Proximity on the Oxygen Reduction Rate of Size-Selected Platinum Clusters. Nat.
Mater.2013, 12 (10), 919–924.
Kim, H.; Choi, M. Tuning Selectivity of Electrochemical Reactions by Atomically
Dispersed Platinum Catalyst. Nat. Commun.2016, 7 (Iek 11), 10922.
(9) Fabbri, E.; Taylor, S.; Rabis, A.; Levecque, P.; Conrad, O.; Kötz, R.; Schmidt, T. J. The
Effect of Platinum Nanoparticle Distribution on Oxygen Electroreduction Activity and
Selectivity. ChemCatChem2014, 6 (5), 1410–1418.
(10) Von Weber, A.; Baxter, E. T.; White, H. S.; Anderson, S. L. Cluster Size Controls
Branching between Water and Hydrogen Peroxide Production in Electrochemical Oxygen
Reduction at Pt N /ITO. J. Phys. Chem. C2015, 119 (20), 11160–11170.
(11) Taylor, S.; Fabbri, E.; Levecque, P.; Schmidt, T. J.; Conrad, O. The Effect of Platinum
Loading and Surface Morphology on Oxygen Reduction Activity. Electrocatalysis2016, 7
(4), 287–296.
(12) Mistry, H.; Behafarid, F.; Reske, R.; Varela, A. S.; Strasser, P.; Roldan Cuenya, B. Tuning
Catalytic Selectivity at the Mesoscale via Interparticle Interactions. ACS Catal.2016, 6 (2),
1075–1080.
(13) Mistry, H.; Varela, A. S.; Kühl, S.; Strasser, P.; Cuenya, B. R. Nanostructured
Electrocatalysts with Tunable Activity and Selectivity. Nat. Rev. Mater.2016, 1 (4), 16009.
(14) Antolini, E. Structural Parameters of Supported Fuel Cell Catalysts: The Effect of Particle
Size, Inter-Particle Distance and Metal Loading on Catalytic Activity and Fuel Cell
Performance. Appl. Catal. B Environ.2016, 181, 298–313.
(15) Paulus, U. A.; Schmidt, T. J.; Gasteiger, H. A.; Behm, R. J. Oxygen Reduction on a
J. Electroanal. Chem.2001, 495 (2), 134–145.
(16) Gasteiger, H. A.; Kocha, S. S.; Sompalli, B.; Wagner, F. T. Activity Benchmarks and
Requirements for Pt, Pt-Alloy, and Non-Pt Oxygen Reduction Catalysts for PEMFCs. Appl.
Catal. B Environ.2005, 56 (1–2), 9–35.
(17) Pedersen, C. M.; Escudero-Escribano, M.; Velázquez-Palenzuela, A.; Christensen, L. H.;
Chorkendorff, I.; Stephens, I. E. L. Benchmarking Pt-Based Electrocatalysts for Low
Temperature Fuel Cell Reactions with the Rotating Disk Electrode: Oxygen Reduction and
Hydrogen Oxidation in the Presence of CO (Review Article). Electrochim. Acta2015, 179,
647–657.
(18) Speder, J.; Spanos, I.; Zana, A.; Kirkensgaard, J. J. K.; Mortensen, K.; Altmann, L.; Bäumer,
M.; Arenz, M. From Single Crystal Model Catalysts to Systematic Studies of Supported
Nanoparticles. Surf. Sci.2015, 631, 278–284.
(19) Mayrhofer, K. J. J.; Strmcnik, D.; Blizanac, B. B.; Stamenkovic, V. R.; Arenz, M.;
Markovic, N. M. Measurement of Oxygen Reduction Activities via the Rotating Disc
Electrode Method: From Pt Model Surfaces to Carbon-Supported High Surface Area
Catalysts. Electrochim. Acta2008, 53 (7), 3181–3188.
(20) Yu, Y.; Sun, Q.; Liu, X.; Wu, H.; Zhou, T.; Shi, G. Size-Controllable Gold-Platinum Alloy
Nanoparticles on Nine Functionalized Ionic-Liquid Surfaces and Their Application as
Electrocatalysts for Hydrogen Peroxide Reduction. Chem. Eur. J. 2011, 17 (40), 11314–
11323.
Baldizzone, C.; Mezzavilla, S.; Schüth, F.; Mayrhofer, K. J. J. Design Criteria for Stable
Pt/C Fuel Cell Catalysts. Beilstein J. Nanotechnol.2014, 5, 44–67.
(22) Lee, H.; Habas, S. E.; Kweskin, S.; Butcher, D.; Somorjai, G. A.; Yang, P. Morphological
Control of Catalytically Active Platinum Nanocrystals. Angew. Chemie - Int. Ed.2006, 45
(46), 7824–7828.
(23) Seidel, Y. E.; Schneider, A.; Jusys, Z.; Wickman, B.; Kasemo, B.; Behm, R. J. Mesoscopic
Mass Transport Effects in Electrocatalytic Processes. Faraday Discuss. 2008, 140, 167–
184.
(24) Chen, S.; Kucernak, A. Electrocatalysis under Conditions of High Mass Transport Rate:
Oxygen Reduction on Single Submicrometer-Sized Pt Particles Supported on Carbon. J.
Phys. Chem. B2004, 108 (10), 3262–3276.
(25) Proch, S.; Wirth, M.; White, H. S.; Anderson, S. L. Strong Effects of Cluster Size and Air
Exposure on Oxygen Reduction and Carbon Oxidation Electrocatalysis by Size-Selected
Ptn (N < 11) on Glassy Carbon Electrodes. J. Am. Chem. Soc.2013, 135 (8), 3073–3086.
(26) Dumitrescu, I.; Crooks, R. M. Effect of Mass Transfer on the Oxygen Reduction Reaction
Catalyzed by Platinum Dendrimer Encapsulated Nanoparticles. Proc. Natl. Acad. Sci.2012,
109 (29), 11493–11497.
(27) Schneider, A.; Colmenares, L.; Seidel, Y. E.; Jusys, Z.; Wickman, B.; Kasemo, B.; Behm,
R. J. Transport Effects in the Oxygen Reduction Reaction on Nanostructured, Planar Glassy
Carbon Supported Pt/GC Model Electrodes. Phys. Chem. Chem. Phys.2008, 10 (14), 1931.
Nanoparticles. J. Electroanal. Chem.2013, 688, 180–188.
(29) Hodnik, N.; Dehm, G.; Mayrhofer, K. J. J. Importance and Challenges of Electrochemical
in Situ Liquid Cell Electron Microscopy for Energy Conversion Research. Acc. Chem. Res.
2016, 49 (9), 2015–2022.
(30) Holtz, M. E.; Yu, Y.; Gunceler, D.; Gao, J.; Sundararaman, R.; Schwarz, K. A.; Arias, T.
A.; Abruña, H. D.; Muller, D. A. Nanoscale Imaging of Lithium Ion Distribution during in
Situ Operation of Battery Electrode and Electrolyte. Nano Lett.2014, 14, 1453–1459.
(31) Smith, M. C.; Gilbert, J. A.; Mawdsley, J. R.; Seifert, S.; Myers, D. J. In Situ Small-Angle
X-Ray Scattering Observation of Pt Catalyst Particle Growth during Potential Cycling. J.
Am. Chem. Soc.2008, 130 (26), 8112–8113.
(32) Lopez-Haro, M.; Dubau, L.; Guétaz, L.; Bayle-Guillemaud, P.; Chatenet, M.; André, J.;
Caqué, N.; Rossinot, E.; Maillard, F. Atomic-Scale Structure and Composition of Pt3Co/C
Nanocrystallites during Real PEMFC Operation: A STEM-EELS Study. Appl. Catal. B
Environ.2014, 152–153 (1), 300–308.
(33) Yu, Y.; Xin, H. L.; Hovden, R.; Wang, D.; Rus, E. D.; Mundy, J. A.; Muller, D. A.; Abruña,
H. D. Three-Dimensional Tracking and Visualization of Hundreds of Pt-Co Fuel Cell
Nanocatalysts during Electrochemical Aging. Nano Lett.2012, 12 (9), 4417–4423.
(34) Goris, B.; Bals, S.; Van den Broek, W.; Carbó-Argibay, E.; Gómez-Graña, S.; Liz-Marzán,
L. M.; Van Tendeloo, G. Atomic-Scale Determination of Surface Facets in Gold Nanorods.
Nat. Mater.2012, 11 (11), 930–935.
Characterization of Noble-Metal Nanoparticles and Their Assemblies by Electron
Tomography. Angew. Chemie - Int. Ed.2014, 53 (40), 10600–10610.
(36) Dubau, L.; Castanheira, L.; Berthomé, G.; Maillard, F. An Identical-Location Transmission
Electron Microscopy Study on the Degradation of Pt/C Nanoparticles under Oxidizing,
Reducing and Neutral Atmosphere. Electrochim. Acta2013, 110, 273–281.
(37) Dubau, L.; Castanheira, L.; Maillard, F.; Chatenet, M.; Lottin, O.; Maranzana, G.; Dillet,
J.; Lamibrac, A.; Perrin, J. C.; Moukheiber, E.; et al. A Review of PEM Fuel Cell Durability:
Materials Degradation, Local Heterogeneities of Aging and Possible Mitigation Strategies.
Wiley Interdiscip. Rev. Energy Environ.2014, 3 (6), 540–560.
(38) Zadick, A.; Dubau, L.; Sergent, N.; Berthomé, G.; Chatenet, M. Huge Instability of Pt/C
Catalysts in Alkaline Medium. ACS Catal.2015, 5 (8), 4819–4824.
(39) Arenz, M.; Zana, A. Fuel Cell Catalyst Degradation: Identical Location Electron
Microscopy and Related Methods. Nano Energy2015, 1–15.
(40) Perez-Alonso, F. J.; Elkjær, C. F.; Shim, S. S.; Abrams, B. L.; Stephens, I. E. L.;
Chorkendorff, I. B. Identical Locations Transmission Electron Microscopy Study of Pt/C
Electrocatalyst Degradation during Oxygen Reduction Reaction. J. Power Sources 2011,
196 (15), 6085–6091.
(41) Arán-Ais, R. M.; Yu, Y.; Hovden, R.; Solla-Gullón, J.; Herrero, E.; Feliu, J. M.; Abruña,
H. D. Identical Location Transmission Electron Microscopy Imaging of Site-Selective Pt
Nanocatalysts: Electrochemical Activation and Surface Disordering. J. Am. Chem. Soc.
(42) Shao-Horn, Y.; Sheng, W. C.; Chen, S.; Ferreira, P. J.; Holby, E. F.; Morgan, D. Instability
of Supported Platinum Nanoparticles in Low-Temperature Fuel Cells. Top. Catal.2007, 46
(3–4), 285–305.
(43) Hartl, K.; Hanzlik, M.; Arenz, M. IL-TEM Investigations on the Degradation Mechanism
of Pt/C Electrocatalysts with Different Carbon Supports. Energy Environ. Sci. 2011, 4 (1),
234–238.
(44) Meier, J. C.; Katsounaros, I.; Galeano, C.; Bongard, H. J.; Topalov, A. A.; Kostka, A.;
Karschin, A.; Schüth, F.; Mayrhofer, K. J. J. Stability Investigations of Electrocatalysts on
the Nanoscale. Energy Environ. Sci.2012, 5 (11), 9319.
(45) Schlögl, K.; Hanzlik, M.; Arenz, M. Comparative IL-TEM Study Concerning the
Degradation of Carbon Supported Pt-Based Electrocatalysts. J. Electrochem. Soc. 2012,
159 (6), B677.
(46) Schlögl, K.; Mayrhofer, K. J. J.; Hanzlik, M.; Arenz, M. Identical-Location TEM
Investigations of Pt/C Electrocatalyst Degradation at Elevated Temperatures. J.
Electroanal. Chem.2011, 662 (2), 355–360.
(47) Wang, F.; Li, C.; Sun, L.-D.; Xu, C.-H.; Wang, J.; Yu, J. C.; Yan, C.-H. Porous
Single-Crystalline Palladium Nanoparticles with High Catalytic Activities. Angew. Chemie - Int.
Ed.2012, 51 (20), 4872–4876.
(48) Castanheira, L.; Dubau, L.; Maillard, F. Accelerated Stress Tests of Pt/HSAC
Electrocatalysts: An Identical-Location Transmission Electron Microscopy Study on the
(49) Nikkuni, F. R.; Vion-Dury, B.; Dubau, L.; Maillard, F.; Ticianelli, E. a.; Chatenet, M. The
Role of Water in the Degradation of Pt3Co/C Nanoparticles: An Identical Location
Transmission Electron Microscopy Study in Polymer Electrolyte Environment. Appl. Catal.
B Environ.2014, 156–157, 301–306.
(50) Hartl, K.; Nesselberger, M.; Mayrhofer, K. J. J.; Kunz, S.; Schweinberger, F. F.; Kwon, G.;
Hanzlik, M.; Heiz, U.; Arenz, M. Electrochemically Induced Nanocluster Migration.
Electrochim. Acta2010, 56 (2), 810–816.
(51) Ustarroz, J.; Gupta, U.; Hubin, A.; Bals, S.; Terryn, H. Electrodeposition of Ag
Nanoparticles onto Carbon Coated TEM Grids: A Direct Approach to Study Early Stages
of Nucleation. Electrochem. Commun.2010, 12 (12), 1706–1709.
(52) Ustarroz, J.; Ke, X.; Hubin, A.; Bals, S.; Terryn, H. New Insights into the Early Stages of
Nanoparticle Electrodeposition. J. Phys. Chem. C2012, 116 (3), 2322–2329.
(53) Ustarroz, J.; Altantzis, T.; Hammons, J. a.; Hubin, A.; Bals, S.; Terryn, H. The Role of
Nanocluster Aggregation, Coalescence, and Recrystallization in the Electrochemical
Deposition of Platinum Nanostructures. Chem. Mater.2014, 26 (7), 2396–2406.
(54) Ustarroz, J.; Hammons, J. A.; Altantzis, T.; Hubin, A.; Bals, S.; Terryn, H. A Generalized
Electrochemical Aggregative Growth Mechanism. J. Am. Chem. Soc. 2013, 135, 11550–
11561.
(55) Percival, S. J.; Zhang, B. Electrocatalytic Reduction of Oxygen at Single Platinum
Nanowires. J. Phys. Chem. C2013, 117 (27), 13928–13935.
Single-Cell Analysis and High-Resolution Electrochemical Imaging. TrAC - Trends Anal. Chem.
2016, 79, 46–59.
(57) Byers, J. C.; Güell, A. G.; Unwin, P. R. Nanoscale Electrocatalysis: Visualizing Oxygen
Reduction at Pristine, Kinked, and Oxidized Sites on Individual Carbon Nanotubes. J. Am.
Chem. Soc.2014, 136 (32), 11252–11255.
(58) Kim, J.; Renault, C.; Nioradze, N.; Arroyo-Currás, N.; Leonard, K. C.; Bard, A. J.
Electrocatalytic Activity of Individual Pt Nanoparticles Studied by Nanoscale Scanning
Electrochemical Microscopy. J. Am. Chem. Soc.2016, 138 (27), 8560–8568.
(59) Kang, M.; Perry, D.; Bentley, C. L.; West, G.; Page, A.; Unwin, P. R. Simultaneous
Topography and Reaction Flux Mapping at and around Electrocatalytic Nanoparticles. ACS
Nano2017, 11 (9), 9525–9535.
(60) Xiao, X.; Bard, A. J. Observing Single Nanoparticle Collisions at an Ultramicroelectrode
by Electrocatalytic Amplification. J. Am. Chem. Soc.2007, 129 (31), 9610–9612.
(61) Kleijn, S. E. F.; Lai, S. C. S.; Miller, T. S.; Yanson, A. I.; Koper, M. T. M.; Unwin, P. R.
Landing and Catalytic Characterization of Individual Nanoparticles on Electrode Surfaces.
J. Am. Chem. Soc.2012, 134, 18558–18561.
(62) McKelvey, K.; German, S. R.; Zhang, Y.; White, H. S.; Edwards, M. A. Nanopipettes as a
Tool for Single Nanoparticle Electrochemistry. Curr. Opin. Electrochem.2017, 6 (1), 4–9.
(63) Kucernak, A. R.; Toyoda, E. Studying the Oxygen Reduction and Hydrogen Oxidation
Reactions under Realistic Fuel Cell Conditions. Electrochem. Commun. 2008, 10 (11),