R E S E A R C H
Open Access
GENT2: an updated gene expression
database for normal and tumor tissues
Seung-Jin Park
1,2, Byoung-Ha Yoon
1,2, Seon-Kyu Kim
3*and Seon-Young Kim
1,2*FromThe 8th Annual Translational Bioinformatics Conference Seoul, South Korea. 31 October - 2 November 2018
Abstract
Background:Gene Expression database of Normal and Tumor tissues 2 (GENT2) is an updated version of GENT, which has provided a user-friendly search platform for gene expression patterns across different normal and tumor tissues compiled from public gene expression data sets.
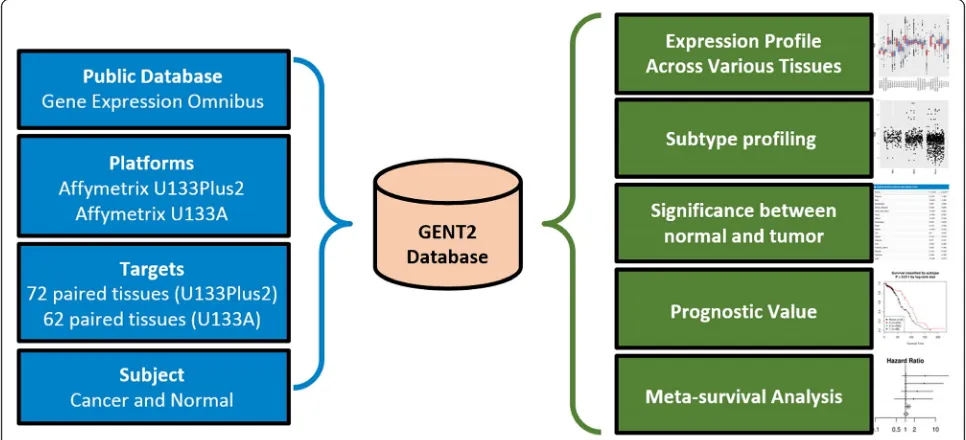
Results:We refactored GENT2 with recent technologies such as Apache Lucene indexing for fast search and Google Web Toolkit (GWT) framework for a user-friendly web interface. Now, GENT2 contains more than 68,000 samples and has several new useful functions. First, GENT2 now provides gene expression across 72 different tissues compared to 57 in GENT. Second, with increasing importance of tumor subtypes, GENT2 provides an option to study the differential expression and its prognostic significance based on tumor subtypes. Third, whenever available, GENT2 provides prognostic information of a gene of interest. Fourth, GENT2 provides a meta-analysis of survival information to provide users more reliable prognostic value of a gene of interest.
Conclusions: In conclusion, with these significant improvements, GENT2 will continue to be a useful tool to a wide range of researchers. GENT2 is freely available at http://gent2.appex.kr.
Keywords: Tissue and cell line wide gene expression profiling, Cancer subtype profiling, Survival analysis, Meta-survival analysis, Large scale microarray web-database
Background
The explosion of publicly available omics datasets in-cluding gene expression microarray and next-generation sequencing has provided valuable resources for re-searchers. However, for most researchers with few bioinformatics skills, public datasets in a raw data format are of little value. To help researchers to utilize public gene expression datasets, we previously developed a web-based gene expression database named Gene Expression database of Normal and Tumor tissues (GENT) [1]. GENT provides gene expression profiles across diverse human cancer and normal tissues with
more than 34,000 samples generated by the Affymetrix U133A or U133Plus2 microarray platform with consist-ent data processing. To our satisfaction, since its launch at 2011, GENT has been widely used by researchers across the world, with over 1600 visitors per month on average, and the method has been cited more than 100 times in research work [2–6].
In our opinion, a few strengths have contributed to the success of GENT. First, it is very simple to use. A user inputs a gene symbol of interest and gets back results within a few seconds. Second, the large amounts of samples (~ 34,000) generated using the same platform with consistent data processing makes the database reli-able by removing or reducing many biases (i.e., different batches, laboratories, ethnicities, etc.) caused by a small sample size. Third, GENT provides intuitive graphics as well as raw gene expression values to users, so users can utilize the information in convenient ways.
© The Author(s). 2019Open AccessThis article is distributed under the terms of the Creative Commons Attribution 4.0 International License (http://creativecommons.org/licenses/by/4.0/), which permits unrestricted use, distribution, and reproduction in any medium, provided you give appropriate credit to the original author(s) and the source, provide a link to the Creative Commons license, and indicate if changes were made. The Creative Commons Public Domain Dedication waiver (http://creativecommons.org/publicdomain/zero/1.0/) applies to the data made available in this article, unless otherwise stated.
* Correspondence:[email protected];[email protected]
3
Personalized Genomic Medicine Research Center, KRIBB, Daejeon 34141, Korea
1Genome Editing Research Center, Korea Research Institute of Bioscience and
Biotechnology (KRIBB), Daejeon 34141, Korea
Enormous amounts of publicly available gene expres-sion datasets have accumulated since GENT was first published in 2011, and the need was recognized to upgrade the GENT system both quantitatively and quali-tatively. Here, GENT2 is provided as an updated version of GENT with more samples and newer functionalities. Major improvements of GENT2 over GENT are the following. First, GENT2 contains more than 68,000 samples compared to 34,000 samples in GENT. Second, GENT2 provides gene expression information on 72 paired tissues compared to 57 tissues of GENT. Third, GENT2 provides results of statistical tests (t-test, log2 fold changes, etc.) as well as boxplot summaries for user convenience. Fourth, considering the importance of tumor subtypes, GENT2 provides results of various cancer subtype profiling analysis (e.g., stage or grade with various molecular subtypes), Fifth, it provides re-sults of prognostic value estimation using Kaplan-Meier plots. Finally, GENT2 provides results of meta-survival analysis combining various independent studies for reliable prognostic information. With these significant improvements, GENT2 is suggested as a versatile tool to assess the biological and prognostic relevance of a specific gene in various cancers.
Construction and content
To construct the GENT2 system, gene expression data is downloaded from the NCBI GEO database generated by two microarray platforms (Affymetrix U133A or U133Plus2). Then, the data were stratified into cancer
and normal samples across 72 tissues. The GENT2 database provides the following five functions: 1) a land-scape of gene expression profile across 72 normal and tumor tissues, 2) cancer subtype profiling, 3) statistical significance of gene expression difference between normal and tumor samples, 4) a prognostic value of gene expression, and 5) meta-survival analysis (Fig. 1). The following sections present the workflows of how the database was constructed.
Collection and processing of publicly available gene expression datasets
We collected data from the NCBI GEO public database and processed them with the MAS5 algorithm using the affy package in Bioconductor [7]. We used the same MAS5 algorithm used in the original GENT, as it is a single-array algorithm, which allows the comparison of multiple independent datasets [1].
GENT2 implementation
The GENT2 system consists of the following two main parts: indexed DB and web-based user interface. To con-struct a database that can handle a huge gene expression profile (over 68,000 cancer patients) efficiently, we applied the Apache Lucene index machine (ver. 7.4.0) into whole gene expression datasets. A web-based graphical user interface (GUI) was implemented with the Google Web Toolkit (GWT, ver. 2.7.0) and GWT extended (GXT, ver. 4.0.0) frameworks based on JAVA language. Data exchange between a web browser and the GENT2 server is controlled by a GWT remote
procedure call. All statistical tests provided from the GENT2, such as two-sample t-test, Kaplan-Meier with log-rank test, and meta-survival analysis with Cox proportional hazard modes, were implemented using R (ver. 3.2.5) with Bioconductor plugins (ver. 3.6). The system architecture of GENT2 is illustrated in Additional file 3: Figure S1.
Database description
GENT2 contains more than 44,000 (U133Plus2; 887 data-sets) and 23,000 (U133A; 358 datadata-sets) samples (Table 1, Additional file1: Table S1, Additional file2: Table S2). A lar-ger number of samples were added to the original GENT,
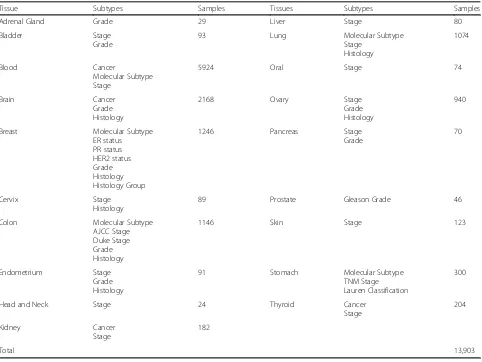
and over 380 datasets were added for the U133Plus2 platform. The top three tissues of each platform are as follows: blood, brain and breast for U133Plus2 and blood, bone marrow and brain for U133A. Addition-ally, subtype analysis and meta-analysis data in GENT2 are displayed in Tables 2 and 3, respectively.
Utility
Tissue- and cell line-wide expression profile comparing normal and tumor samples
When a user puts a gene symbol in the ‘Search Gene profile’ page, GENT2 performs tissue-wide expression profiling and statistical testing quickly (less than 5 s) on
Table 2Subtypes of each cancer type
Tissue Subtypes Samples Tissues Subtypes Samples
Adrenal Gland Grade 29 Liver Stage 80
Bladder Stage
Grade
93 Lung Molecular Subtype
Stage Histology
1074
Blood Cancer
Molecular Subtype Stage
5924 Oral Stage 74
Brain Cancer
Grade Histology
2168 Ovary Stage
Grade Histology
940
Breast Molecular Subtype
ER status PR status HER2 status Grade Histology Histology Group
1246 Pancreas Stage
Grade
70
Cervix Stage
Histology
89 Prostate Gleason Grade 46
Colon Molecular Subtype
AJCC Stage Duke Stage Grade Histology
1146 Skin Stage 123
Endometrium Stage
Grade Histology
91 Stomach Molecular Subtype
TNM Stage Lauren Classification
300
Head and Neck Stage 24 Thyroid Cancer
Stage
204
Kidney Cancer
Stage
182
Total 13,903
Table 1GENT2 database description
GENT GENT2
U133Plus2 (GPL570) U133A (GPL96) Total U133Plus2 (GPL570) U133A (GPL96) Total
Datasets 306 241 547 887 358 1245
Samples 24,300 16,400 40,700 44,857 23,283 68,140
Probes 54,613 22,215 54,613 22,215
two Affymetrix platforms, simultaneously. ‘Search Gene profile’ provides two boxplots of gene expression from the Affymetrix U133Plus2 and the Affymetrix U133A platform, allowing users to compare both results. In Fig. 2a, for example, we illustrate the tissue-wide gene expression profile of an oncogene,ERBB2. Compared to normal, ERBB2 was overexpressed in a few tumors in-cluding from bone, breast, and ovary. The t-test (Fig.2b) shows that there were significant expression differences between tumor and normal tissues in bone, breast and ovary tissues (3.9-fold and P< 0.001, 1.9-fold and P< 0.001, 1.9-fold and P< 0.001, respectively). ERBB2 is a representative oncogene activated in breast cancer [8]. It was also reported that ERBB2 overexpression helps metastatic progression of prostate cancer to
bone [9]. Moreover, ovarian cancer was also linked to ERBB2 activation, and many efforts are on-going to develop molecular cancer therapeutics by targeting
the ERBB2 pathway.
Subtype profiling with survival analysis
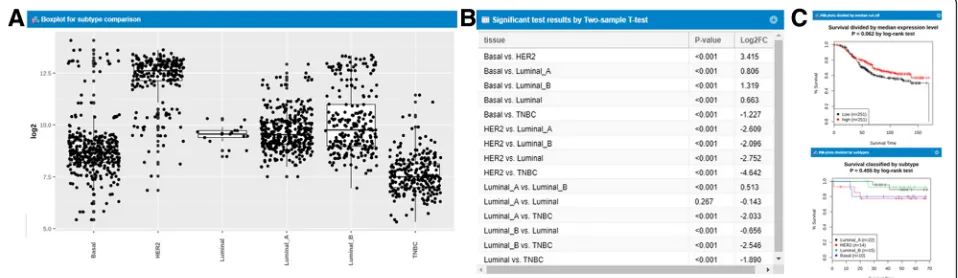
In GENT2, we added the following two novel functions: subtype profiling and survival analysis. If a user selects a tissue and a specific subtype, GENT2 provides the ex-pression profiling of subtypes of the selected tissue. In addition, it provides results of a statistical test (ANOVA or t-test) and survival analysis on the subtype. For in-stance, the expression pattern for the molecular subtype of the ERBB2 gene in breast cancer tissue is shown in Fig. 3a. As expected, the HER2 group has the highest value on average, and the TNBC group has the lowest value. Statistical tests are also performed for each subtype (Fig. 3b). In particular, the ERBB2 gene has a highly distinct expression pattern with relatively all significant differences in each group. Finally, survival analysis is performed for each subtype (Fig. 3c). Although the ERBB2 gene showed distinct expression patterns, the log-rank test p-value for each group was found to be insignificant, suggesting that expression dif-ference is irrelevant of prognostic difdif-ference. Currently, a subtype analysis function provides information on 46 subtypes of 19 tissue types with over 13,000 samples.
Meta-survival analysis
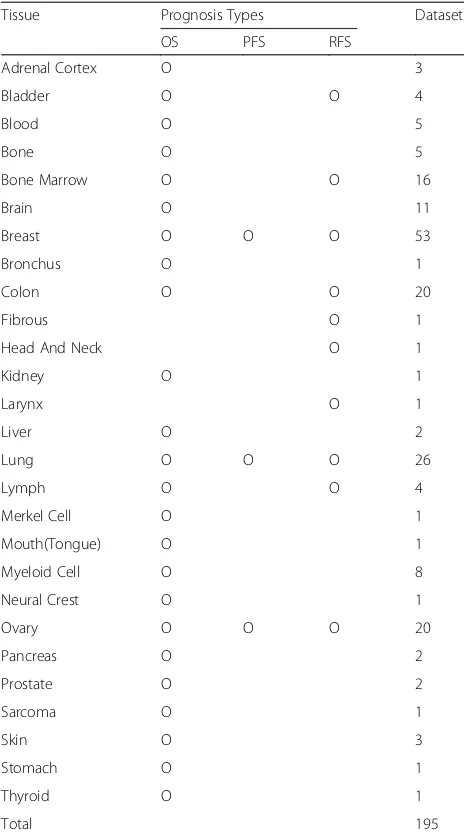
Confirming the prognostic relevance of a gene is important for its application in the clinical field. Many studies have reported incongruent prognostic characteristics of a gene, thus there is a great need to further evaluate the prognostic potential of a gene by combining multiple information across many studies. Hence, we adopted a meta-survival analysis into GENT2, providing reliable prognostic power estimated by synergetic effect across many independent reports. This allows integrated statistical analysis from differ-ent studies, which greatly increases the number of samples and improves statistical power. For example, progression-free survival in breast tissue for the ERBB2 gene was analyzed by meta-analysis (Fig. 4). The top six datasets indicate that the hazard ratios are over 1 for the same gene and the same tissue region (breast), while others show the hazard ratios under 1. This result suggests that the prognostic value of ERBB2 can be different according to different contexts. For example, the GSE9195 dataset is an ex-periment to identify the effect of tamoxifen in estro-gen receptor positive (ER+) breast cancer [10], while the GSE16446 dataset is also an experiment to un-cover the effect of anthracycline in estrogen receptor negative (ER-) breast cancer [11]. We suggest that Table 3Datasets used with meta survival analysis in GENT2
Tissue Prognosis Types Datasets
OS PFS RFS
Adrenal Cortex O 3
Bladder O O 4
Blood O 5
Bone O 5
Bone Marrow O O 16
Brain O 11
Breast O O O 53
Bronchus O 1
Colon O O 20
Fibrous O 1
Head And Neck O 1
Kidney O 1
Larynx O 1
Liver O 2
Lung O O O 26
Lymph O O 4
Merkel Cell O 1
Mouth(Tongue) O 1
Myeloid Cell O 8
Neural Crest O 1
Ovary O O O 20
Pancreas O 2
Prostate O 2
Sarcoma O 1
Skin O 3
Stomach O 1
Thyroid O 1
Total 195
comparing multiple datasets researchers can obtain more reliable prognostic information.
Performance improvements by technological updates
In the previously constructed GENT, all search and display activities were implemented using PHP and MySQL environments. PHP is one of the widely used computational languages on the server side and MySQL is an open-source relational database management sys-tem that stores the large amounts of data. Upon expo-nentially increased gene expression data that are publicly available, there has been a great need to upgrade system architecture of the GENT to efficiently handle those huge data sets. Thus, we applied recent informatics tech-nologies including GWT and Lucene into the GENT2.
By using GWT framework, user-friendly and flexible web interfaces were equipped in the GENT2, and real-time interactions between web-client and server systems through GWT RPC method were also available. Especially, applying Lucene index machine, a high-per-formance information retrieval library, into the GENT2, ultra-fast access across enormous expression data from more than 68,000 samples is available. Compared with MySQL system, Lucene indexing in the GENT2 showed a better performance accessing faster than approximately 10 times.
Discussion
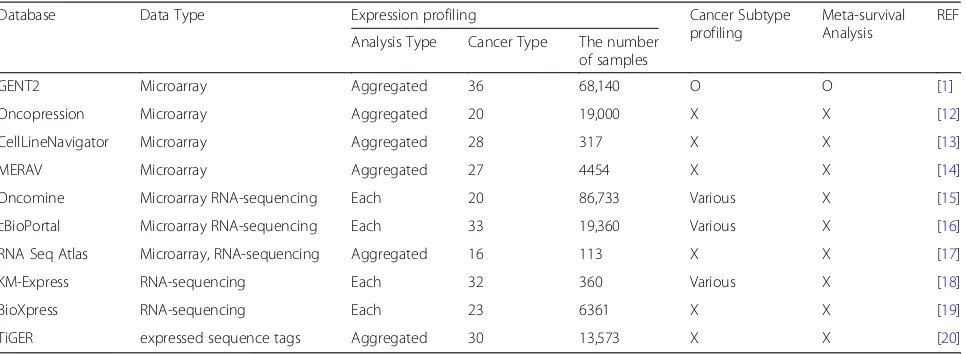
Many databases have been developed that show gene ex-pression of cancer samples. For instance, Oncoex-pression
Fig. 2Tissue-wide gene expression pattern of ERBB2 gene across 72 paired tissues and statistical tests.aA boxplot across 72 paired tissues in GPL570 only. Red indicates a boxplot of cancer samples. Blue indicates a boxplot of normal samples. We exclude the tissue-wide boxplot of GPL96.bStatistical test based on expression profile at each tissue. For each tissue,P-valueand log2 fold change are calculated, and NA at the‘P -value’column means that there is only one sample of normal tissue. Same above, the statistical test of GPL96 has been excluded
[12], CellLineNavigator [13], MERAV [14], Oncomine [15], cBioPortal [16], RNA Seq Atlas [17], KM-Express [18], BioXpress [19], TiGER [20], and so on (Table 4). Each database has its own unique advantages. First, Oncopression, CellLineNavigator, and MERAV are data-bases that can investigate gene profiling around the col-lected microarray datasets for various cancer types. Oncomine, cbioPortal, and RNA Seq Atlas are databases that analyze gene profiling for each dataset based on a microarray and RNA-sequencing. These databases have the benefit of comparing information between two high-throughput platforms. In addition, Oncomine and cBioPortal provide versatile and additional functions such as multidimensional comparison of samples (Onco-mine) or integrated analysis of CNV, mutation, coex-pression, and gene enrichment (cBioPortal). Lastly, the TiGER database contains EST data around several tissues. In many respects, they are very similar to GENT2 database. However, GENT2 has many useful features such as subtype analysis and meta-survival
analysis, which are not available in other databases. In addition, an intuitive and user friendly interface is another advantage of GENT2 (Fig. 5). For example, the tab display in the GENT2 main page is useful when a user performs multiple iterations of analysis. In the near future, we plan to update GENT2 to en-able multiple gene search and add RNA-sequencing data as well as microarrays.
Conclusions
The explosion of publicly available datasets in the cancer genomics field has provided cancer researchers invalu-able resources. However, for many researchers who do not have bioinformatics skills to fully utilize the datasets, the public datasets are of little value. The widespread use of GENT since its launch at 2011 reflects the needs for carefully curated large-scale gene expression data-bases with an easy-to-use interface. With GENT2, we continue to provide the core functions of GENT; however, with increasing public datasets, we updated
Fig. 4Meta-analysis.aForest plot of hazard ratio on the ERBB2 gene with progression-free survival. Displays study name as well as GSE, GPL, and probe information. TE is the estimated treatment effect, seTE is the standard error of the treatment estimate, and HR indicates the hazard ratio average. Fixed and random effects are shown.bSummary and statistics test ofa
Table 4Comparison of GENT2 and other databases
Database Data Type Expression profiling Cancer Subtype
profiling
Meta-survival Analysis
REF
Analysis Type Cancer Type The number of samples
GENT2 Microarray Aggregated 36 68,140 O O [1]
Oncopression Microarray Aggregated 20 19,000 X X [12]
CellLineNavigator Microarray Aggregated 28 317 X X [13]
MERAV Microarray Aggregated 27 4454 X X [14]
Oncomine Microarray RNA-sequencing Each 20 86,733 Various X [15]
cBioPortal Microarray RNA-sequencing Each 33 19,360 Various X [16]
RNA Seq Atlas Microarray, RNA-sequencing Aggregated 16 113 X X [17]
KM-Express RNA-sequencing Each 32 360 Various X [18]
BioXpress RNA-sequencing Each 23 6361 X X [19]
TiGER expressed sequence tags Aggregated 30 13,573 X X [20]
and expanded the GENT database in terms of datasets and novel useful functions. The number of different tissues increased from 57 to 72, and new functions such as subtype profiling, various statistical tests, and meta-survival analysis were added. We also adopted recent technologies such as such the GWT web frame-work and a Lucene indexing machine to provide more user-friendly web experiences. With those improvements in both data volume and novel functions, GENT2 will continue to be a useful tool to help researchers in the field of cancer genomics. As RNA-seq has become the de facto standard method for exploring gene expression, we plan to add gene expression datasets produced by RNA-seq in the future version of GENT.
Additional files
Additional file 1:Table S1.U133Plus2 data description in GENT2. This is the data list for the U133Plus2 platform in the GENT2 database. For Blood, more than 10 K samples are stored. In particular, Blood, Breast, Colon, Kidney, Skin, and Bladder tissues contain all kinds of data. (PNG 16 kb) Additional file 2:Table S2.U133A data description in GENT2. This is the data list for the U133A platform in the GENT2 database. There are no cell-line data from U133A platform around all tissues. (PNG 16 kb) Additional file 3:Figure S1.GENT2 system architecture. The GENT2 infrastructure consists of web browser and server layers. A graphical user interface (GUI) was implemented using Google Web Toolkit (GWT) and GWT extended (GXT) frameworks. Transporting data between web browser and server is controlled by GWT remote procedure call (RPC) methods. All interactions in the server layer were implemented by R, RCaller, Apache Lucene software. (PNG 39 kb)
Acknowledgements
We thank Drs Sung-Min Park and Jong-Hwan Kim for their helpful comments on the GENT2 website and the manuscript.
Funding
Publication costs are funded by grants from the National Research Foundation of Korea (2017MBA9B5060884 and
NRF-2014M3C9A3068554), and grant from KRIBB Research Initiative Program.
Availability of data and materials
GENT2 is freely available online athttp://gent2.appex.kr.
About this supplement
This article has been published as part ofBMC Medical Genomics Volume 12 Supplement 5, 2019: Selected articles from the 8th Translational Bioinformatics Conference: Medical Genomics.The full contents of the supplement are available online athttps://bmcmedgenomics.biomedcentral.com/articles/ supplements/volume-12-supplement-5.
Authors’contributions
SYK and SKK designed the study; SJP collected and processed data; SJP, BHY, and SKK implemented the web site. SJP, SKK, and SYK wrote the manuscript, and all authors read and approved the manuscript.
Ethics approval and consent to participate
Not applicable.
Consent for publication
Not applicable.
Competing interests
The authors declare that they have no competing interests.
Publisher’s Note
Springer Nature remains neutral with regard to jurisdictional claims in published maps and institutional affiliations.
Author details
1Genome Editing Research Center, Korea Research Institute of Bioscience and
Biotechnology (KRIBB), Daejeon 34141, Korea.2Department of Bioscience,
University of Science and Technology (UST), Daejeon 34113, Korea.
3Personalized Genomic Medicine Research Center, KRIBB, Daejeon 34141,
Korea.
Published: 11 July 2019
References
1. Shin G, Kang TW, Yang S, Baek SJ, Jeong YS, Kim SY. GENT: gene expression database of normal and tumor tissues. Cancer Informat. 2011;10:149–57.
2. Wang Z, He Y, Deng W, Lang L, Yang H, Jin B, Kolhe R, Ding HF, Zhang J, Hai T, et al. Atf3 deficiency promotes genome instability and spontaneous tumorigenesis in mice. Oncogene. 2018;37(1):18–27.
3. Coebergh van den Braak RRJ, Sieuwerts AM, Kandimalla R, Lalmahomed ZS, Bril SI, van Galen A, Smid M, Biermann K, van Krieken J, Kloosterman WP, et al. High mRNA expression of splice variant SYK short correlates with hepatic disease progression in chemonaive lymph node negative colon cancer patients. PLoS One. 2017;12(9):e0185607.
4. Tsai YL, Ha DP, Zhao H, Carlos AJ, Wei S, Pun TK, Wu K, Zandi E, Kelly K, Lee AS. Endoplasmic reticulum stress activates SRC, relocating chaperones to the cell surface where GRP78/CD109 blocks TGF-beta signaling. Proc Natl Acad Sci U S A. 2018;115(18):E4245–54.
5. Dingerdissen HM, Torcivia-Rodriguez J, Hu Y, Chang TC, Mazumder R, Kahsay R. BioMuta and BioXpress: mutation and expression knowledgebases for cancer biomarker discovery. Nucleic Acids Res. 2018;46(D1):D1128–36.
6. Lee WR, Na H, Lee SW, Lim WJ, Kim N, Lee JE, Kang C. Transcriptomic analysis of mitochondrial TFAM depletion changing cell morphology and proliferation. Sci Rep. 2017;7(1):17841.
7. Gautier L, Cope L, Bolstad BM, Irizarry RA. Affy--analysis of Affymetrix GeneChip data at the probe level. Bioinformatics. 2004;20(3):307–15. 8. Cancer Genome Atlas N. Comprehensive molecular portraits of human
breast tumours. Nature. 2012;490(7418):61–70.
9. Day KC, Lorenzatti Hiles G, Kozminsky M, Dawsey SJ, Paul A, Broses LJ, Shah R, Kunja LP, Hall C, Palanisamy N, et al. HER2 and EGFR overexpression support metastatic progression of prostate cancer to bone. Cancer Res. 2017;77(1):74–85.
10. Loi S, Haibe-Kains B, Desmedt C, Wirapati P, Lallemand F, Tutt AM, Gillet C, Ellis P, Ryder K, Reid JF, et al. Predicting prognosis using molecular profiling in estrogen receptor-positive breast cancer treated with tamoxifen. BMC Genomics. 2008;9:239.
11. Desmedt C, Di Leo A, de Azambuja E, Larsimont D, Haibe-Kains B, Selleslags J, Delaloge S, Duhem C, Kains JP, Carly B, et al. Multifactorial approach to predicting resistance to anthracyclines. J Clin Oncol. 2011; 29(12):1578–86.
12. Lee J, Choi C. Oncopression: gene expression compendium for cancer with matched normal tissues. Bioinformatics. 2017;33(13):2068–70.
13. Krupp M, Itzel T, Maass T, Hildebrandt A, Galle PR, Teufel A.
CellLineNavigator: a workbench for cancer cell line analysis. Nucleic Acids Res. 2013;41(Database issue):D942–8.
14. Shaul YD, Yuan B, Thiru P, Nutter-Upham A, McCallum S, Lanzkron C, Bell GW, Sabatini DM. MERAV: a tool for comparing gene expression across human tissues and cell types. Nucleic Acids Res. 2016;44(D1): D560–6.
15. Rhodes DR, Yu J, Shanker K, Deshpande N, Varambally R, Ghosh D, Barrette T, Pandey A, Chinnaiyan AM. ONCOMINE: a cancer microarray database and integrated data-mining platform. Neoplasia. 2004;6(1):1–6.
16. Gao J, Aksoy BA, Dogrusoz U, Dresdner G, Gross B, Sumer SO, Sun Y, Jacobsen A, Sinha R, Larsson E, et al. Integrative analysis of complex cancer genomics and clinical profiles using the cBioPortal. Sci Signal. 2013;6(269):pl1.
17. Krupp M, Marquardt JU, Sahin U, Galle PR, Castle J, Teufel A. RNA-Seq Atlas--a reference dAtlas--atAtlas--abAtlas--ase for gene expression profiling in normAtlas--al tissue by next-generation sequencing. Bioinformatics. 2012;28(8):1184–5.
18. Chen X, Miao Z, Divate M, Zhao Z, Cheung E. KM-express: an integrated online patient survival and gene expression analysis tool for the identification and functional characterization of prognostic markers in breast and prostate cancers. Database. 2018;2018.
19. Wan Q, Dingerdissen H, Fan Y, Gulzar N, Pan Y, Wu TJ, Yan C, Zhang H, Mazumder R. BioXpress: an integrated RNA-seq-derived gene expression database for pan-cancer analysis. Database. 2015;2015.