R E S E A R C H A R T I C L E
Open Access
Diet and exercise changes following
direct-to-consumer personal genomic testing
Daiva Elena Nielsen
1,2†, Deanna Alexis Carere
3†, Catharine Wang
4, J. Scott Roberts
5, Robert C. Green
1,2,6,7*,
for the PGen Study Group
Abstract
Background:The impacts of direct-to-consumer personal genomic testing (PGT) on health behaviors such as diet and exercise are poorly understood. Our investigation aimed to evaluate diet and exercise changes following PGT and to determine if changes were associated with genetic test results obtained from PGT.
Methods:Customers of 23andMe and Pathway Genomics completed a web-based survey prior to receiving PGT results (baseline) and 6 months post-results. Fruit and vegetable intake (servings/day), and light, vigorous and strength exercise frequency (days/week) were assessed. Changes in diet and exercise were examined using paired t-tests and linear regressions. Additional analyses examined whether outcomes differed by baseline self-reported health (SRH) or content of PGT results.
Results:Longitudinal data were available for 1,002 participants. Significant increases were observed for vegetable intake (meanΔ= 0.11 (95% CI = 0.05, 0.17),p= 0.0003) and strength exercise (Δ= 0.14 (0.03, 0.25),p= 0.0153). When stratified by SRH, significant increases were observed for all outcomes among lower SRH participants: fruit intake,Δ= 0.11 (0.02, 0.21), p= 0.0148; vegetable intake,Δ= 0.16 (0.07, 0.25),p= 0.0005; light exercise,Δ= 0.25 (0.03, 0.47),p= 0.0263; vigorous exercise,
Δ= 0.23 (0.06, 0.41),p= 0.0097; strength exercise,Δ= 0.19 (0.01, 0.37),p= 0.0369. A significant change among higher SRH participants was only observed for light exercise, and in the opposite direction:Δ= -0.2468 (-0.06, -0.44),p= 0.0111. Genetic results were not consistently associated with any diet or exercise changes.
Conclusions:The experience of PGT was associated with modest, mostly positive changes in diet and exercise. Associations were independent of genetic results from PGT.
Keywords: Direct-to-consumer, Genetic testing, Health behavior, Diet, Exercise
Background
Direct-to-consumer (DTC) personal genomic testing (PGT) services persist, despite continued concern and interven-tions from regulatory agencies. Most notably, the Food and Drug Administration (FDA) sent a warning letter to 23andMe, Inc. in 2013, ordering the company to cease mar-keting of its health-related PGT services until it received FDA approval [1]. The FDA raised concerns about the val-idity of the information returned to consumers and the
potential for inappropriate medical actions post-PGT. However, some have argued that PGT could enhance indi-vidual health autonomy and may motivate positive lifestyle changes [2–4]. This could be particularly beneficial, as a re-cent analysis across four studies concluded that a healthy lifestyle reduced the relative risk of coronary artery disease by nearly 50% among those at high genetic risk [5]. In February 2015, the FDA approved the first 23andMe health report and as of October 2015 the company is returning carrier status reports (a subset of its previous offerings) to customers [6].
The first regulatory approval of DTC-PGT in the United States has reignited academic interest in the impact and utility of returning genomic information without health-care professional involvement. One key question is whether or not PGT has the potential to motivate diet or * Correspondence:[email protected]
†Equal contributors
1Division of Genetics, Department of Medicine, Brigham and Women’s
Hospital, EC Alumnae Building, Suite 301, 41 Avenue Louis Pasteur, Boston, MA 02115, USA
2Harvard Medical School, EC Alumnae Building, Suite 301, 41 Avenue Louis
Pasteur, Boston, MA 02115, USA
Full list of author information is available at the end of the article
exercise changes that could prevent lifestyle-related chronic diseases, such as heart disease and type 2 diabetes [7]. Previous studies examining this question have re-ported that PGT is not associated with diet or exercise changes [8, 9] or that the PGT experience generally, including the personal context in which testing is sought (but not the individual genetic risk information received), is associated with non-specific, positive health behavior changes [10]. These prior investigations have been limited by selected convenience samples [8] or the use of general survey items that did not measure specific diet or exercise variables both pre- and post-PGT [10]. In addition, not all previous work has considered baseline health status and/ or disease risk perception as factors that could influence diet and exercise changes following PGT. These are important limitations because health behavior has been shown to vary by health status as well as self-perceived health [11], and it is unknown if perceptions of personal disease risk impact diet and exercise following PGT.
The Impact of Personal Genomics (PGen) Study is a longitudinal survey assessment of actual PGT customers from two companies, 23andMe, Inc. (23andMe) and Pathway Genomics Corp. (Pathway). Specific diet and exercise variables were measured both before and after PGT, and self-reported health status (SRH) and disease risk perception were also measured. Participants’ PGT results were linked to their survey responses. Here we present an analysis using PGen Study data that examines changes to self-reported fruit and vegetable intake and exercise frequency following PGT. Prior evidence sug-gests that DTC-PGT users are particularly motivated to undergo PGT for purposes of health improvement [10], yet commentary on DTC-PGT often assumes that its users are likely already to be in good health (i.e. the “worried well”). For this reason, we were interested not only in whether the PGT experience could motivate health behavior change, but whether its effects would differ by user health status. We hypothesized that diet and exercise would change from pre-PGT to post-PGT, and further investigated whether the changes would vary by baseline SRH, actual genetic testing results received, or disease risk perception.
Methods
Study design and procedures
The design, recruitment and data collection procedures in the PGen Study have been previously reported [12]. Briefly, new customers of 23andMe and Pathway were recruited online after ordering PGT between March and July 2012. Following online consent, participants were invited to three web-based surveys administered by Sur-vey Sciences Group, LLC (now SoundRocket): at base-line (prior to receipt of results), 2 weeks, and 6 months after results were viewed. In total, 1,464 participants
completed the baseline survey and were eligible for follow-up; of these, 1,046 (71.4%) and 1,042 (71.2%) sub-mitted the 2-week and 6-month surveys, respectively. PGT results were provided by the companies and linked to individual-level survey data. The PGen Study was approved by the Partners Human Research Committee and the University of Michigan School of Public Health Institutional Review Board.
Survey instruments
At baseline, participants reported their demographic infor-mation and SRH was assessed using a validated 5-point scale from the SF-36 Health Survey [13]. At baseline and 6 month follow-up, daily fruit and vegetable servings were assessed using a validated 2-item food frequency question-naire [14] (responses: None, ≤1, 2, 3, 4,≥5 servings/day) and the number of days per week of engaging in light/ moderate, vigorous, and strength exercises for at least 10 min were assessed using items adapted from the vali-dated National Health Interview Survey [15] (responses: 0–7 days/week). At 6 month follow-up, respondents were asked“Did you make any of the following health or well-ness changes that were specifically motivated by your PGT results?”and they selected Yes/No for each of“Diet” and“Exercise”. Because the median time to follow-up sur-vey initiation in the PGen Study was 6.3 months [12], most participants responded to the baseline and 6 month surveys in opposing seasons (i.e., Spring and Fall, or Sum-mer and Winter, depending on date of PGT). While par-ticipants were not able to complete the 6 month survey early, some participants did complete and submit the 6 month survey late, and so experienced a less significant change in seasonality between surveys. To account for the fact that change in seasonality could contribute to health behavior changes, we created a variable for significant season change (yes/no) based on season of baseline and 6 month survey submission. Survey season was assigned according to the month of survey submission (Spring = March-May; Summer = June-August; Fall = September-November; Winter = December-February), and significant season change was coded as“yes”for a change to a non-consecutive season (e.g., Spring to Fall, or Summer to Winter), and as“no”for a change to a consecutive season (e.g., Spring to Summer, or Summer to Spring) or no change in season.
Personal genomic testing results
qualitative risk category for each condition (below average risk, average risk, and three levels of above aver-age risk). To harmonize genetic risk information across companies and analyses, a threshold RR level of 1.2 was selected to distinguish averageor below average genetic risk (23andMe RR < 1.2; two lowest Pathway categories) from above average genetic risk (23andMe RR≥1.2; three highest Pathway categories). This threshold was consistent with the reporting standards of both compan-ies, and endorsed by PGen Study researchers as appro-priate in the context of testing common, low-penetrance genetic variants.
Genetic risk scores and risk perception
Since PGT results were linked to participants’survey re-sponses, we were able to examine whether specific genetic risk information was associated with changes to diet and exercise. Because diet and exercise can modify risk of car-diometabolic diseases, we first created anadditive cardio-metabolic genetic risk score based on PGT-derived risk estimates for obesity, type 2 diabetes (T2D), and coronary heart disease (CHD). This score was the sum of the num-ber of above average PGT risk results (referred to as "ele-vated risk") a participant received for the three cardiometabolic conditions (i.e. either 0, 1, 2 or 3 elevated risk results). To examine the aggregate impact of all PGT-derived disease risk estimates received, we created an additive total genetic risk scorecorresponding to the num-ber of above average (elevated) risk results received across all health conditions in a participant’s PGT report. De-pending on gender, ethnicity, and DTC-PGT company, participants received risk estimates for between 25 and 29 health conditions, which included the cardiometabolic conditions mentioned above, various cancers, neurological disorders, autoimmune disorders and others (total risk score = 0-29; complete details of the conditions included in the score are reported by van der Wouden et al. [17]).
In addition to genetic risk, we examined whether per-ceived risk of cardiometabolic disease influenced changes to diet and exercise. At both baseline and 6 month follow-up, participants were asked to rate their perceived risk of developing obesity, T2D and CHD on a 5-point scale (much lower than average= 1 to much higher than average= 5, with average= 3). An additive disease risk perception score was created by summing participant responses for perceived risk of all three con-ditions at both baseline and follow-up. This yielded two scores that could range from 3 to 15 (one for baseline risk perception and one for follow-up risk perception). Change in risk perception was calculated by subtracting the follow-up score from the baseline score and thus the variable for change in risk perception could range from -12 to 12 (see Carere et al. for details of how risk
perception and change were measured in the PGen Study [16]).
Statistical analyses
Data were obtained from participants who submitted both the baseline and 6-month survey, and had available responses for the items described above. Merged data are presented for the two PGT companies because a general agreement was made between company repre-sentatives and researchers to avoid presenting company-specific data when results could be perceived as relating to market research [18]. Descriptive statistics were used to characterize baseline demographic characteristics. Two-sided paired t-tests were used to test for significant changes in each diet and exercise item in the full sample, and within subsamples stratified by SRH (poor/fair/good vs. very good/excellent). We performed linear regression with a Tukey-Kramer test for pairwise comparisons to determine if diet or exercise changes significantly differed between SRH subgroups. These models were ad-justed for the specific baseline behavior (i.e. the corre-sponding diet or exercise variable), PGT company, age, gender, education, income, race, ethnicity (Hispanic or non-Hispanic), BMI, SRH, and season change. To assess consistency between the measured diet and exercise var-iables and general self-reported dietary and exercise changes, we used two-sided t-tests to compare mean changes in fruit/vegetable intake and exercise frequency across groups stratified by general self-reported changes (Yes/No diet or exercise change).
Linear regressions of change in fruit/vegetable intake and exercise frequency on the cardiometabolic genetic risk score and total genetic risk score were conducted with adjustment for the baseline behavior, PGT company, age, gender, education, income, race, ethnicity, BMI, SRH, and season change. We used similar linear regression models of diet/exercise change on change in risk perception of cardiometabolic disease, but also adjusted for baseline risk perception in addition to the covariates listed previously. Analyses were conducted using SAS software (version 9.3; SAS Institute, Cary, NC), and linear regression models were fitted using PROC GLM. Statistical significance for all analyses was set atp< 0.05.
Results
frequency were observed (Table 2). Vegetable intake increased by an average of 0.11 servings per day and fre-quency of at least 10 min of strength exercise increased by an average of 0.14 days per week. When stratified by SRH, significant increases in all diet and exercise behaviors were observed among the lower SRH group, while a significant decrease in light exercise frequency was observed among the higher SRH group (average decrease in frequency of 0.25 days per week). Adjusted linear regression models with the Tukey-Kramer pairwise comparison demon-strated that only change in light exercise differed
significantly between the two SRH subgroups (p= 0.0452). The direction of the observed change in light exercise was opposite between the two groups (i.e. in-crease in frequency among the lower SRH group, de-crease in frequency among the higher SRH group).
Thirty percent of participants reported making a change to their diet that was specifically motivated by their PGT results, and 26% reported changing their exer-cise based on their PGT results (Table 3). The subset of
respondents that reported diet changes had
Table 1Baseline demographics stratified by self-reported health
Variable Baseline responders eligible for
follow-up (n= 1464)
Baseline responders with complete data (n= 1002)
Poor/Fair/Good SRH
(n= 449)
Very Good/ Excellent SRH (n = 551)
n (%)
Male 567 (38.7) 401 (40.0) 156 (34.7) 245 (44.5)
Race
White 1234 (84.3) 860 (85.8) 383 (85.3) 475 (86.2)
Black 37 (2.5) 23 (2.3) 11 (2.5) 12 (2.2)
Asian 50 (3.4) 32 (3.2) 8 (1.8) 24 (4.4)
Other/Multi-Ethnic 143 (9.8) 87 (8.7) 47 (10.5) 40 (7.3)
Hispanic 81 (5.5) 50 (5.0) 25 (5.6) 25 (4.5)
Education
Less than College 319 (21.8) 204 (20.4) 117 (26.1) 87 (15.8)
College Degree 448 (30.6) 305 (30.4) 118 (26.3) 186 (33.8)
Some Graduate Degree 513 (35.0) 359 (35.8) 162 (36.1) 196 (35.6)
Doctoral Degree 184 (12.6) 134 (13.4) 52 (11.6) 82 (14.9)
Annual Income
< $40,000 242 (16.5) 171 (17.1) 102 (22.7) 69 (12.5)
$40,000–$69,999 272 (18.6) 183 (18.3) 84 (18.7) 98 (178)
$70,000–$99,999 288 (19.7) 205 (20.5) 96 (21.4) 108 (19.6)
$100,000–$199,999 457 (31.2) 303 (30.2) 121 (27.0) 182 (33.0)
≥$200,000 184 (12.6) 128 (12.8) 38 (8.5) 90 (16.3)
Missing 21 (1.4) 12 (1.2) 8 (1.8) 4 (0.7)
PGT company
23andMe 947 (64.7) 620 (61.9) 232 (51.7) 386 (70.0)
Pathway Genomics 517 (35.3) 382 (38.1) 217 (48.3) 165 (30.0)
Mean ± standard deviation (Range)
Age 47.5 ± 15.5 (19–94) 46.9 ± 15.6 (19–94) 47.6 ± 15.1 (19–91) 46.2 ± 15.9 (19–94)
BMI 26.9 ± 6.0 26.9 ± 6.0 28.8 ± 7.1 25.3 ± 4.4
(15.4–62.0) (16.1–62.0) (16.1–62.0) (16.6–47.3)
Fruit Servings per Day (0–5+) 2.0 ± 1.1 2.0 ± 1.1 1.9 ± 1.1 2.2 ± 1.1
Vegetable Servings per Day (0–5+) 2.5 ± 1.2 2.5 ± 1.2 2.3 ± 1.1 2.7 ± 1.2
Light Exercise per Week (0–7) 3.5 ± 2.3 3.5 ± 2.3 3.3 ± 2.2 3.7 ± 2.2
Vigorous Exercise per Week (0–7) 2.3 ± 2.1 2.4 ± 2.1 1.8 ± 2.0 2.8 ± 2.1
corresponding significant increases in intakes of fruit and vegetables (an average increase of 0.19 and 0.31 servings per day, respectively), while the subset that re-ported exercise changes had corresponding significant increases in the frequency of at least 10 min per day of vigorous and strength exercise (an average frequency in-crease of 0.58 and 0.47 days per week, respectively).
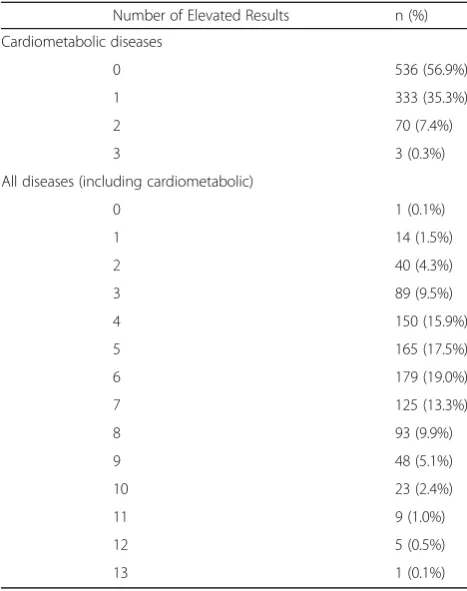
Summary information about the additive genetic risk score for cardiometabolic conditions and the additive gen-etic risk score for all health conditions is shown in Table 4. The mean number of elevated test results for the three cardiometabolic conditions was 0.48 ± 0.64 (mean ± SD). No significant associations were found between the car-diometabolic genetic risk score and change in any diet or exercise variable (Table 5). Taking all tested conditions together, the number of elevated test results ranged from 0 to 13 and the average number of elevated test results for all health conditions was 5.6 ± 2.2 (mean ± SD). The total genetic risk score was inversely associated with change in fruit servings per day (β= -0.03 (-0.06, -0.01), p= 0.02) (Table 5). From baseline to follow-up, the average change in overall risk perception of cardiometabolic disease increased (0.60 ± 2.2 (mean ± SD)), and this change in risk perception was inversely associated with change in vigor-ous exercise (β= -0.08 (-0.14, -0.02), p= 0.01) (Table 5). Table 2Self-reported diet and exercise changes after PGT
Full Sample (n= 1,002)
Poor/Fair/Good SRH (n= 449)
Very Good/Excellent SRH (n= 551)
Tukey-Kramer adjusted p-valuea
Change % Pairedt-test % Pairedt-test % Pairedt-test
Fruit servings per days
Decrease 24.0 Δ= 0.06
(-0.005, 0.12) p= 0.07
21.2 Δ= 0.11
(0.02, 0.21) p= 0.0148
26.1 Δ= 0.01
(-0.07, 0.10) p= 0.77
0.7191
No Change 49.0 50.1 48.3
Increase 27.0 28.7 25.6
Vegetable servings per day
Decrease 21.2 Δ= 0.11
(0.05, 0.17) p= 0.0003
19.8 Δ= 0.16
(0.07, 0.25) p= 0.0005
22.3 Δ= 0.06
(-0.01, 0.14) p= 0.11
0.7032
No Change 49.8 50.6 49.0
Increase 29.0 29.6 28.7
Light exercise
Decrease 35.2 Δ= -0.02
(-0.16, 0.13) p= 0.80
31.2 Δ= 0.25
(0.03, 0.47) p= 0.0263
38.7 Δ= -0.25
(-0.06, -0.44) p= 0.0111
0.0452
No Change 31.0 32.3 30.0
Increase 33.8 36.5 31.3
Vigorous exercise
Decrease 28.7 Δ= 0.09
(-0.02, 0.21) p= 0.11
24.5 Δ= 0.23
(0.06, 0.41) p= 0.0097
32.3 Δ= -0.02
(-0.18, 0.13) p= 0.76
0.1236
No Change 40.6 44.5 37.4
Increase 30.7 31.0 30.3
Strength exercise
Decrease 21.6 Δ= 0.14
(0.03, 0.25) p= 0.0153
17.4 Δ= 0.19
(0.01, 0.37) p= 0.0369
25.1 Δ= 0.10
(-0.05, 0.24) p= 0.18
0.2690
No Change 53.2 57.2 49.7
Increase 25.2 25.4 25.2
a
Adjusted for baseline behavior, company, age, gender, education, income, race, ethnicity, baseline BMI, baseline self-reported health, season change
Table 3Comparison of changes in diet and exercise variables to self-reported general wellness changes
Did you make any of the following health or wellness changes that were specifically motivated by your PGT results?
Diet Yes
N = 301 (30%) No
N = 701 (70%)
Fruit Servings per Day Δ= 0.19 (0.03, 0.31) p= 0.0027
Δ= 0.001 (-0.07, 0.07) p= 0.96 Vegetable Servings per Day Δ= 0.31
(0.19, 0.42) p< 0.0001
Δ= 0.02 (-0.04, 0.09) p= 0.50
Exercise Yes
N = 255 (26%) No
N = 747 (74%)
Light Exercise per Week Δ= 0.18 (-0.11, 0.47) p= 0.22
Δ= -0.09 (-0.26, 0.08) p= 0.30 Vigorous Exercise per Week Δ= 0.58
(0.33, 0.83) p< 0.0001
Δ= 0.08 (-0.20, 0.05) p= 0.25 Strength Exercise per Week Δ= 0.47
(0.23 0.71) p= 0.0002
While these two effects were significant, the inclusion of genetic risk scores or perceived risk did not explain any more variance in self-reported diet and exercise changes than the covariate-only model (Table 5).
Discussion
In a longitudinal study of actual DTC-PGT customers, we found modest, but statistically significant, increases in self-reported vegetable consumption and strength ex-ercise frequency post-PGT. There appears to be a differ-ence in diet and exercise changes when participants are separated by self-reported health status, as the lower SRH group also demonstrated a significant increase in fruit consumption and frequency of light and vigorous exercise, while a decrease in the frequency of light exer-cise was observed among the higher SRH group. Although nearly a third of participants reported making diet and exercise changes that were directly motivated by their PGT results, there was no consistent evidence that specific genetic risk information received from PGT, or post-PGT change in cardiometabolic disease risk per-ception, were associated with the specific diet and exer-cise variables that we measured. The two significant findings observed in our analyses of genetic risk infor-mation and change in risk perception deviate from an overall pattern of null results that suggest that the risk
variables we evaluated were not associated with observed changes in diet and exercise following PGT.
The consistent observation of diet and exercise im-provements within the lower SRH group, but not within the higher SRH group may reflect the fact that individ-uals with higher baseline SRH were already engaging more frequently in healthy diet and exercise behaviors before PGT; moreover, they may in fact be objectively healthier than the lower SRH group, and have a lesser (or at least perceived lesser) need to improve their diet and exercise. The apparent reduction in frequency of light exercise in this group is also of interest, for if accurate, this could represent an undesirable effect of re-ceiving genetic risk information among individuals with high SRH. We cannot determine whether health behav-ior changes we observed were a consequence of the PGT experience, or if the decision to pursue PGT was part of a broader goal to improve one’s health that incor-porated an intention to modify diet and exercise. Finally, although we did not find any consistent evidence that cardiometabolic or total genetic risk burden were associ-ated with diet or exercise changes post-PGT, it is pos-sible that some other genetic information returned by
the companies (e.g., results pertaining to
Table 4Distribution of elevated risk PGT results
Number of Elevated Results n (%)
Cardiometabolic diseases
0 536 (56.9%)
1 333 (35.3%)
2 70 (7.4%)
3 3 (0.3%)
All diseases (including cardiometabolic)
0 1 (0.1%)
1 14 (1.5%)
2 40 (4.3%)
3 89 (9.5%)
4 150 (15.9%)
5 165 (17.5%)
6 179 (19.0%)
7 125 (13.3%)
8 93 (9.9%)
9 48 (5.1%)
10 23 (2.4%)
11 9 (1.0%)
12 5 (0.5%)
13 1 (0.1%)
Table 5Impact of genetic test scores and risk perception on changes in diet and exercise
Variable β(95% CI),p-value R2
Cardiometabolic genetic test score
Fruit Servings per Day β= -0.04 (-0.14, 0.06),p= 0.42 0.18
Vegetable Servings per Day β= -0.02 (-0.11, 0.08),p= 0.73 0.14
Light Exercise per Week β= -0.01 (-0.22, 0.20),p= 0.90 0.28
Vigorous Exercise per Week β= -0.09 (-0.26, 0.08),p= 0.29 0.23
Strength Exercise per Week β= 0.02 (-0.14, 0.18),p= 0.82 0.23
Total genetic risk score
Fruit Servings per Day β= -0.03 (-0.06, -0.01),p= 0.02 0.18
Vegetable Servings per Day β= -0.007 (-0.03, 0.02),p= 0.63 0.14
Light Exercise per Week β= 0.01 (-0.05, 0.07),p= 0.73 0.28
Vigorous Exercise per Week β= -0.03 (-0.08, 0.02),p= 0.28 0.23
Strength Exercise per Week β= -0.005 (-0.05, 0.04),p= 0.82 0.23
Change in risk perceptiona
Fruit Servings per Day β= -0.004 (-0.04, 0.03),p= 0.81 0.20
Vegetable Servings per Day β= 0.005 (-0.03, 0.04),p= 0.75 0.15
Light Exercise per Week β= -0.04 (-0.11, 0.04),p= 0.31 0.28
Vigorous Exercise per Week β= -0.08 (-0.14, -0.02),p= 0.01 0.26
Strength Exercise per Week β= 0.004 (-0.06, 0.06),p= 0.91 0.23
Adjusted for: baseline behavior, company, season change, age, gender, education, income, race, ethnicity, baseline BMI, baseline self-reported health βestimates are raw coefficients
a
Also adjusted for baseline perceived riskNote: The presented model R2
pharmacogenomics or non-medical physical traits) could motivate diet and exercise behavior change. In fact, it may be the case that no single genetic result is univer-sally motivating to PGT consumers, but rather that cer-tain individuals may be inclined to change their diet based on an elevated risk of type 2 diabetes, while others (perhaps owing to personal context or family history) may be more immediately motivated by an elevated gen-etic risk of breast cancer. Nevertheless, the recent report of reduced coronary events among individuals with high genetic risk who were noted to follow good lifestyle habits [5] highlights the importance of efforts to use genetic testing as a tool to motivate positive lifestyle changes.
Prior studies of the effect of genetic risk information on health behavior change have not typically reported signifi-cant post-testing changes to diet or exercise [8–10]. For example, Bloss et al. followed approximately 2000 Navi-genics customers over a year and examined changes in diet-ary fat intake and exercise [8, 9]. In that study, no significant changes were observed at either the 3-month or 12-month follow-up; however, participants in this study were employees of a personalized medicine research insti-tute, and had a PGT experience that was facilitated by the research team (e.g., participants could ask questions of searchers during the testing process). Kaufman et al. re-ported a cross-sectional post-PGT survey of 23andMe, deCODEme, and Navigenics customers, of which one third reported that they were being more careful about their diet and 14% reported they were exercising more. In addition, they found evidence that self-reported behavior change var-ied by perceived health status (e.g., the poorer self-perceived health group was more likely to report changes to supplement use) [10]. A major limitation of these find-ings, however, is that the data were collected at only one time point, and no specific diet or exercise behavior vari-ables (e.g., frequency, intensity) were measured.
In addition to the observational studies described above, systematic reviews of randomized controlled trials (RCTs) and other trials have demonstrated few effects of disclosing genetic risk information on health behavior [19, 20]. (However, it is important to note that most studies examining the impact of genetic information are not comprised of PGT consumers). For example, a 2010 Cochrane review examined the effects of communicating DNA-based risk estimates on diet, physical activity and smoking cessation from 13 studies [19], and the authors concluded that the information had little or no effect on physical activity and smoking cessation, but might have a small effect on diet. A recent update to this systematic review examined 18 studies (of which 7 examined diet and 6 examined physical activity) and concluded that DNA-based risk estimates did not change any of the health behavior outcomes that were assessed [20].
However, despite this conclusion, the pooled analysis of the dietary study was borderline significant (p= 0.05) and the authors noted that there may be a small effect of genetic risk communication on diet. Indeed, a number of RCTs and intervention studies have demonstrated dietary changes following disclosure of genetic informa-tion [21–24]. While our investigation utilized a prospect-ive observational design, it is worthwhile to note some consistency of results between the different research ap-proaches. Moreover, there is likely a substantial degree of heterogeneity among both observational studies and RCTs in the specific type of genetic information that is returned, the presentation of the information, and the health-related recommendations that are given to indi-viduals. Heterogeneity may contribute to some varied observations and effects that have been reported in the literature on this topic.
Our results support the position that DTC-PGT has the potential to motivate health behavior change in users who may benefit from diet and exercise modifi-cations, although the small magnitude of observed diet and exercise changes (on the order, for example, of a few to a dozen additional days of exercise per year) indicates that genetic risk information – at least as provided through a commercial, DTC model – is likely limited in its power to effect change. Nonethe-less, we are encouraged by the dual findings that nearly a third of participants reported making diet or exercise changes on the basis of their DTC-PGT re-sults, and that food intake and exercise frequency measurements were consistent with reported changes, particularly among those participants who rated themselves as having lower health status. If DTC-PGT can effect behavior change, it is likely because its users are already sufficiently health-conscious, and in some cases specifically motivated to obtain testing as a means to learn about and improve their health [17, 25–28]. There-fore, rather than its consumers responding to specific gen-etic risk information or accompanying recommendations, it may be the case that DTC-PGT motivates behavior change via a “halo effect”: [29] participants emerge from the PGT experience (considered to begin when they first learn of commercial genetics and engage in decision-making about testing, and to continue through to their extended contemplation and sharing of results with friends, family, and health care providers) with a re-minder of the importance of certain health behaviors and a motivation to play an active role in their health management. This interpretation is consistent with the fact that DTC-PGT reports contain dozens of results, contextualized within broad educational components addressing disease etiology, both genetic and non-genetic risk factors, and non-genetic mechanisms of disease
summarize the results of a prior epidemiology studies, present population disease statistics, and orient con-sumers to the concepts and interpretation of odds ra-tios and relative risk; moreover, these reports are carefully personalized to the consumer (e.g., by repeat-edly using their name, referring to their gender and age, and describing their unique genetic makeup), which may make the information feel more relevant and valuable to the individual consumer. Within this enriched, educational, and highly personalized context, DTC-PGT as a health education activity may have a unique ability to impact how individuals perceive health, and how they make decisions regarding their health behaviors and medical care.
Limitations of this study include its reliance on self-reported data and observational design. However, the consistency we observed across survey items measur-ing similar effects (i.e. change in specific diet and ex-ercise variables and general self-report of diet and exercise changes) is reassuring. Moreover, our study improves upon limitations of previous observational work, particularly in its measurement of pre- and post-disclosure changes to specific diet and exercise variables using validated tools, consideration of base-line health status, measurement of participants’ per-ceptions of their own disease risks, and our sample of customers who sought commercial PGT online [18]. While the PGen Study sample is somewhat homoge-neous (e.g., largely White), there is evidence to
sug-gest that PGen Study enrollees are broadly
representative of the typical DTC-PGT consumer [12]. Our findings are not intended to be generalizable to the general U.S. population, but rather to the individ-uals who pursue commercial DTC-PGT. The changes we observed to diet and exercise were self-reported and just fractions of a dietary serving and exercise frequency, so the significance of these observations as they relate to health outcomes is uncertain. We also did not distinguish between variable factors such as exercise duration or type of fruit or vegetable. More-over, it is unclear to what extent reporting may have been influenced by social desirability or persisted lon-ger than 6 months. However, modest improvements in diet and exercise have been shown to be associated with population health [31–33]. Finally, because this was an observational study, the design does not en-able us to have accounted for all factors that could have influenced our outcome variables of interest. Moreover, we cannot rule out the possibility that our findings were due to chance, particularly given the number of hypothesis tests performed. We also note that the DTC-PGT climate in the United States has changed since the PGen Study was conducted [1], and that 23andMe no longer offers consumers the
disease risk estimates reported here, while Pathway Genomics has left the DTC market altogether. Thus, our findings do not accurately reflect a current prod-uct on the market, but have the advantage of captur-ing a consumer experience about which the FDA has requested additional research, and which may be rein-troduced in the future, pending FDA approval.
Conclusions
Our sample of PGT consumers made diet and exercise changes following PGT. These changes were independent of both cardiometabolic genetic risk and total genetic risk, and were also independent of changes in disease risk per-ception. As advanced genomic technologies (e.g., whole genome/exome sequencing) become more accessible to consumers, it will be important to assess whether or not these technologies have a similar impact on diet and exer-cise behaviors.
Abbreviations
DTC-PGT:Direct-to-consumer personal genomic testing; FDA: United States Food and Drug Administration; PGT: Personal genomic testing;
SRH: Self-reported health
Acknowledgements
‡Members of the PGen Study at the time of publication are as follows: Robert C. Green, Joel B. Krier, Sarah S. Kalia, Kurt D. Christensen, Daiva E. Nielsen, Harvard Medical School and Brigham and Women’s Hospital; Peter Kraft, Harvard School of Public Health; J Scott Roberts, Lan Q. Le, Jenny Ostergren, University of Michigan School of Public Health; Wendy R. Uhlmann, Mick P. Couper, University of Michigan; Deanna Alexis Carere, McMaster University; Mack T. Ruffin IV, Penn State Hershey Medical Center; Lisa S. Lehmann, National Center for Ethics in Health Care, US Department of Veterans Affairs; Stacy W. Gray, City of Hope; Joanna L Mountain, Amy K. Kiefer, 23andMe; Glenn Braunstein, Pathway Genomics; Scott D. Crawford,
SoundRocket; L. Adrienne Cupples, Clara A. Chen, Catharine Wang, Boston University; Barbara A Koenig, University of California San Francisco; Kimberly Kaphingst, University of Utah; Sarah Gollust, University of Minnesota.
Funding
The PGen Study is supported by the National Institutes of Health (NIH) National Human Genome Research Institute (R01-HG005092). DEN is supported by a Canadian Institutes of Health Research Postdoctoral Fellowship Award. DAC is supported by a Michael G. DeGroote Postdoctoral Fellowship from McMaster University and a Canadian Institutes of Health Research Postdoctoral Fellowship Award. RCG is also supported by NIH U01-HG006500, U19-HD077671,
U01-HG008685 R01-HG006615 and R01-HG006615. The content is solely the responsibility of the authors and does not necessarily represent the official views of the National Center for Research Resources, the National Institutes of Health, the National Cancer Institute, or the Canadian Institutes of Health Research.
Availability of data and materials
Data is available from the authors upon request to [email protected].
Authors’contributions
Competing interests
RCG has received compensation for advisory services or speaking from Invitae, Prudential, Illumina, AIA, Helix and Genome Medical. The other authors have no competing interests.
Consent for publication
Not applicable.
Ethics approval and consent to participate
The PGen Study was approved by the Partners Human Research Committee and the University of Michigan School of Public Health Institutional Review Board. Informed consent was obtained from participants online prior to beginning the baseline survey.
Publisher’s Note
Springer Nature remains neutral with regard to jurisdictional claims in published maps and institutional affiliations.
Author details
1
Division of Genetics, Department of Medicine, Brigham and Women’s Hospital, EC Alumnae Building, Suite 301, 41 Avenue Louis Pasteur, Boston, MA 02115, USA.2Harvard Medical School, EC Alumnae Building, Suite 301, 41 Avenue Louis Pasteur, Boston, MA 02115, USA.3Department of Pathology
and Molecular Medicine, McMaster University, Hamilton, ON L8L 2X2, Canada.4Community Health Sciences Department, Boston University School
of Public Health, Boston, MA 02118, USA.5Department of Health Behavior & Health Education, University of Michigan School of Public Health, Ann Arbor, MI 48109, USA.6Partners Personalized Medicine, EC Alumnae Building, Suite 301, 41 Avenue Louis Pasteur, Boston, MA 02115, USA.7Broad Institute of MIT
and Harvard, Cambridge, MA 02142, USA.
Received: 17 June 2016 Accepted: 31 March 2017
References
1. U.S. Food and Drug Administration. 23andMe, Inc. 11/22/13. 2013. Available at: http://www.fda.gov/iceci/enforcementactions/warningletters/2013/ ucm376296.htm. Accessed 28 Apr 2016.
2. Bloss CS, Madlensky L, Schork NJ, Topol EJ. Genomic information as a behavioral health intervention: can it work? Per Med. 2011;8(6):659–67. 3. Green RC, Farahany NA. Regulation: the FDA is overcautious on consumer
genomics. Nature. 2014;505(7483):286–7.
4. Yim SH, Chung YJ. Reflections on the US FDA’s Warning on Direct-to-Consumer Genetic Testing. Genomics Inform. 2014;12(4):151–5.
5. Khera AV, Emdin CA, Drake I, Natarajan P, Bick AG, Cook NR, Chasman DI, Baber U, Mehran R, Rader DJ et al. Genetic risk, adherence to a healthy lifestyle, and coronary disease. NEJM. 2016;375:2349-358.
6. U.S. Food and Drug Administration. FDA permits marketing of first direct-to-consumer genetic carrier test for Bloom syndrome, 2015. Available at: http://www.fda.gov/NewsEvents/Newsroom/PressAnnouncements/ ucm435003.htm. Accessed 28 Apr 2016.
7. McBride CM, Koehly LM, Sanderson SC, Kaphingst KA. The behavioral response to personalized genetic information: Will genetic risk profiles motivate individuals and families to choose more healthful behaviors? Annu Rev Public Health. 2010;31:89–103.
8. Bloss CS, Schork NJ, Topol EJ. Effect of direct-to-consumer genomewide profiling to assess disease risk. N Engl J Med. 2011;364(6):524–34.
9. Bloss CS, Wineinger NE, Darst BF, Schork NJ, Topol EJ. Impact of direct-to-consumer genomic testing at long term follow-up. J Med Genet. 2013;50(6):393–400. 10. Kaufman DJ, Bollinger JM, Dvoskin RL, Scott JA. Risky business: risk perception
and the use of medical services among customers of DTC personal genetic testing. J Genet Couns. 2012;21(3):413–22.
11. Becker CM, Glascoff MA, Mitchell T, Durham TW, Arnold W. Assessing Perceived Health and Associated Health‐Promoting Behaviors: An Investigation of Methods Used to Assess Health Status. J Appl Soc Psychol. 2007;37(2):227–42. 12. Carere DA, Couper MP, Crawford SD, Kalia SS, Duggan JR, Moreno TA,
Mountain JL, Roberts JS, Green RC, Group PS. Design, methods, and participant characteristics of the Impact of Personal Genomics (PGen) Study, a prospective cohort study of direct-to-consumer personal genomic testing customers. Genome Med. 2014;6(12):96.
13. Ware Jr JE, Gandek B. Overview of the SF-36 Health Survey and the International Quality of Life Assessment (IQOLA) Project. J Clin Epidemiol. 1998;51(11):903–12.
14. Resnicow K, Odom E, Wang T, Dudley WN, Mitchell D, Vaughan R, Jackson A, Baranowski T. Validation of three food frequency questionnaires and 24-hour recalls with serum carotenoid levels in a sample of African-American adults. Am J Epidemiol. 2000;152(11):1072–80.
15. Centers for Disease Control and Prevention. Adult Physical Activity Questions on the National Health Interview Survey, 2009. Available at: http://www.cdc. gov/nchs/data/nhis/physicalactivity/pa_questions.pdf. Accessed 28 Apr 2016. 16. Carere DA, VanderWeele T, Moreno TA, Mountain JL, Roberts JS, Kraft P,
Green RC, Group PS. The impact of direct-to-consumer personal genomic testing on perceived risk of breast, prostate, colorectal, and lung cancer: findings from the PGen study. BMC Med Genomics. 2015;8(1):63. 17. van der Wouden CH, Carere DA, Maitland-van der Zee AH, Ruffin MT,
Roberts JS, Green RC, Impact of Personal Genomics Study G. Consumer perceptions of interactions with primary care providers after direct-to-consumer personal genomic testing. Ann Intern Med. 2016;164(8):513–22. 18. Lehmann LS, Kaufman DJ, Sharp RR, Moreno TA, Mountain JL, Roberts JS,
Green RC. Navigating a research partnership between academia and industry to assess the impact of personalized genetic testing. Genet Med. 2012;14(2):268–73.
19. Marteau TM, French DP, Griffin SJ, Prevost AT, Sutton S, Watkinson C, Attwood S, Hollands GJ. Effects of communicating DNA-based disease risk estimates on risk-reducing behaviours. Cochrane Database Syst Rev. 2010; 10:CD007275.
20. Hollands GJ, French DP, Griffin SJ, Prevost AT, Sutton S, King S, Marteau TM. The impact of communicating genetic risks of disease on risk-reducing health behaviour: systematic review with meta-analysis. BMJ. 2016;352:i1102. 21. Arkadianos I, Valdes AM, Marinos E, Florou A, Gill RD, Grimaldi KA. Improved
weight management using genetic information to personalize a calorie controlled diet. Nutr J. 2007;6:29.
22. Chao S, Roberts JS, Marteau TM, Silliman RA, Green RC. Health behavior changes after genetic risk assessment for Alzheimer disease: the REVEAL Study. Alzheimer Dis Assoc Disord. 2008;22(1):94–7.
23. Nielsen DE, El-Sohemy A. Disclosure of genetic information and change in dietary intake: a randomized controlled trial. PLoS ONE. 2014;9(11):e112665. 24. Hietaranta-Luoma HL, Tahvonen R, Iso-Touru T, Puolijoki H, Hopia A. An
intervention study of individual, apoE genotype-based dietary and physical-activity advice: impact on health behavior. J Nutrigenet Nutrigenomics. 2014;7(3):161–74.
25. Meisel SF, Carere DA, Wardle J, Kalia SS, Moreno TA, Mountain JL, Roberts JS, Green RC, Group PS. Explaining, not just predicting, drives interest in personal genomics. Genome Med. 2015;7(1):74.
26. Su Y, Howard HC, Borry P. Users’motivations to purchase direct-to-consumer genome-wide testig: an exploratory study of personal stories. J Community Genet. 2011;2:135–46.
27. Ostergren JE, Gornick MC, Carere DA, Kalia SS, Uhlmann WR, Ruffin MT, Mountain JL, Green RC, Roberts JS, Group PS. How Well Do Customers of Direct-to-Consumer Personal Genomic Testing Services Comprehend Genetic Test Results? Findings from the Impact of Personal Genomics Study. Public Health Genomics. 2015;18(4):216–24.
28. Baptista NM, Christensen KD, Carere DA, Broadley SA, Roberts JS, Green RC. Adopting genetics: motivations and outcomes of personal genomic testing in adult adoptees. Genet Med. 2016. Epub.
29. Woodard GA, Encarnacion B, Peraza J, Hernandez-Boussard T, Morton J. Halo effect for bariatric surgery: collateral weight loss in patients’family members. Arch Surg. 2011;146(10):1185–90.
30. Carere DA, Kraft P, Kaphingst KA, Roberts JS, Green RC, for the PGen Study Group. Consumers report lower confidence in their genetics knowledge following direct-to-consumer personal genomic testing. Genet Med. 2016;18(1):65–72. 31. Tobias M, Turley M, Stefanogiannis N, Vander Hoorn S, Lawes C, Mhurchu
CN, Rodgers A. Vegetable and fruit intake and mortality from chronic disease in New Zealand. Aust N Z J Public Health. 2006;30(1):26–31. 32. Mozaffarian D, Afshin A, Benowitz NL, Bittner V, Daniels SR, Franch HA, Jacobs
DR, Kraus WE, Kris-Etherton PM, Krummel DA, et al. Population approaches to improve diet, physical activity, and smoking habits: a scientific statement from the American Heart Association. Circulation. 2012;126(12):1514–63. 33. Lee DC, Pate RR, Lavie CJ, Sui X, Church TS, Blair SN. Leisure-time running