www.geosci-model-dev.net/10/751/2017/ doi:10.5194/gmd-10-751-2017
© Author(s) 2017. CC Attribution 3.0 License.
MATRIX-VBS (v1.0): implementing an evolving organic aerosol
volatility in an aerosol microphysics model
Chloe Y. Gao1,2, Kostas Tsigaridis3,2, and Susanne E. Bauer3,2
1Department of Earth and Environmental Sciences, Columbia University, New York, NY, 10027, USA 2NASA Goddard Institute for Space Studies, New York, NY, 10025, USA
3Center for Climate System Research, Columbia University, New York, NY, 10025, USA
Correspondence to:Kostas Tsigaridis (kostas.tsigaridis@columbia.edu) Received: 2 July 2016 – Discussion started: 14 September 2016
Revised: 29 December 2016 – Accepted: 19 January 2017 – Published: 16 February 2017
Abstract. The gas-particle partitioning and chemical aging of semi-volatile organic aerosol are presented in a newly de-veloped box model scheme, where its effect on the growth, composition, and mixing state of particles is examined. The volatility-basis set (VBS) framework is implemented into the aerosol microphysical scheme MATRIX (Multiconfiguration Aerosol TRacker of mIXing state), which resolves mass and number aerosol concentrations and in multiple mixing-state classes. The new scheme, MATRIX-VBS, has the poten-tial to significantly advance the representation of organic aerosols in Earth system models by improving upon the con-ventional representation as non-volatile particulate organic matter, often also with an assumed fixed size distribution. We present results from idealized cases representing Beijing, Mexico City, a Finnish forest, and a southeastern US for-est, and investigate the evolution of mass concentrations and volatility distributions for organic species across the gas and particle phases, as well as assessing their mixing state among aerosol populations. Emitted semi-volatile primary organic aerosols evaporate almost completely in the intermediate-volatility range, while they remain in the particle phase in the low-volatility range. Their volatility distribution at any point in time depends on the applied emission factors, oxidation by OH radicals, and temperature. We also compare against parallel simulations with the original scheme, which repre-sented only the particulate and non-volatile component of the organic aerosol, examining how differently the condensed-phase organic matter is distributed across the mixing states in the model. The results demonstrate the importance of repre-senting organic aerosol as a semi-volatile aerosol, and
explic-itly calculating the partitioning of organic species between the gas and particulate phases.
1 Introduction
Atmospheric aerosols play a key role in the Earth system with great impacts on global air quality, public health, and climate (Boucher et al., 2013; Myhre et al., 2013; Seinfeld and Pandis, 2016). One contribution to the large uncertainty in aerosol radiative forcing is organic aerosol (OA), which is ubiquitous in the atmosphere and contributes to a large por-tion of submicron particulate mass in various regions around the world (Zhang et al., 2007; Jimenez et al., 2009). Ad-vancements in measurement techniques greatly improved our understanding of the evolution of OA and its lifetime in the atmosphere at the process level (Jimenez et al., 2009). How-ever, OA processes in models still remain poorly constrained. Measurements imply that OA concentrations are potentially underestimated in current models (Tsigaridis et al., 2014). Such a discrepancy hints at large uncertainties in the predic-tion of aerosol–radiapredic-tion interacpredic-tions, their hygroscopicity, aerosol–cloud interactions, and their overall impact on cli-mate (Petters and Kreidenweis, 2007).
primary organic aerosol (POA) and including SOA from a wider set of precursors including intermediate-volatility or-ganic compounds (IVOCs). The volatility-basis set (VBS) was developed (Donahue et al., 2006) to provide a relatively simple framework whereby models can represent the over-all behavior of the myriad of compounds that constitute or-ganic aerosol and their precursors. The approach involves considering OA as being composed of a number of repre-sentative species, each with a particular volatility, spanning a spectrum in vapor pressures from highly volatile (which essentially remains in the gas phase) to very low vapor pres-sure species which partition readily into the particle phase. VBS then captures the chemical aging of the organic species in the gas phase, with the hydroxyl radical oxidizing them and producing the adjacent lower-volatility class as a prod-uct. This method has been used extensively in regional stud-ies (Robinson et al., 2007; Shrivastava et al., 2008; Murphy and Pandis, 2009; Tsimpidi et al., 2010, 2011; Hodzic et al., 2010; Fountoukis et al., 2011, 2014; Bergström et al., 2012; Athanasopoulou et al., 2013; Zhang et al., 2013) but less so in global models (Pye and Seinfeld, 2010; Jathar et al., 2011; Jo et al., 2013; Tsimpidi et al., 2014; Hodzic et al., 2016). Other studies have used the 2-D VBS (Donahue et al., 2011; Mur-phy et al., 2011), an approach that, in addition to the volatility space, also resolves that of chemical composition, by track-ing the amount of oxygenation in the representative organic compounds. However, the 2-D VBS is not implemented in global models, due to its large number of tracers and the large number of free parameters that are involved in the parameter-ization.
The inclusion of semi-volatile organics is important for accounting for the total mass of organics in the particulate phase, since an increase in particulate organic matter may not be the result of chemically produced low-volatility species, but simply be reflecting a temperature-driven increase in the partitioning of semi-volatile organic aerosol into the parti-cle phase. It has been established that the highly oxidized, very low volatility organics play a key role in particle forma-tion (Metzger et al., 2010; Paasonen et al., 2013; Riccobono et al., 2014; Kirkby et al., 2016) and particle growth (Tröstl et al., 2016), while the range of volatilities contributing to aerosol growth increases with aerosol size (Pierce et al., 2011; Yu, 2011). Semi-volatile organics also affect aerosol size and mixing state, as well as their impact on climate, due to changes in cloud condensation nuclei (CCN) formation rates (Petters et al., 2006, Riipenen et al., 2011; Scott et al., 2015), hygroscopicity (Petters and Kreidenweis, 2007), and optical properties (Myhre et al., 2013). Since OA emissions are on the rise from developing countries (Lamarque et al., 2010) and no Earth system model considers anthropogenic OA as semi-volatile as measurements suggest, it is important to include and constrain semi-volatile organics to ultimately reduce uncertainties in aerosol radiative forcing and make climate-model-simulated aerosol changes more realistic.
The objective of this study is to further develop an aerosol microphysics model by including a more advanced represen-tation of organic aerosol, including semi-volatile primary OA and an evolving OA volatility during chemical aging in the gas phase, in its calculations. This objective was achieved by implementing the VBS framework in the aerosol microphys-ical scheme MATRIX (Multiconfiguration Aerosol TRacker of mIXing state; Bauer et al., 2008), which represents ma-jor aerosol processes such as nucleation, condensation (ex-cluding organics in its original version), and coagulation, and explicitly tracks the mixing state of different aerosol pop-ulations. As many traditional chemistry–climate models do (Tsigaridis et al., 2014), MATRIX treats POA and SOA as non-volatile (Bauer et al., 2008). By coupling MATRIX with VBS, POA are treated as condensable semi-volatile organic compounds. These can partition among different aerosol populations based on their volatility and aerosol population size distribution, capturing particle growth via condensation of low-volatility organic vapors and thus providing a more physically based calculation of aerosol microphysics.
2 Model description
A box model is used for this study. The gas-phase chemical mechanism CBM-IV (Carbon Bond Mechanism IV; Gery et al., 1989), as used in the NASA GISS ModelE (Shindell et al., 2001, 2003), is coupled to the MATRIX aerosol micro-physics scheme, utilizing the Kinetic Pre-Processor (KPP; Sandu and Sander, 2006) to solve the differential equations of the gas-phase chemistry scheme. A time step of 30 min is used, for consistency with the global model.
2.1 MATRIX box model
MATRIX (Bauer et al., 2008) is an aerosol microphysi-cal model based on the quadrature method of moments (McGraw, 1997) in the NASA GISS ModelE Earth system model, which can be used either as a module within the global model or as a alone box model. Here, the stand-alone box model is used for development. The design of the code is such that the box-model code can be used as-is in the global model, without any changes, allowing for seamless transition and maximum portability. MATRIX is designed to resolve the aerosol temporal evolution and represent the mix-ing states of a user-selected set of aerosol populations, which are modes of different composition as listed in Table 2, track-ing two moments each, number and mass, while keeptrack-ing the width of the distribution fixed. It describes new particle for-mation, particle growth through condensation with explicit treatment of sulfuric acid condensation, and lumped treat-ment of the NH4–NO3–H2O system, as well as coagulation
Table 1.Naming convention and parameters used in the VBS implementation described here.
Parameter 9 Virtual VBS Species
C∗µg m−3at 298 K 10−2 10−1 100 101 102 103 104 105 106
Name of volatility bins M2 M1 M0 P1 P2 P3 P4 P5 P6
Mass-based emission factors
applied to POA emissions 0.03 0.06 0.09 0.14 0.18 0.30 0.40 0.50 0.80 (Shrivastava et al., 2008)
Enthalpy of vaporizationa 153 142 131 120 109 98 87 76 65
aEnthalpy of vaporization is calculated using Eq. (12) from Epstein et al. (2010).
Figure 1. Schematic showing coagulation pathways among organics-containing aerosol populations as colored circles, with nine organic VBS species condensed as grey outer circles. In yel-low are the emitted donor aerosol populations, and in green are the mixed recipient populations. OCC has a semi-transparent yellow core because it is actually emitted as the VBS species that can serve as condensation medium for gaseous VBS species, represented by the grey outer circles. In orange is population BC2, which contains a > 5 % coating of sulfate and organics, which is formed rapidly from the growth of population BC1, which has < 5 % sulfate and/or organics coating.
by nucleation or condensation of gas-phase components onto existing primary particles), or mixed (from any constituent, following condensation on primary aerosols or coagulation between primary, secondary, or mixed populations).
Black carbon is uniquely treated in MATRIX, in order to separate the coated (via condensation) from the mixed (via coagulation) populations. It is emitted in BC1, which can grow (blue arrow in Fig. 1) with inorganic and organic coat-ing, and as its coating volume fraction reaches 5 %, it would be moved in the BC2 population (see Table 2 for a descrip-tion), shown as the orange circle.
2.2 VBS framework
The volatility-basis set approach is introduced to the origi-nal model; it is an organic aerosol volatility parameterization that separates semi-volatile organic compounds into logarith-mically spaced bins of effective saturation concentrations, which are used for gas-particle partitioning and photochem-ical aging (Donahue et al., 2006). The scheme groups or-ganic compounds into nine surrogate VBS species accord-ing to their effective saturation concentrations (C∗) at 298 K, which are separated by factors of 10, ranging from 10−2to 106µg m−3. We classify organics as Murphy et al. (2014) does: low-volatility organics are in bins 10−2to 10−1µg m−3 (M2 and M1 in Table 1), semi-volatile organics are in bins 100to 102µg m−3(M0, P1, P2), and intermediate-volatility organics are in bins 103to 106µg m−3(P3, P4, P5, and P6). Low-volatility organics partition almost exclusively to the particulate phase, the semi-volatile species are present in both the gas and aerosol phase, and intermediate-volatility organics are the most volatile ones in the framework and re-main almost exclusively in the gas phase. Equilibrium parti-tioning is assumed for all volatility bins. Gas-phase organics can become chemically aged by the extremely reactive hy-droxyl radicals (qOH) during daytime with a rate constant of 10−11cm3s−1, and as they become more oxidized, their volatility decreases and they move down to the adjacent bin with a factor of 10 lower volatility (Donahue et al., 2006). Parameters and names used to represent them in this study are listed in Table 1.
Table 2.Aerosol population chemical composition in MATRIX.
Population Description Composition (constituents other
abbreviation than NH+4, NO−3, and H2O)
AKK sulfate (Aitken mode) SO24−
ACC sulfate (accumulation mode) SO24−
OCC organic carbon OC, SO24−
BC1 fresh black carbon (< 5 % coating) BC, SO24− BC2 aged (by condensation) black carbon
(> 5 % coating)
BC, SO24−
BCS aged (by coagulation) black carbon BC, SO24−
BOC black and organic carbon BC, OC, SO24−
OCS organic carbon and sulfate OC, SO24− SSA sea salt (accumulation mode) sea salt, SO24− SSC sea salt (coarse mode) sea salt, SO24− DD1 dust (accumulation mode; < 5 % coating) mineral dust, SO24− DD2 dust (coarse mode; < 5 % coating) mineral dust, SO24− DS1 dust (accumulation mode; > 5 % coating) mineral dust, SO24− DS2 dust (coarse mode; > 5 % coating) mineral dust, SO24−
MXX mixed (all components) BC,OC, mineral dust, sea salt, SO24−
Note: The sigma values for all populations are 1.80, except for AKK, which has a sigma of 1.60, and for SSC and MXX, which both have a sigma of 2.00.
3 Model development
In the original version of the MATRIX model, organics only contribute to particle growth and mix with other aerosol species via coagulation. Primary organic aerosols are emit-ted only as non-volatile particulate organic matter, and do not exist in the gas phase or interact with other aerosol pop-ulations. Implementing the VBS scheme adds these missing processes. Before this development, there were eight alter-native configurations of MATRIX available to the user, each representing a distinct set of aerosol populations whose num-ber, composition, and interactions by coagulation vary. A 9th configuration with 15 selected aerosol populations is created for this study (Table 2), in which 8 of the 16 populations, ACC, OCC, BC1, BC2, OCS, BOC, BCS, and MXX, could contain organics as semi-volatile VBS species. We only in-cluded semi-volatile organics in eight populations, so that we can examine the BC–OA–sulfate–nitrate system first, be-fore adding them into the nucleation population AKK and the dust and sea salt populations (DD1, DS1, DD2, DS2, SSA, SSC). Through coagulation, the 15 donor populations grow or mix and are placed into recipient populations, based on the donor population composition, as described in Bauer et al. (2008). In a future stage, organics will also be imple-mented in the AKK mode to present nanoparticle growth, and we will include an additional nucleation scheme that consid-ers the dependence of new particle formation that involve or-ganics (Kirkby et al., 2016; Tröstl et al., 2016).
Previously, each aerosol population carried up to five trac-ers – sulfate, black carbon, non-volatile organics, dust, and
sea salt. Now each of the eight organics-containing popula-tions carry nine additional semi-volatile VBS species listed in Table 1. Together with the 5 original tracers, we now have up to 14 available tracers per population, depending on whether they carry organic aerosols or not, with the original organics tracer (OCAR) representing the non-volatile bio-genic OA, as it did in the original mechanism. This newly coupled model MATRIX–VBS treats POA as semi-volatile gas-phase species, which then partition into and out of the particulate phase. The amount of gas-phase species parti-tioned onto each aerosol population is based on the surface area of that population, in addition to the mass of that popula-tion and the volatility of species, and equilibrium partipopula-tioning is assumed.
The semi-volatile nature of biogenic SOA is not repre-sented in the VBS framework in this work. Instead, biogenic SOA are treated as non-volatile, as in the original MATRIX version, and are produced with a 10 % constant yield from terpenes emissions without any requirement for oxidation be-fore the OA is formed (Lathière et al., 2005; Tsigaridis et al., 2014). The inclusion of semi-volatile biogenic SOA will be parameterized in the same way as in the VBS framework pre-sented here in the future.
4 Simulations
an-Table 3.Conditions of each location used in the simulations, taken from the GISS ModelE for January and July 2006.
January 2006 Units Beijing Centreville Hyytiälä Mexico City
Fixed parameters
Temperature K 270 279 260 283
Pressure hPa 1007 996 1009 797
RH % 46.8 77.7 79.5 62.5
Gaseous emissions NOx
pptv h−1
216.5 92.4 169.7 148.7
CO 6943.3 1199.3 557.3 2308.4
Alkenes 4.3 0.3 0.1 1.3
Paraffin 8.2 2.1 0.6 10.5
Terpenes 1.8 26.3 9.4 25.8
Isoprene 1.3 23.8 0.0 0.0
SO2 555.8 191.7 24.1 538.7
NH3 181.3 24.2 50.7 63.3
Aerosol emissions
Sulfate
µg m−3h−1
0.06 0.02 0.003 0.05
Black carbon 0.09 0.01 0.008 0.03
Organics* 0.19 0.03 0.02 0.11
July 2006 Units Beijing Centreville Hyytiälä Mexico City
Fixed parameters
Temperature K 304 303 292 289
Pressure hPa 986 995 998 800
RH % 59.8 61.8 77.8 83.1
Gaseous emissions NOx
pptv h−1
281.3 124.3 200.9 165.3
CO 8111.9 1749.9 630.5 2276.1
Alkenes 5.0 0.5 0.1 1.3
Paraffin 9.6 2.7 0.7 10.7
Terpenes 36.9 145.4 87.6 44.9
Isoprene 916.1 795.5 47.2 0.0
SO2 653.7 206.5 26.8 549.5
NH3 211.7 38.7 58.1 63.3
Aerosol emissions
Sulfate
µg m−3h−1
0.06 0.02 0.002 0.05
Black carbon 0.10 0.01 0.01 0.03
Organics* 0.21 0.03 0.07 0.11
* The new scheme’s organics emissions are 2.5 times higher than the organics emissions in the original scheme
other cleaner yet still very polluted city at high altitude and closer to the tropics (Mexico City), a very clean Finnish for-est (Hyytiälä), and an anthropogenically affected forfor-est in the southeast USA (Centreville, Alabama). The experiments are performed for a winter month (January) and a summer month (July) for 10 days, and initial conditions and emission rates for each location were extracted from a GISS ModelE sim-ulation (similar setup as described in Mezuman et al., 2016) for the year 2006, listed in Table 3. All parameters and emis-sions are held constant throughout the simulations. Here we do not include deposition and dilution, for simpler mass-balance calculations. Semi-volatile POA, sulfate in the accu-mulation mode, and black carbon are emitted continuously in the OCC, ACC, and BC1 populations, respectively, shown in Fig. 1 as yellow circles. Condensation of VBS species on BC1 can increase the non-absorbing shell of that population, leading to the formation of BC2, as described above.
The four organics-containing populations described above can coagulate (black arrows in Fig. 1) with themselves and each other and form three additional organics-containing mixed populations, BOC, OCS, and BCS, shown as green circles. This schematic includes seven of the eight organics-containing populations in the model.
5 Results and discussion
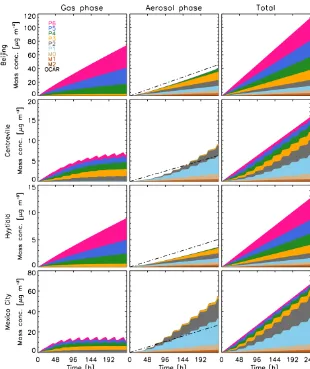
Figure 2.Temporal evolution of the mass concentration of semi-volatile organics in the gas phase (left column), aerosol phase (across all populations; middle column) and total (right column) using the new scheme (refer to Table 1 for legend) for January. The total of non-volatile organics from the original scheme (OCAR) is shown in black dash-dotted lines in the aerosol phase column (middle). OCAR from the old scheme is exactly 2.5 times smaller from the total organic species in the new scheme.
and 3) to the most volatile 106µg m−3(“P6” in Figs. 2 and 3). They are distributed between the gas and aerosol phases by gas-particle partitioning, whereas the organics in the origi-nal scheme are only represented by one nonvolatile organic aerosol tracer (“OCAR”).
As mentioned in the model description, the emission rates for organics in each of the volatility bins in the new scheme were derived from the Shrivastava et al. (2008) mass-based emission factors. Consequently, since there is no deposition and dilution in the simulations, the new scheme’s organics to-tal mass concentrations (shown in color in the right columns of Figs. 2 and 3) always adds up to 2.5 times that of the old scheme (shown as dash-dotted lines) throughout the simula-tions in both January and July.
5.1 Winter
Figure 3.Same as Fig. 2, for July.
range partition between the gas and aerosol phases, and those in the low-volatility range are in the aerosol phase in January. This is especially true for Beijing and Hyytiälä, where the volatility distributions are very similar (in relative terms) and where the total concentration of gas-phase species is higher than the sum of all aerosol-phase species. In Centreville, the total amount of gas-phase species is approximately the same as that of the aerosol-phase species, whereas in Mexico City there are more species in the aerosol phase than in the gas phase. In Centreville and Mexico City, the species show a diurnal variability, which will be explained later.
Aging can help explain the similar volatility distributions in Beijing and Hyytiälä. The qOH concentration in both locations are low in January: Beijing’s mean qOH is ap-proximately 105molecules cm−3 and Hyytiälä’s mean qOH is approximately 104molecules cm−3. Low qOH concen-trations limit the aging of intermediate-volatility organics and their ability to move to the lower-volatility bins; thus the volatility distributions do not change drastically, some-thing that is also evident by the lack of a daily cycle. On
the other hand, much higher mean qOH concentrations in Centreville (2×10⁶molecules cm−3)and Mexico City (5× 10⁶molecules cm−3) provide more oxidation power,
mak-ing oxidation a significant pathway in aerosol evolution. The higher mean qOH concentrations also explain the diurnal variability of both gas-phase and aerosol-phase mass concen-trations that we see in the two locations, because qOH is only produced during daytime and has very low concentrations during the night. Since Mexico City has slightly higher qOH concentration than Centreville, its total gas-phase concen-tration reaches a dynamic equilibrium after approximately 4 days, whereas Centreville’s total gas phase continues to rise, approaching equilibrium at a slower pace.
are very similar to the emission factor distribution among the volatility, with factor differences of less than 0.1. This be-havior is, again, a result of the low qOH concentrations in the two locations, and the low oxidation rate that limits the change in volatility distribution. Volatility is also temperature dependent, which is also relevant to the total aerosols present. In Beijing, we would expect higher gas-phase concentration due to the higher temperatures. However, the larger amount of aerosols moves the partitioning point towards the aerosol phase, which offsets the temperature difference in the colder Hyytiälä case, and gives us similar results.
On the other hand, the volatility distributions in Centre-ville and Mexico City are very different from the applied emission factor distribution, except for the two bins in the low-volatility range, M2 and M1. Due to the high concentra-tions of qOH, both sites have low gas-phase organics concen-trations because the intermediate-volatility gases are more efficiently oxidized and their less volatile products partition into the aerosol phase. Therefore, the relative amount of or-ganics from the intermediate-volatility range no longer re-sembles the applied emission factors. The organics in the intermediate-volatility range from P6 to P3 are totaling fac-tors of approximately 0.38 and 0.15 in Centreville and Mex-ico City, respectively, which are in sharp contrast to the fac-tors of 0.4, 0.5, and 0.8 applied to each of the respective bins.
5.2 Summer
The total mass concentration of organics in Beijing and Mex-ico City at the end of 10 days in July are approximately 130 and 67 µg m−3, respectively, very similar to the amounts in
January. However, Centreville and Hyytiälä have higher con-centrations of organics than they did in January, with 90 and 43 µg m−3, respectively. The volatility distributions for the four locations in July (Fig. 3) are also very different from that of January. Organics are all very low in the intermediate-volatility and semi-volatile ranges, and they are all high in the low-volatility ranges, with less than 10 % of the total or-ganics in the gas phase in all four locations. This behavior means that at all locations, oxidation is very strong, stronger than any place during January. This sharp change in behavior is caused by the difference in qOH concentrations during the 2 months. July’s concentrations are much higher than those in January because qOH production is increased due to in-creased photolysis in the summer. The mean qOH concen-tration is approximately 1.5×10⁷molecules cm−3in Beijing
and Hyytiälä, and it is approximately 1×10⁷molecules cm−3
in Centreville and 2×10⁷molecules cm−3 in Mexico City. More qOH leads to faster oxidation of the gas-phase organ-ics and the consequent partitioning of the less-volatile oxida-tion products into the aerosol phase. This is evident in Fig. 3, where the gas-phase concentrations in all four locations are very low. In all cases, dynamic equilibrium was reached after just 2 days. They also exhibit a strong diurnal variability, as
Figure 4.Temporal evolution of organic aerosol mass concentration in each organics-containing population from the new scheme (first column for January, third column for July), and the old scheme (sec-ond column for January, fourth column for July).
expected from the fast qOH oxidation, which decreases with decreasing volatility.
5.3 Mixing state
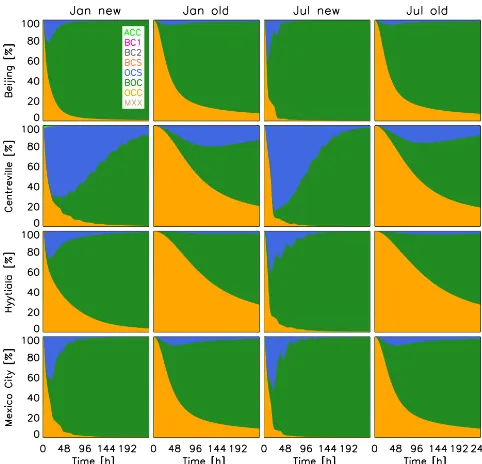
Figure 5.Temporal evolution of organic aerosol mass concentra-tion fracconcentra-tion in each organics-containing populaconcentra-tion from the new scheme (first column for January, third column for July), and the old scheme (second column for January, fourth column for July).
in both schemes, and in the new scheme, aerosol-phase or-ganics in the OCC population could either coagulate with the ACC population to form OCS, or they could coagulate with the BC1 population to form BOC. This competition de-termines how much OCS and BOC are formed, and it af-fects how much gas-phase organics from the OCC population could condense on the two populations and the distribution of organics among the populations. Since partitioning adds a loss mechanism to OCC, part of the evaporated mass will go to BOC, making it larger, and a more efficient scavenger of other particles. As a result, most organics coagulate with and condense on the BOC population and/or the OCS population, and together with the emitted OCC population, hold the most organics and dominate the mass fractions.
There is some similarity between the January and July re-sults between the new and the old schemes (Fig. 5). This sim-ilarity means that the distribution of organics among aerosol populations is not significantly affected by season. This is consistent with a study by Bauer et al. (2013), where they found that the mixing-state distribution is rather a character-istic of a region and not so much of a season, although the total (absolute) amounts by season may vary. By the end of the simulations, most locations have more organics present in the BOC population, except those in Centreville. The reason for this is sulfate; from the sulfate and black carbon emis-sions listed in Table 3, we can calculate the sulfate-to-black-carbon ratio in Centreville to be 2:1, higher than the corre-sponding ratios in all other locations. This high ratio helps the ACC population to survive the competition against BC1
for coagulation with OCC. This leads to higher OCS forma-tion, which is available for gas-phase organics to condense on; thus coagulation and condensation both bring more or-ganics in the OCS population during the first half of the sim-ulation. These results show that the sulfate-to-black-carbon ratio is important for the mixing state by delaying the in-evitable BOC domination. Also, comparing the distribution fraction in Fig. 5, volatile organics create rather different mixing states as those created by coagulation alone in the original scheme, meaning that the semi-volatility did alter the mixing state significantly.
5.4 Size distribution
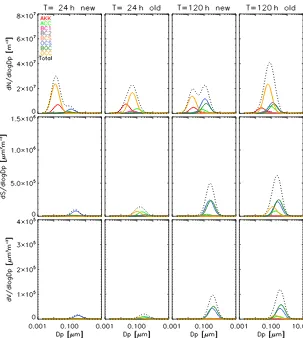
Another important factor on the evolution of aerosols is their size distribution. Shown in Figs. 6 and 7 are the January size distributions from Mexico City and Centreville, respectively. The first row shows number concentration, the second row surface area, and the third row volume. The first two columns are results from the new and old schemes after 24 h of sim-ulation, and the right two columns are after 120 h. The to-tal number concentration, surface area, and volume from the eight populations are shown as dotted lines. Note also that these plots show the total aerosol size distribution per popu-lation, which includes the contribution of species other than organics.
The size distributions in July are very similar to January in all locations, and therefore only January is shown here. Beijing, Hyytiälä, and Mexico City exhibit somewhat similar size distributions (with different absolute amounts), just as their mass fractions do. The size distribution is dominated by OCC, OCS, and BOC in the first 3 to 4 days, but later only by BOC. On the other hand, Centreville, similar to its mixing state, is different in its size distribution of different aerosol populations from the other three locations. Therefore, only the size distributions of Mexico City and Centreville are shown here.
In the new scheme for Mexico City after 24 h of simula-tion, the number concentration has two modes. OCC has even smaller size than Aitken mode sulfate AKK does, as a result of the evaporation of organics, but its number concentration is higher. OCS and BOC have started to form from coagula-tion of OCC with ACC and BC1, and their diameter, num-ber concentration, surface area, and volume are very similar, almost overlapping, with BOC slightly smaller in diameter. After 120 h of simulation, OCC’s number concentration has decreased significantly, from 4×10⁷ to 1×10⁷m−3. This
vol-Figure 6.Organics-containing aerosol populations (except MXX) and AKK (Aitken mode sulfate) size distributions for Mexico City in January. Top row: number concentration. Middle row: surface area. Bottom row: volume. Total of all populations in dotted black lines.
ume grew from approximately 2×10⁴to 2×105µm3m−3.
BOC’s growing large surface area is another reason why it has so many organics and dominates the mass concentra-tion: the greater the surface area, the more gas-phase species are able to condense. This matches the mixing-state results (Fig. 5), where we saw after 24 h that ACC, OCC, and BOC have high mass fractions, whereas after 120 h OCC and OCS are negligible, and more than 90 % of the total organic aerosol mass is in the BOC population.
In the old scheme, after 24 h OCC has higher number concentration (peaking at 5×10⁷m−3)and size than in the new scheme, and higher surface area and volume, due to its greater number and diameter. OCS and BOC are both fewer in number (peaks are 1×10⁷and 1.5×10⁷m−3lower in the old scheme) but slightly greater in diameter than they are in the new scheme. Later, after 120 h, OCC number concen-tration maximum decreases to 3.5×10⁷m−3, due to coag-ulation with ACC and BC1 to form more OCS and BOC. Therefore, OCS and BOC increased in number and size, with BOC seeing greater growth (the peak of number concentra-tion increased from 7×10⁶ to 2.3×10⁷m−3, the peak of surface area increased from 1.5×10⁵to 1.1×106µm2m−3
and the peak of volume increased from 3×104µm3m−3to
3.1×105µm2m−3). For OCS we calculated more modest in-creases of approximately 50 % in number, surface area, and volume concentration peaks: the number concentration from 4×10⁶to 7×10⁶m−3, surface area from 1×10⁵to 1.5× 105µm2m−3and volume from 2×10⁴to 4×104µm3m−3, as seen in the new scheme as well. However, BOC’s growth in the old scheme is even greater than that in the new scheme. This slightly accelerated growth slows down at later hours (not shown), because BOC dominates faster in the new scheme than in the old one (Fig. 4).
The Centreville size distributions tell a different story. In the early stages of the new scheme, OCS has greater number concentration and size than BOC does; OCS’s peak num-ber concentration is 0.5×10⁷m−3, more than double than
Figure 7.Same as Fig. 6 for Centreville.
to 120 h as it does in Mexico City, but its number increases from 1.7×10⁷to 2.5×10⁷m−3. This means that in that pe-riod of time coagulation, loss is less than the amount of OCC emitted, which is what was also seen earlier for the mass con-centrations (Fig. 2). At 120 h, OCS has again higher number concentration than BOC does, but only slightly (peak num-ber concentration difference is approximately 1×10⁶m−3) and not as much as in the case of Mexico City, and the latter’s surface area and volume continue to be greater than those of the former due to its increasing diameter.
6 Conclusions
Organic aerosol volatility calculations were implemented into a new aerosol microphysics scheme, MATRIX-VBS. Results from idealized cases in Beijing, Centreville, Hyytiälä, and Mexico City during summer and winter using the new scheme were compared against the original scheme and showed how the inclusion of semi-volatility of organics and their reactivity affected aerosol mass concentration, as well as their mixing state and size distribution. Emission fac-tors, qOH oxidation, temperature, and total aerosol levels are the key factors determining organics’ volatility distribution
and mass concentration. The mixing state is affected by par-ticle size and concentration, which determines coagulation and condensation pathways. Results from the new scheme showed different mixing-state distribution from the original scheme.
7 Code availability
This model development is part of GISS ModelE Earth sys-tem model, which is publicly available. In addition, the box model used here is available on request.
Competing interests. The authors declare that they have no conflict of interest.
Acknowledgements. We thank the NASA Modeling, Analysis, and Prediction program, which supports the GISS ModelE develop-ment.
Edited by: G. Mann
Reviewed by: three anonymous referees
References
Athanasopoulou, E., Vogel, H., Vogel, B., Tsimpidi, A. P., Pandis, S. N., Knote, C., and Fountoukis, C.: Modeling the meteoro-logical and chemical effects of secondary organic aerosols dur-ing an EUCAARI campaign, Atmos. Chem. Phys., 13, 625–645, doi:10.5194/acp-13-625-2013, 2013.
Bauer, S. E., Wright, D. L., Koch, D., Lewis, E. R., Mc-Graw, R., Chang, L.-S., Schwartz, S. E., and Ruedy, R.: MA-TRIX (Multiconfiguration Aerosol TRacker of mIXing state): an aerosol microphysical module for global atmospheric models, Atmos. Chem. Phys., 8, 6003–6035, doi:10.5194/acp-8-6003-2008, 2008.
Bauer, S. E., Ault, A., and Prather, K. A.: Evaluation of aerosol mix-ing state classes in the GISS modelE-MATRIX climate model using single-particle mass spectrometry measurements, J. Geo-phys. Res.-Atmos., 118, 9834–9844, doi:10.1002/jgrd.50700, 2013.
Bergström, R., Denier van der Gon, H. A. C., Prévôt, A. S. H., Yttri, K. E., and Simpson, D.: Modelling of organic aerosols over Eu-rope (2002–2007) using a volatility basis set (VBS) framework: application of different assumptions regarding the formation of secondary organic aerosol, Atmos. Chem. Phys., 12, 8499–8527, doi:10.5194/acp-12-8499-2012, 2012.
Boucher, O., Randall, D., Artaxo, P., Bretherton, C., Feingold, G., Forster, P., Kerminen, V.-M., Kondo, Y., Liao, H., Lohmann, U., Rasch, P., Satheesh, S. K., Sherwood, S., Stevens, B., and Zhang, X. Y.: Clouds and Aerosols, in: Climate Change 2013: The Physical Science Basis. Contribution of Working Group I to the Fifth Assessment Report of the Intergovernmental Panel on Climate Change, edited by: Stocker, T. F., Qin, D., Plat-tner, G.-K., Tignor, M., Allen, S. K., Boschung, J., Nauels, A., Xia, Y., Bex, V., and Midgley, P. M., Cambridge University Press, Cambridge, UK and New York, NY, USA, 571–657 pp., doi:10.1017/CBO9781107415324, 2013.
Donahue, N. M., Robinson, A. L., Stanier, C. O., and Pandis, S. N.: Coupled partitioning, dilution, and chemical aging of semivolatile organics, Environ. Sci. Technol., 40, 2635–2643, doi:10.1021/es052297c, 2006.
Donahue, N. M., Epstein, S. A., Pandis, S. N., and Robinson, A. L.: A two-dimensional volatility basis set: 1. organic-aerosol mixing thermodynamics, Atmos. Chem. Phys., 11, 3303–3318, doi:10.5194/acp-11-3303-2011, 2011.
Epstein, S. A., Riipinen, I., and Donahue, N. M.: A Semi-Empirical Correlation between Enthalpy of Vaporization and Saturation Concentration for Organic Aerosol, Environ. Sci. Technol., 44, 743–748, doi:10.1021/es902497z, 2010.
Fountoukis, C., Racherla, P. N., Denier van der Gon, H. A. C., Polymeneas, P., Charalampidis, P. E., Pilinis, C., Wiedensohler, A., Dall’Osto, M., O’Dowd, C., and Pandis, S. N.: Evaluation of a three-dimensional chemical transport model (PMCAMx) in the European domain during the EUCAARI May 2008 cam-paign, Atmos. Chem. Phys., 11, 10331–10347, doi:10.5194/acp-11-10331-2011, 2011.
Fountoukis, C., Megaritis, A. G., Skyllakou, K., Charalampidis, P. E., Pilinis, C., Denier van der Gon, H. A. C., Crippa, M., Canonaco, F., Mohr, C., Prévôt, A. S. H., Allan, J. D., Poulain, L., Petäjä, T., Tiitta, P., Carbone, S., Kiendler-Scharr, A., Nemitz, E., O’Dowd, C., Swietlicki, E., and Pandis, S. N.: Organic aerosol concentration and composition over Europe: insights from com-parison of regional model predictions with aerosol mass spec-trometer factor analysis, Atmos. Chem. Phys., 14, 9061–9076, doi:10.5194/acp-14-9061-2014, 2014.
Gery, M. W., Whitten, G. Z., Killus, J. P., and Dodge, M. C.: A photochemical kinetics mechanism for urban and regional scale computer modeling, J. Geophys. Res., 94, 12925–12956, doi:10.1029/JD094iD10p12925, 1989.
Heald, C. L., Jacob, D. J., Park, R. J., Russell, L. M., Huebert, B. J., Seinfeld, J. H., Liao, H., and Weber, R. J.: A large organic aerosol source in the free troposphere missing from current mod-els, Geophys. Res. Lett., 32, 1–4, doi:10.1029/2005GL023831, 2005.
Hodzic, A., Jimenez, J. L., Madronich, S., Canagaratna, M. R., De-Carlo, P. F., Kleinman, L., and Fast, J.: Modeling organic aerosols in a megacity: potential contribution of semi-volatile and inter-mediate volatility primary organic compounds to secondary or-ganic aerosol formation, Atmos. Chem. Phys., 10, 5491–5514, doi:10.5194/acp-10-5491-2010, 2010.
Hodzic, A., Kasibhatla, P. S., Jo, D. S., Cappa, C. D., Jimenez, J. L., Madronich, S., and Park, R. J.: Rethinking the global sec-ondary organic aerosol (SOA) budget: stronger production, faster removal, shorter lifetime, Atmos. Chem. Phys., 16, 7917–7941, doi:10.5194/acp-16-7917-2016, 2016.
Jathar, S. H., Farina, S. C., Robinson, A. L., and Adams, P. J.: The influence of semi-volatile and reactive primary emissions on the abundance and properties of global organic aerosol, At-mos. Chem. Phys., 11, 7727–7746, doi:10.5194/acp-11-7727-2011, 2011.
Salcedo, D., Cottrell, L., Griffin, R., Takami, A., Miyoshi, T., Hatakeyama, S., Shimono, A., Sun, J. Y., Zhang, Y. M., Dzepina, K., Kimmel, J. R., Sueper, D., Jayne, J. T., Herndon, S. C., Trim-born, A. M., Williams, L. R., Wood, E. C., Middlebrook, A. M., Kolb, C. E., Baltensperger, U., and Worsnop, D. R.: Evolution of organic aerosols in the atmosphere, Science, 326, 1525–1529, doi:10.1126/science.1180353, 2009.
Jo, D. S., Park, R. J., Kim, M. J., and Spracklen, D. V.: Effects of chemical aging on global secondary organic aerosol using the volatility basis set approach, Atmos. Environ., 81, 230–244, 2013.
Kirkby, J., Duplissy, J., Sengupta, K., Frege, C., Gordon, H., Williamson, C., Heinritzi, M., Simon, M., Yan, C., and Almeida, J.: Ion-induced nucleation of pure biogenic particles, Nature, 533, 521–526, doi:10.1038/nature17953, 2016.
Lamarque, J.-F., Bond, T. C., Eyring, V., Granier, C., Heil, A., Klimont, Z., Lee, D., Liousse, C., Mieville, A., Owen, B., Schultz, M. G., Shindell, D., Smith, S. J., Stehfest, E., Van Aar-denne, J., Cooper, O. R., Kainuma, M., Mahowald, N., Mc-Connell, J. R., Naik, V., Riahi, K., and van Vuuren, D. P.: His-torical (1850–2000) gridded anthropogenic and biomass burning emissions of reactive gases and aerosols: methodology and ap-plication, Atmos. Chem. Phys., 10, 7017–7039, doi:10.5194/acp-10-7017-2010, 2010.
Lathière, J., Hauglustaine, D. A., De Noblet-Ducoudré, N., Krin-ner, G., and Folberth, G. A.: Past and future changes in biogenic volatile organic compound emissions simulated with a global dynamic vegetation model, Geophys. Res. Lett., 32, L20818, doi:10.1029/2005GL024164, 2005.
McGraw, R.: Description of Aerosol Dynamics by the Quadra-ture Method of Moments, Aerosol Sci. Tech., 27, 255–265, doi:10.1080/02786829708965471, 1997.
Metzger, A., Verheggen, B., Dommen, J., Duplissy, J., Prevot, A. S. H., Weingartner, E., Riipinen, I., Kulmala, M., Spracklen, D. V., Carslaw, K. S., and Baltensperger, U.: Evidence for the role of organics in aerosol particle formation under atmo-spheric conditions, P. Natl. Acad. Sci. USA, 107, 6646–6651, doi:10.1073/pnas.0911330107, 2010.
Mezuman, K., Bauer, S. E., and Tsigaridis, K.: Evaluating sec-ondary inorganic aerosols in three dimensions, Atmos. Chem. Phys., 16, 10651–10669, doi:10.5194/acp-16-10651-2016, 2016. Murphy, B. N. and Pandis, S. N.: Simulating the formation of semivolatile primary and secondary organic aerosol in a regional chemical transport model, Environ. Sci. Technol., 43, 4722– 4728, doi:10.1021/es803168a, 2009.
Murphy, B. N., Donahue, N. M., Fountoukis, C., and Pandis, S. N.: Simulating the oxygen content of ambient organic aerosol with the 2D volatility basis set, Atmos. Chem. Phys., 11, 7859–7873, doi:10.5194/acp-11-7859-2011, 2011.
Murphy, B. N., Donahue, N. M., Robinson, A. L., and Pandis, S. N.: A naming convention for atmospheric organic aerosol, At-mos. Chem. Phys., 14, 5825–5839, doi:10.5194/acp-14-5825-2014, 2014.
Myhre, G., Shindell, D., Bréon, F.-M., Collins, W., Fuglestvedt, J., Huang, J., Koch, D., Lamarque, J.-F., Lee, D., Mendoza, B., Nakajima, T., Robock, A., Stephens, G., Takemura T., and Zhang, H.: Anthropogenic and Natural Radiative Forcing, in: Climate Change 2013: The Physical Science Basis. Contribution of Working Group I to the Fifth Assessment Report of the
Inter-governmental Panel on Climate Change, edited by: Stocker, T. F., Qin, D., Plattner, G.-K., Tignor, M., Allen, S. K., Boschung, J., Nauels, A., Xia, Y., Bex, V., and Midgley, P. M., Cambridge University Press, Cambridge, UK and New York, NY, USA, 659– 740, doi:10.1017/CBO9781107415324, 2013.
Paasonen, P., Asmi, A., Petäjä, T., Kajos, M. K., Äijälä, M., Junni-nen, H., Holst, T., Abbatt, J. P. D., Arneth, A., Birmili, W., van der Gon, H. D., Hamed, A., Hoffer, A., Laakso, L., Laaksonen, A., Richard Leaitch, W., Plass-Dülmer, C., Pryor, S. C., Räisä-nen, P., Swietlicki, E., Wiedensohler, A., Worsnop, D. R., Ker-minen, V.-M., and Kulmala, M.: Warming-induced increase in aerosol number concentration likely to moderate climate change, Nat. Geosci., 6, 438–442, doi:10.1038/ngeo1800, 2013. Petters, M. D. and Kreidenweis, S. M.: A single parameter
repre-sentation of hygroscopic growth and cloud condensation nucleus activity, Atmos. Chem. Phys., 7, 1961–1971, doi:10.5194/acp-7-1961-2007, 2007.
Petters, M. D., Prenni, A. J., Kreidenweis, S. M., DeMott, P. J., Matsunaga, A., Lim, Y. B., and Ziemann, P. J.: Chemical aging and the hydrophobic-hydrophilic conversion of carbonaceous aerosol, Geophys. Res. Lett., 33, L24806, doi:10.1029/2006GL027249, 2006.
Pierce, J. R., Riipinen, I., Kulmala, M., Ehn, M., Petäjä, T., Junni-nen, H., Worsnop, D. R., and Donahue, N. M.: Quantification of the volatility of secondary organic compounds in ultrafine par-ticles during nucleation events, Atmos. Chem. Phys., 11, 9019– 9036, doi:10.5194/acp-11-9019-2011, 2011.
Pye, H. O. T. and Seinfeld, J. H.: A global perspective on aerosol from low-volatility organic compounds, Atmos. Chem. Phys., 10, 4377–4401, doi:10.5194/acp-10-4377-2010, 2010.
Riccobono, F., Schobesberger, S., Scott, C. E., Dommen, J., Ortega, I. K., Rondo, L., Almeida, J., Amorim, A., Bianchi, F., Breiten-lechner, M., David, A., Downard, A., Dunne, E. M., Duplissy, J., Ehrhart, S., Flagan, R. C., Franchin, A., Hansel, A., Junni-nen, H., Kajos, M., KeskiJunni-nen, H., Kupc, A., Kürten, A., Kvashin, A. N., Laaksonen, A., Lehtipalo, K., Makhmutov, V., Mathot, S., Nieminen, T., Onnela, A., Petäjä, T., Praplan, A. P., Santos, F. D., Schallhart, S., Seinfeld, J. H., Sipilä, M., Spracklen, D. V., Stozhkov, Y., Stratmann, F., Tomé, A., Tsagkogeorgas, G., Vaattovaara, P., Viisanen, Y., Vrtala, A., Wagner, P. E., Weingart-ner, E., Wex, H., Wimmer, D., Carslaw, K. S., Curtius, J., Don-ahue, N. M., Kirkby, J., Kulmala, M., Worsnop, D. R., and Bal-tensperger, U.: Oxidation products of biogenic emissions con-tribute to nucleation of atmospheric particles, Science, 344, 717– 721, 2014.
Riipinen, I., Pierce, J. R., Yli-Juuti, T., Nieminen, T., Häkkinen, S., Ehn, M., Junninen, H., Lehtipalo, K., Petäjä, T., Slowik, J., Chang, R., Shantz, N. C., Abbatt, J., Leaitch, W. R., Kerminen, V.-M., Worsnop, D. R., Pandis, S. N., Donahue, N. M., and Kul-mala, M.: Organic condensation: a vital link connecting aerosol formation to cloud condensation nuclei (CCN) concentrations, Atmos. Chem. Phys., 11, 3865–3878, doi:10.5194/acp-11-3865-2011, 2011.
Sandu, A. and Sander, R.: Technical note: Simulating chemical systems in Fortran90 and Matlab with the Kinetic PreProcessor KPP-2.1, Atmos. Chem. Phys., 6, 187–195, doi:10.5194/acp-6-187-2006, 2006.
Scott, C. E., Spracklen, D. V., Pierce, J. R., Riipinen, I., D’Andrea, S. D., Rap, A., Carslaw, K. S., Forster, P. M., Artaxo, P., Kulmala, M., Rizzo, L. V., Swietlicki, E., Mann, G. W., and Pringle, K. J.: Impact of gas-to-particle partitioning approaches on the sim-ulated radiative effects of biogenic secondary organic aerosol, Atmos. Chem. Phys., 15, 12989–13001, doi:10.5194/acp-15-12989-2015, 2015.
Seinfeld, J. H. and Pandis, S. N.: Atmospheric Chemistry and Physics: From Air Pollution to Climate Change, third edition, John Wiley & Sons Inc., Hoboken, New Jersey, 2016.
Shindell, D. T., Grenfell, J. L., Rind, D., Grewe, V., and Price, C.: Chemistry-climate interactions in the Goddard Institute for Space Studies general circulation model: 1. Tropospheric chem-istry model description and evaluation, J. Geophys. Res., 106, 8047, doi:10.1029/2000JD900704, 2001.
Shindell, D. T., Faluvegi, G., and Bell, N.: Preindustrial-to-present-day radiative forcing by tropospheric ozone from improved sim-ulations with the GISS chemistry-climate GCM, Atmos. Chem. Phys., 3, 1675–1702, doi:10.5194/acp-3-1675-2003, 2003. Shrivastava, M. K., Lane, T. E., Donahue, N. M., Pandis, S.
N., and Robinson, A. L.: Effects of gas particle partitioning and aging of primary emissions on urban and regional organic aerosol concentrations, J. Geophys. Res.-Atmos., 113, D18301, doi:10.1029/2007JD009735, 2008.
Spracklen, D. V., Jimenez, J. L., Carslaw, K. S., Worsnop, D. R., Evans, M. J., Mann, G. W., Zhang, Q., Canagaratna, M. R., Allan, J., Coe, H., McFiggans, G., Rap, A., and Forster, P.: Aerosol mass spectrometer constraint on the global secondary organic aerosol budget, Atmos. Chem. Phys., 11, 12109–12136, doi:10.5194/acp-11-12109-2011, 2011.
Tröstl, J., Chuang, W., Gordon, H., Heinritzi, M., Yan, C., Molteni, U., Ahlm, L., Frege, C., Bianchi, F., and Wagner, R.: The role of low-volatility organic compounds in initial particle growth in the atmosphere, Nature, 533, 527–531, doi:10.1038/nature18271, 2016.
Tsigaridis, K., Daskalakis, N., Kanakidou, M., Adams, P. J., Ar-taxo, P., Bahadur, R., Balkanski, Y., Bauer, S. E., Bellouin, N., Benedetti, A., Bergman, T., Berntsen, T. K., Beukes, J. P., Bian, H., Carslaw, K. S., Chin, M., Curci, G., Diehl, T., Easter, R. C., Ghan, S. J., Gong, S. L., Hodzic, A., Hoyle, C. R., Iversen, T., Jathar, S., Jimenez, J. L., Kaiser, J. W., Kirkevåg, A., Koch, D., Kokkola, H., Lee, Y. H., Lin, G., Liu, X., Luo, G., Ma, X., Mann, G. W., Mihalopoulos, N., Morcrette, J.-J., Müller, J.-F., Myhre, G., Myriokefalitakis, S., Ng, N. L., O’Donnell, D., Pen-ner, J. E., Pozzoli, L., Pringle, K. J., Russell, L. M., Schulz, M., Sciare, J., Seland, Ø., Shindell, D. T., Sillman, S., Skeie, R. B., Spracklen, D., Stavrakou, T., Steenrod, S. D., Takemura, T., Ti-itta, P., Tilmes, S., Tost, H., van Noije, T., van Zyl, P. G., von Salzen, K., Yu, F., Wang, Z., Wang, Z., Zaveri, R. A., Zhang, H., Zhang, K., Zhang, Q., and Zhang, X.: The AeroCom eval-uation and intercomparison of organic aerosol in global mod-els, Atmos. Chem. Phys., 14, 10845–10895, doi:10.5194/acp-14-10845-2014, 2014.
Tsimpidi, A. P., Karydis, V. A., Zavala, M., Lei, W., Molina, L., Ulbrich, I. M., Jimenez, J. L., and Pandis, S. N.: Evaluation of the volatility basis-set approach for the simulation of organic aerosol formation in the Mexico City metropolitan area, Atmos. Chem. Phys., 10, 525–546, doi:10.5194/acp-10-525-2010, 2010. Tsimpidi, A. P., Karydis, V. A., Zavala, M., Lei, W., Bei, N., Molina,
L., and Pandis, S. N.: Sources and production of organic aerosol in Mexico City: insights from the combination of a chemical transport model (PMCAMx-2008) and measurements during MI-LAGRO, Atmos. Chem. Phys., 11, 5153–5168, doi:10.5194/acp-11-5153-2011, 2011.
Tsimpidi, A. P., Karydis, V. A., Pozzer, A., Pandis, S. N., and Lelieveld, J.: ORACLE (v1.0): module to simulate the or-ganic aerosol composition and evolution in the atmosphere, Geosci. Model Dev., 7, 3153–3172, doi:10.5194/gmd-7-3153-2014, 2014.
Volkamer, R., Jimenez, J. L., San Martini, F., Dzepina, K., Zhang, Q., Salcedo, D., Molina, L. T., Worsnop, D. R., and Molina, M. J.: Secondary organic aerosol formation from anthropogenic air pollution: Rapid and higher than expected, Geophys. Res. Lett., 33, L17811, doi:10.1029/2006GL026899, 2006.
Yu, F.: A secondary organic aerosol formation model considering successive oxidation aging and kinetic condensation of organic compounds: global scale implications, Atmos. Chem. Phys., 11, 1083–1099, doi:10.5194/acp-11-1083-2011, 2011.
Zhang, Q., Jimenez, J. L., Canagaratna, M. R., Allan, J. D., Coe, H., Ulbrich, I., Alfarra, M. R., Takami, a., Middlebrook, a. M., Sun, Y. L., Dzepina, K., Dunlea, E., Docherty, K., De-Carlo, P. F., Salcedo, D., Onasch, T., Jayne, J. T., Miyoshi, T., Shimono, a., Hatakeyama, S., Takegawa, N., Kondo, Y., Schneider, J., Drewnick, F., Borrmann, S., Weimer, S., De-merjian, K., Williams, P., Bower, K., Bahreini, R., Cottrell, L., Griffin, R. J., Rautiainen, J., Sun, J. Y., Zhang, Y. M., and Worsnop, D. R.: Ubiquity and dominance of oxygenated species in organic aerosols in anthropogenically-influenced Northern Hemisphere midlatitudes, Geophys. Res. Lett., 34, 1–6, doi:10.1029/2007GL029979, 2007.