www.geosci-model-dev.net/7/161/2014/ doi:10.5194/gmd-7-161-2014
© Author(s) 2014. CC Attribution 3.0 License.
Geoscientific
Model Development
Reallocation in modal aerosol models: impacts on predicting aerosol
radiative effects
T. Korhola1, H. Kokkola2, H. Korhonen2, A.-I. Partanen2, A. Laaksonen2,3, K. E. J. Lehtinen1,2, and S. Romakkaniemi1
1Department of Applied Physics, University of Eastern Finland, P.O. Box 1627, 70211 Kuopio, Finland 2Finnish Meteorological Institute, P.O. Box 1627, 70211 Kuopio, Finland
3Finnish Meteorological Institute, P.O. Box 503, 00101 Helsinki, Finland Correspondence to: T. Korhola ([email protected])
Received: 14 June 2013 – Published in Geosci. Model Dev. Discuss.: 6 August 2013 Revised: 28 November 2013 – Accepted: 12 December 2013 – Published: 28 January 2014
Abstract. Atmospheric models often represent the aerosol particle size distribution with a modal approach, in which particles are described with log-normal modes within prede-termined size ranges. This approach reallocates particles nu-merically from one mode to another for example during par-ticle growth, potentially leading to artificial changes in the aerosol size distribution. In this study we analysed how the modal reallocation affects climate-relevant variables: cloud droplet number concentration (CDNC), aerosol–cloud inter-action parameter (ACI) and light extinction coefficient (qext).
The ACI parameter gives the response of CDNC to a change in total aerosol number concentration. We compared these variables between a modal model (with and without reallo-cation routines) and a high resolution sectional model, which was considered a reference model. We analysed the relative differences in the chosen variables in four experiments de-signed to assess the influence of atmospheric aerosol pro-cesses. We find that limiting the allowed size ranges of the modes, and subsequent remapping of the distribution, leads almost always to an underestimation of cloud droplet num-ber concentrations (by up to 100 %) and an overestimation of light extinction (by up to 20 %). On the other hand, the aerosol–cloud interaction parameter can be either over- or underestimated by the reallocating model, depending on the conditions. For example, in the case of atmospheric new par-ticle formation events followed by rapid parpar-ticle growth, the reallocation can cause on average a 10 % overestimation of the ACI parameter. Thus it is shown that the reallocation af-fects the ability of a model to estimate aerosol climate efaf-fects accurately, and this should be taken into account when using and developing aerosol models.
1 Introduction
Atmospheric aerosol particles are one of the most impor-tant climate forcing agents affecting Earth’s radiative bal-ance directly by scattering and absorbing solar radiation and indirectly by acting as condensation nuclei for cloud droplets (Forster et al., 2007). In order to estimate these ef-fects more reliably, aerosol microphysics have been imple-mented in global climate models. Atmospheric aerosol parti-cles are highly variable in their size and composition, which strongly influences their radiative effects. Thus capturing the climate effects of atmospheric particles accurately requires detailed modelling, which is limited by the high computa-tional costs.
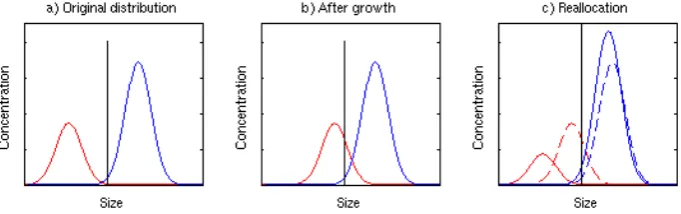
Figure 1: Schematic figure illustrating the growth of a mode over its threshold diameter, which leads to reallocation of the mode and to a decrease in its mean diameter and total number concen-tration. The solid vertical line denotes the threshold diameter. At c) the dashed line corresponds to the size distribution after growth (solid line in the b)).
Fig. 1. Schematic figure illustrating the growth of a mode over its threshold diameter, which leads to reallocation of the mode and to a
decrease in its mean diameter and total number concentration. The solid vertical line denotes the threshold diameter. At (c) the dashed line corresponds to the size distribution after growth (solid line in b).
distribution functions often match well the observed ambient aerosol size distributions (Seinfeld and Pandis, 2006). There-fore the log-normal mode assumption is frequently used in atmospheric applications. When the number of modes is kept low, a modal model is computationally efficient but the model accuracy may become compromised (Liu et al., 2012). In a modal model the aerosol distribution can be represented, for example, by four modes covering the size range from nucleation (Dp<10 nm) to coarse (Dp>1 µm) sizes (each
mode can include several compositions to account for inter-nal mixing) with additiointer-nal parallel modes to take into ac-count external mixing (Vignati et al., 2004). Each mode can be described by using the number and mass of particles as prognostic variables, and then the average particle diameter can be derived from these variables if the mode standard de-viation and composition (densities and mass concentrations of particle phase components) are known. The modal method is the most commonly used method in aerosol–climate mod-els which explicitly describe the aerosol size distribution (Whitby and McMurry, 1997; Ghan et al., 2001; Stier et al., 2005; Bauer et al., 2008; Liu et al., 2012; Mann et al., 2010; Pringle et al., 2010; Vignati et al., 2010; Zhang et al., 2012). Modal and sectional methods have been compared earlier in several publications (Seigneur et al., 1986; Zhang et al., 2002, 1999; Harrington and Kreidenweis, 1998; Kokkola et al., 2009). This study focuses on the numerical phenomena often connected to the application of modal representation of aerosol distribution in global atmospheric models. More specifically, we investigate the effects of particle realloca-tion between modes on cloud droplet number concentrarealloca-tion, aerosol–cloud interaction parameter and light extinction co-efficient in atmospherically relevant scenarios. Particle real-location effectively means transferring particles between the log-normal modes in specific conditions, in an attempt to achieve more accurate aerosol models. In the following, we introduce some common cases which require the use of this technique and discuss some of its limitations.
In global models, the atmosphere is usually represented with a 3-D (Gaussian) grid. To illustrate why particle re-allocation is necessary in global models that use the modal aerosol approach, we consider what happens when aerosol number and mass for a given mode are advected across the border between neighbouring grid boxes. After advection, the updated number and mass mixing ratios in each grid box represent the sum of the pre-existing and transported (from the adjacent grid box) number and mass, and together deter-mine the updated particle size for the mode. When the neigh-bouring grid boxes have mode diameters of similar size, the resulting combined mode represents the actual physical situ-ation adequately. But if the transported mode has grown sig-nificantly compared to the corresponding pre-existing mode in the grid box (or vice versa), the updated mode represents the average of the two populations, generating a peak in num-ber at the new mode diameter, with quite different size distri-bution than in either of the neighbouring grid boxes.
This misrepresentation is reduced when the diameters of corresponding modes in different grid boxes are not allowed to deviate too much. This can be done by restricting their allowed size ranges with a lower and an upper threshold di-ameter. When the upper tail of a mode (tail that represents the largest particles) grows past the upper threshold diame-ter, the mass and number corresponding to the fraction ex-ceeding the threshold diameter are transferred to the adja-cent larger mode (Binkowski and Roselle, 2003). Reallocat-ing a large amount of mass but a small number of particles efficiently decreases the average radius of the smaller mode, since the mass to number ratio of the transferred particles is clearly higher than that of the average particle in the mode. The larger mode also decreases in diameter but only slightly due to receiving a rather small amount of mass (and number) compared to the average particle in the mode.
exceeds the threshold diameter at the vertical line. Then, mass and number corresponding to the largest particles in the smaller mode are moved, i.e. reallocated, to the larger mode (blue curve). In the last panel the dashed line shows the distribution after the growth and the solid line is the result of a reallocated distribution. In reallocation the total aerosol number and mass concentrations are conserved. These are the two parameters that are often studied when model accu-racy is evaluated (e.g. Zhang et al., 1999; Mohs and Bowman, 2011). However, the shapes of the overall multi-modal size distributions are distinctly different between the reallocating and unrestricted models. The difference may have a strong effect on physically important aerosol properties, which rely on the number and size of the aerosol particles. Such prop-erties are for example the cloud droplet number concentra-tion, the aerosol–cloud interaction parameter describing the aerosol indirect effect, and the extinction coefficient con-tributing to the aerosol direct effect.
For example, consider the situation presented in Fig. 1 in a case when the size of the smallest particles activating to cloud droplets is close to the threshold diameter between the modes (i.e. the minimum in the distribution in the reallocating case). In such a situation, the number of cloud droplets formed in the reallocating case is relatively insensitive to variation in maximum supersaturation, whereas the number of droplets forming from the original distribution would be highly sen-sitive. It is worth noting that in marine stratocumulus regions there can be a local minimum in the number concentration at the activation diameter size (the so-called Hoppel gap; Hop-pel et al., 1994). However, in the reallocating model the min-imum is in the correct size only if the threshold diameter is set to the Hoppel gap range. Depending on the details of the size distribution, reallocation can cause over- or underestima-tion of the cloud droplet concentraunderestima-tion. It is worth noting that although the absolute CDNC (cloud droplet number concen-tration) could be wrong, the ACI (aerosol-cloud interaction) could be correctly estimated by different models. In such a case the first indirect aerosol effect could be correctly esti-mated even if there is some error in the absolute CDNC. In this paper, we carry out box model simulations with modal and sectional aerosol schemes to quantify the impact of re-allocation on CDNC, ACI parameter, and mid-visible light extinction.
2 Methods
While the problems described above arise predominantly in global models, we studied them in a box model framework, which allows better control over the physical, numerical and statistical phenomena compared to a global modelling frame-work. Most importantly, the box model allows the use of unrestricted mode structure with minimal errors in contrast to a three-dimensional framework where, e.g. aerosol trans-port between different model grids would be problematic
for an unrestricted structure (Jacobson, 2005). It has to be noted that the errors caused by reallocation are more pro-nounced in a box model than in large-scale atmospheric mod-els. In three-dimensional framework of large-scale models, processes such as transport and deposition will strongly af-fect the aerosol size distribution thus reducing the contribu-tion of reallocacontribu-tion to the size distribucontribu-tion.
The main tool of this study was a modal model which de-scribes the aerosol size distribution with 4 modes, and ac-counts for nucleation, condensation, coagulation and water uptake. The modal model was run using two approaches. In the first approach, we let the model run with unrestricted modes, i.e. there was no reallocation between the modes (hereafter: unrestricted model). In the second approach, we reallocated the modes so that none of them exceeded their set threshold values (hereafter: reallocating model). The threshold diameters used for reallocation were 10, 100, and 1000 nm for nucleation, Aitken and accumulation modes, re-spectively. These values fall in the range of values typically used in large-scale atmospheric models. Note that these are not the limits for the average diameter but instead to the up-per logarithmic tail of the mode. When a predefined (often very small) fraction of the mode’s mass exceeds the thresh-old diameter, that mass along with the corresponding parti-cle number is reallocated to the larger adjacent mode. Note the difference between the threshold diameter and the largest mean diameter which can be reached by the mode without its upper tail exceeding the threshold diameter.
In addition to the modal model, we also used the sectional model SALSA (Kokkola et al., 2008). This sectional model was run with a high size resolution using 100 size sections, and thus it served as a reference model when analysing the effects of reallocation on climate relevant properties (CDNC, ACI,bext). SALSA modelled the same physical processes as
the modal models.
Although the unrestricted modal model is not used in global applications, results from it were also compared against the sectional model. This was done in order to deter-mine the extent to which the difference between reallocating and sectional models can be explained by reallocation and to which extent simply by differences in modal and sectional size distributions.
ACI=dlog(CDNC)
dlog(N ) , (1)
where N is the total aerosol number concentration (Mc-Comiskey et al., 2009; Ahmad et al., 2013).
In experiments that simulated new particle formation, nu-cleation was calculated using activation type nunu-cleation (Si-hto et al., 2006),
J=A[H2SO4], (2)
whereJis the rate of 1.5 nm particles formed,Ais the nu-cleation coefficient and [H2SO4] is the sulfuric acid
con-centration. The coefficientA is determined from measure-ments, and in our simulations the used value of 10−6s−1 corresponds to a value obtained for boreal forest nucleation events. The gas phase sulfuric acid concentration has a sink due to new particle formation and condensation as in Vignati et al. (2004). The detailed description of the sectional model that was used as a reference model can be found in Kokkola et al. (2008). All simulations included only sulfate particles, gas phase sulfuric acid and water.
Since this is a comparison between different models with known limitations, we chose relative difference,
Relative difference(a, b)= a−b
(a+b) /2, (3)
as our metric since it does not assume either of the valuesa orbas an absolute reference. In this study, we did four differ-ent experimdiffer-ents to address typical situations arising in global models in which size distribution dependent parameters can be affected by the particle reallocation. The first three exper-iments had the same trimodal background aerosol with mean diameters of 30, 200 and 2400 nm and number concentra-tions of 500, 200 and 0.1 cm−3, respectively. The
geomet-ric standard deviation was assumed 1.59 for all modes. This distribution of the background aerosol has been found rep-resentative of boundary layer conditions (Asmi et al., 2011). To ensure the comparability between the modal and sectional models, all CDNC, ACI andbext(light extinction coefficient)
calculations were done with the sectional version of the cloud activation parameterisation and library functions by trans-forming the log-normal modes to a sectional representation with 100 sections. With this high resolution the errors from the transformation were negligible.
3 Results
3.1 Emission reallocation
The motivation for the first experiment was to study how the reallocation can affect the aerosol size distribution when pri-mary aerosols are emitted (only source of particles in this
experiment). Emission databases for anthropogenic primary aerosol typically provide only particle mass fluxes; however, models explicitly tracking the aerosol size distribution need to assume also the size for the emitted particles. Here we use a unimodal emission size with an 80 nm geometric mean di-ameter (Dp)and a geometric standard deviation (σ ) of 1.8,
as recommended by Dentener et al. (2006) for biofuel, wild-fire and volcanic emissions. With these recommended values, the mean diameter of the emitted particles is fairly close to the commonly assumed threshold diameter for reallocation and thus the artificial minimum produced by the reallocation procedure. The emission is introduced to the system as a log-normal mode and before any calculation it is merged with the already existing aerosol distribution. Since reallocation from the Aitken to the accumulation mode happens when the Aitken mode average diameter is larger than∼30 nm, emit-ting particles of 80 nm diameter into this mode causes strong reallocation of the emitted particle mode between Aitken and accumulation modes.
During the experiment, the CDNC and ACI parameters were calculated for a variety of emission mode number concentrations (50–800 cm−3)and updraft velocities (0.1– 3.0 m s−1). A wide velocity range was chosen to encompass scenarios from marine stratocumulus to convective clouds (Cotton and Anthes, 1989). Sincebextis independent of the
updraft velocity, the relative difference for it was calculated only as a function of emission number concentration. The emission mode’s mean diameter was kept constant (at the emission inventory value) and the same calculations were done with and without pre-existing background aerosol. This experiment did not include any aerosol processes, only re-allocation of the distribution followed by calculations of CDNC, ACI and bext. We present only a comparison
be-tween the reallocating modal model and the sectional refer-ence model, since the unrestricted modal model gives prac-tically identical results to the reference model now that no aerosol microphysics is simulated.
Figure 2: The absolute cloud droplet number concentrations from the first experiment. a) and c) show the CDNC's for unrestricted and reallocating modal models for the no background case. Panels b) and d) from the case with background aerosol.
Fig. 2. The absolute cloud droplet number concentrations from the first experiment. (a) and (c) show the CDNCs for unrestricted and
reallocating modal models for the no background case. Panels (b) and (d) for the case with background aerosol.
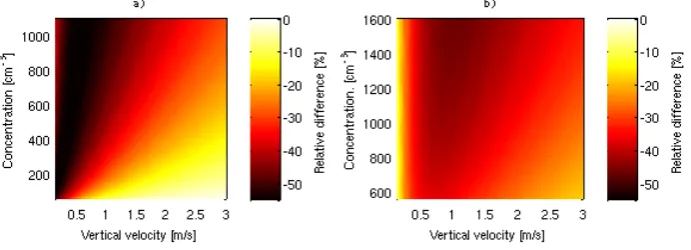
Figure 3: Relative difference of the CDNC between the reallocating and unrestricted modal models in experiment 1. a) shows the difference without and b) with background aerosol.
Fig. 3. Relative difference of the CDNC between the reallocating and unrestricted modal models in experiment 1. (a) shows the difference
without and (b) with background aerosol.
velocities (corresponding to large critical diameters), as in the unrestricted model some of the particles in the emission mode still activate but in the reallocated model practically all emitted particles transferred to the Aitken mode remain un-activated. With an increasing vertical velocity the critical di-ameter decreases and thus also particles that are in the Aitken mode begin to contribute to the CDNC, which decreases the underestimation.
When background aerosol is included in the simulation, the underestimation decreases (Fig. 3b). This is because the background accumulation mode particles decrease the rela-tive contribution of the emitted particles to the CDNC. It is worth noting that if the critical diameter and the mean diam-eter of the background accumulation mode were larger than the emission mode, the reallocation would cause an overesti-mation of CDNC (not shown in figures). This would hap-pen because some of the emitted particles are reallocated to the accumulation mode which is (at least partly) acti-vated, whereas in the unrestricted distribution would not con-tribute to the CDNC. This effect is weaker when the back-ground aerosol is excluded in the simulation because the ac-cumulation mode after reallocation now has a smaller diam-eter compared to the case with background aerosol. This is
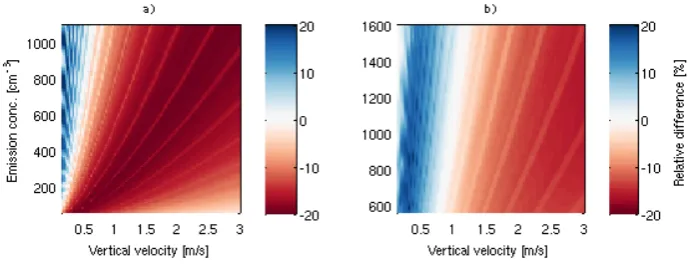
because the large background mode particles dominate over the clearly smaller reallocated particles, and thus the addition of the reallocated particles decreases the accumulation mode diameter only slightly when background aerosol is included. In Fig. 5 the relative difference of the ACI parameter shows both over- and underestimation by the model with re-allocation compared to the freely moving (i.e. unrestricted) model, depending on the concentration of emitted parti-cles and the updraft velocity. For updraft velocities be-low 0.4 m s−1and without background aerosol, reallocation causes overestimation in the ACI parameter while underes-timating it for higher updraft velocities. With background aerosol, the switch between over- and underestimation oc-curs approximately at 0.8 m s−1. These results indicate that
Figure 4: Schematic figure explaining the effects of reallocation to particle activation. Blue
line is the emission mode, which is then reallocated into Aitken and accumulation modes
(red curve). Dashed lines are the respective critical diameters for unrestricted and
reallocating models and the solid black is the threshold diameter for Aitken mode. There is
no background aerosol present.
Fig. 4. Schematic figure explaining the effects of reallocation to particle activation. Blue line is the emission mode, which is then reallocated
into Aitken and accumulation modes (red curve). Dashed lines are the respective critical diameters for unrestricted and reallocating models and the solid black is the threshold diameter for Aitken mode. There is no background aerosol present.
Figure 5: Relative difference of the ACI parameter between the reallocating and unrestricted modal models in experiment 1. a) shows the difference without and b) with background aerosol.
Fig. 5. Relative difference of the ACI parameter between the reallocating and unrestricted modal models in experiment 1. (a) shows the
difference without and (b) with background aerosol.
rather high value was found for the unrestricted model at the maximum updraft velocity and with a low number of parti-cles.
The reason behind the behaviour of the ACI parameter is fundamentally the same as above for CDNC. A signifi-cant fraction of the particle number in the emission mode in the unrestricted model is above the critical diameter (Fig. 4), whereas the reallocation moves the majority of the particles below the critical diameter. Because of this, the emission mode in the reallocating model is unable to contribute as di-rectly to the CDNC as in the unrestricted model. This means that the ACI parameter (Eq. 1) is higher in the unrestricted model compared to the model with reallocation.
Including a background aerosol decreases the ACI param-eter, but in the setup investigated here more effectively in the unrestricted than in the reallocating model. This is because the presence of a non-activating background Aitken mode de-creases the activated fraction in the unrestricted model more than in the reallocating model, which in turn decreases the CDNC sensitivity to changes in total number concentration.
In this emission experiment, the small size of the emit-ted particles does not cause strong (mid-visible) light ex-tinction. The maximum value for the extinction coefficient
was below 2 Mm−1 (=2×10⁻⁶m−1)without background aerosol. The relative difference in thebextbetween the
real-locating and unrestricted models was approximately a con-stant 38 %, but low absolute values decreased its relevance. With background aerosol, the absolute values were between 10 and 13 Mm−1but the relative difference was just above 5 %.
3.2 Constant emission into an aging aerosol distribution
Figure 6: Relative difference of the cloud droplet number concentration between the three models in experiment 2.
Fig. 6. Relative difference of the cloud droplet number concentration between the three models in experiment 2.
rate (PSA)of H2SO4into the system was defined by
PSA=P0
T −t
T , (4)
whereP0was a constant rate of 5.2×t107cm−3s−1, andT
andtwere the total simulation time (i.e. 18 h) and the current time (in hours) at a given time step. So the amount of H2SO4
added to the system was linearly decreasing through the sim-ulation. In addition, the explicitly resolved condensation and new particle formation decreased the H2SO4 vapor phase
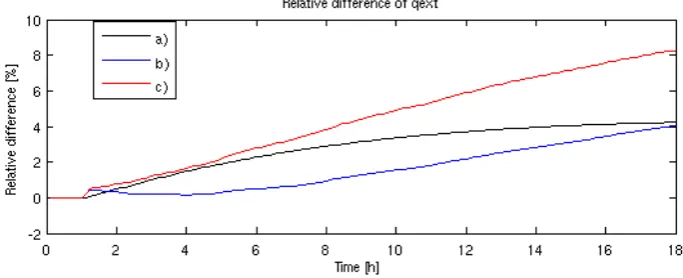
concentration. We calculated the relative difference inbext
between the unrestricted and reallocating modal approaches as a function of simulation time. In addition, we calculated the relative differences in CDNC and the ACI parameter for a range of updraft velocities. These results were also compared with the sectional model.
Figure 6 shows the relative difference of the CDNC be-tween the different models. With a constant emission rate of 0.01 particles per second (average diameter 80 nm), the real-locating model underestimates the CDNC for the most part compared to the unrestricted modal and sectional models. The largest difference of−77 % is between the reallocating and sectional models, whereas the unrestricted model under-estimates at maximum by−41 % compared to the sectional model. At low updraft velocities and in the beginning of the simulation the unrestricted and reallocating modal models overestimate the CDNC compared to the sectional model by up to 9 and 5 %, respectively. This is because the largest par-ticles in the Aitken mode in the modal models grow faster to activation sizes compared to the sectional model. Since the mode width in the modal model is fixed, the rapid growth of small particles also affects the larger particles in the same mode, causing a too-fast growth rate. In contrast, in the sec-tional model different sections in the same mode grow inde-pendently of other sections.
Figure 6 also illustrates a noticeable difference between a modal model with fixed mode width and a sectional model. As the shape of a “mode” is allowed to change freely in the sectional model, the condensational growth will narrow
it quickly due to small particles growing faster compared to larger ones. This also shows up in cloud activation as a sharp increase in the CDNC when the narrow peaked “mode” reaches the critical diameter. This increase can be seen in Fig. 6 as a sharp gradient in panels b and c. Note also that the average diameter of the Aitken mode in the modal models in-creases not only by condensation (contributing 25 nm to the growth of the particle diameter during the 18 h) but also by the addition of mass from the emitted particles to the Aitken mode (contributing to the growth by additional 45 nm). How-ever, after the Aitken mode diameter has reached the size of the emission mode, condensation is not strong enough to in-crease the mode diameter further since the injection of 80 nm particles will dominate the average diameter compared to al-ready slowed down condensational growth.
The relative difference of the ACI parameter is shown in Fig. 7. The relative difference between the modal models goes from a maximum of 23 % (updraft velocity∼0.4 m s−1) to a minimum of−16 % (updraft velocity above 1.5 m s−1). Compared to the sectional model, the modal models overesti-mate the ACI by close to 100 % before the narrow (and high) Aitken mode in the sectional model reaches the activation di-ameter. However, once this narrow Aitken mode has grown to the activation size, the modal models start to underesti-mate the ACI. The underestimation is up to 25 % by the re-allocating and up to 10–20 % by the unrestricted model. The relative differences of the CDNC and ACI parameter are for the large part governed by the same phenomena as explained and illustrated in Sect. 3.1 and Fig. 4.
Figure 7: Relative difference of the cloud-aerosol interaction parameter between the three models. Fig. 7. Relative difference of the cloud–aerosol interaction parameter between the three models.
Figure 8: The relative difference of the light extinction coefficient. In the legend
a) stands for comparison between reallocated and full moving models, b) for full
moving vs. sectional and c) for reallocated vs. sectional model.
Fig. 8. The relative difference of the light extinction coefficient. In the legend (a) stands for comparison between reallocated and full moving
models, (b) for full moving vs. sectional and (c) for reallocated vs. sectional models.
not have significantly more particles above the sizes sensi-tive to light scattering and absorption. The absolute values for the extinction coefficients were 150–250×10−6m−1. 3.3 Nucleation event
The third experiment simulated all microphysical processes, nucleation being the only mechanism increasing the particle number concentration. Again, the simulation was initialised with the background size distribution detailed in Sect. 2.1. Sulfuric acid was injected continuously (maximum concen-trations of 5.0×108cm−3) to the system starting at 1.5 h into the simulation until the end of the simulation (18 h). The CDNC, ACI parameter andbextwere compared between
the unrestricted and reallocating modal models and the sec-tional model for updraft velocity range of 0.1–3.0 m s−1. In
all of the simulations, the average diameters of the back-ground modes did not exceed their reallocation threshold val-ues, making sure that there was no need for reallocation of the background distribution at the beginning of the simula-tions.
Figure 9 shows a significant difference in the number size distribution between the unrestricted and reallocating modal representations and the sectional aerosol representation. Note
the persistent minima in the size distribution of the reallocat-ing modal model caused by reallocation (Fig. 9b).
Figure 9: Number size distribution plots illustrating the major differences between the models. An example of a critical diameter for a midrange updraft velocity is plotted with dashed line on the distributions.
Fig. 9. Number size distribution plots illustrating the major differences between the models. An example of a critical diameter for a midrange
updraft velocity is plotted with dashed line on the distributions.
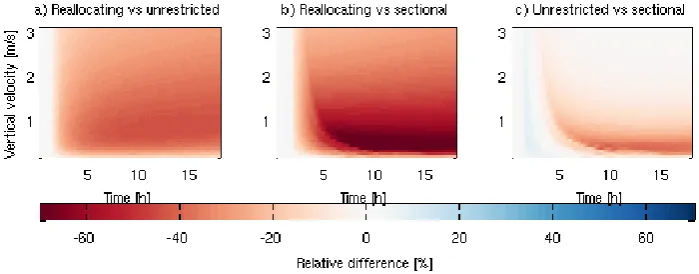
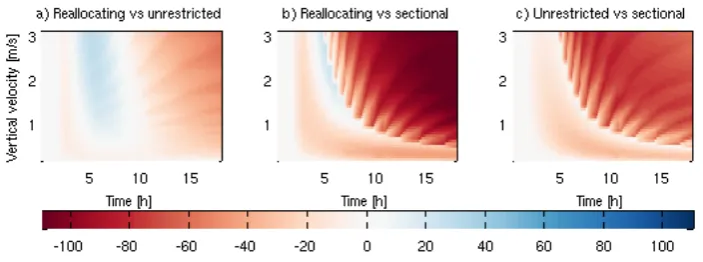
Figure 10: Relative difference of the CDNC between the three models. Notice the small area of overestimation by reallocating model compared the the unrestricted model (a).
Fig. 10. Relative difference of the CDNC between the three models. Notice the small area of overestimation by the reallocating model
compared to the unrestricted model (a).
Due to these reasons, the differences in CDNC and ACI parameter may shift considerably depending on the condi-tions. Figure 10 shows the relative difference in CDNC be-tween the three models as a function of time and updraft ve-locity. In Fig. 10a, which shows the difference for reallocat-ing and unrestricted modal models, the critical diameter is within the Aitken mode for updraft velocities above 1 m s−1. Between 1 and 4 h in the simulation, the Aitken mode reaches its threshold diameter in the reallocating model, and thus the mode mean diameter does not grow further. After that the Aitken mode contributes to the increase of CDNC only via reallocation of mass and (small) number to the accumulation mode; this causes increasing underestimation until 4 h. When the particles are being reallocated after 4 h from nucleation mode to partially activating Aitken mode, the difference be-tween the distributions even out and momentarily the reallo-cated model produces 20 % more cloud droplets. Eventually the freely growing nucleation mode in the unrestricted model grows enough to contribute to CDNC, whereas a large por-tion of the nucleated particles in the reallocating model are held back in the nucleation and Aitken modes, which even-tually leads to underestimation (−40 %) by the reallocating model compared to the unrestricted model. Figure 10b and c show that after the narrow nucleation mode in the sectional
model has reached the activation size, it produces 118 % more droplets than the reallocating model and 87 % more than the unrestricted modal model. By comparing these two numbers, it is evident that the fixed mode width (inherent in both versions of the modal model) causes a relatively larger error in CDNC than reallocation when nucleated particles are large enough to form cloud droplets in the sectional model.
It is also worth pointing out that the differences in the num-ber size distributions also affect the coagulation loss of the particles. In the reallocating model version, more particles re-main in the nucleation mode (compared to unrestricted modal and sectional models) which leads to higher average coagula-tion coefficients and thus higher particle loss by coagulacoagula-tion. In this experiment the largest relative difference between the unrestricted and reallocating model versions’ total number concentration was 40 %, which also amplifies the underesti-mation of the CDNC by the reallocating model.
Figure 11: The relative difference of ACI parameter between the three models. The sharp mode in the sectional distribution together with the changes in the critical diameter cause the extreme differences compared to the modal models with fixed mode width
Fig. 11. The relative difference of the ACI parameter between the three models. The sharp mode in the sectional distribution together with
the changes in the critical diameter cause the extreme differences compared to the modal models with fixed mode width.
strongly decreases the fraction of activated particles thus leading to lower ACI parameter values. In fixed width modal models this effect is not so pronounced and thus strong over-estimation by modal models in comparison to the sectional one can be seen.
The difference in particle number concentrations for par-ticles with diameter of the order of a few hundred nanome-tres (to which thebextis sensitive to) was not significant in
this experiment between the different models. This results in small relative differences ranging from 7 to−6 % in the extinction coefficient between the models as can be seen in Fig. 12.
3.4 Ensemble nucleation event
To analyse the effect of the simulation conditions on the full microphysics run, we made simulations for conditions where the model produced nucleation events with a large number of different conditions. The number concentrations for the initial size distribution of the Aitken mode varied between 100 and 6400 cm−3. For the initial accumulation mode the number concentrations varied between 50 and 3200 cm−3. The updraft velocity varied between 0.1 and 3.0 m s−1. Al-though the setup for these simulations was tailored for simu-lating nucleation events, some of the background distribu-tions acted as such a strong condensation sink for sulfu-ric acid that there was no noticeable new particle formation (NPF).
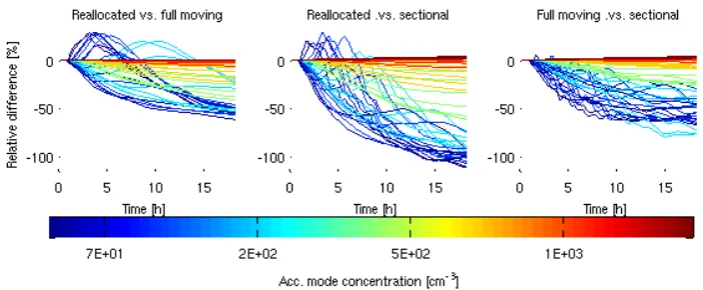
Figure 13 shows the relative differences between all three models for an updraft velocity of 1.0 m s−1 (one case
pre-sented as an example for clarity). For initial accumulation mode number concentrations higher than 1000 cm−3 (red
lines), the relative difference in the CDNC between the mod-els is close to zero. This is because condensation to the ac-cumulation mode depletes most of the H2SO4, and thus the
growth of the Aitken mode is weak; therefore very little or no reallocation occurs between the Aitken and accumula-tion modes. The growth and reallocaaccumula-tion of the accumulaaccumula-tion mode to coarse mode do not cause a difference in CDNC
since both modes are usually larger than the critical diame-ter. In addition, in these cases with high accumulation mode concentration, there is no new particle formation due to the lack of available sulfuric acid. Increase in the updraft velocity evens out the differences between the models, as with high updrafts most of the particles are be activated.
When there are fewer particles in the accumulation mode (blue and green lines), the underestimation of CDNC by the reallocating model starts to be more pronounced. With a few hundred particles per cubic centimetre in the accumulation mode, the underestimation between the reallocating and un-restricted models is around 60 % at the end of the simulation. Relative differences are similar between the unrestricted and sectional models. The largest relative differences are seen be-tween the reallocating and sectional models with values of approximately−110 % (in the case of 1.0 m s−1updraft ve-locity). The overestimation for the reallocating model com-pared to the unrestricted and sectional ones at the beginning of the simulation is due to the same reasons as in the previous nucleation experiments (nucleation mode is still small in the unrestricted and sectional models while first the particles are reallocated into Aitken mode in the reallocating model).
As seen in the previous experiment in Sect. 3.3, the ACI parameter can be very sensitive to small changes in updraft velocities when there are steep gradients in the size distri-bution. To show the trend in the ACI parameter, the average relative difference over the 49 size distributions is presented in Fig. 14. The reasons behind the higher values given by modal models compared to the sectional model are the same as in Sect. 3.3. On average, the modal models agree well with each other and the relative difference between the sectional and both of the modal models is around 10 %.
Figure 12: The relative difference of the light extinction coefficient. In the legend a)
stands for comparison between reallocated and full moving models, b) for full moving
vs. sectional and c) for reallocated vs. sectional model.
Fig. 12. The relative difference of the light extinction coefficient. In the legend (a) stands for comparison between reallocated and full moving
models, (b) for full moving vs. sectional and (c) for reallocated vs. sectional models.
Figure 13: The relative differences of the CDNC between the three different models. Similar phenomenons can been seen on lower accumulation mode number concentrations as in previous chapters.
Fig. 13. The relative differences of the CDNC between the three different models. Similar phenomenons can been seen on lower accumulation
mode number concentrations as in previous figures.
the reallocating model reaches 20 % when the accumulation mode concentration is at its lowest values. Since the accu-mulation and coarse mode particles dominate the extinction properties of the droplets, the highest differences occur in a case when the accumulation mode is initially at low con-centration, and the concentration is increased only by real-location of the particles when the growing modes in the un-restricted modal and sectional models are still too small to contribute to the light extinction.
4 Conclusions
In this study we concentrated on the effects of reallocat-ing the aerosol mass and number between modes on size dependent aerosol properties. The reallocation is a numer-ical routine required in global modal aerosol models to keep the aerosol distribution representative of the physical state. More specifically we focused on three atmospherically relevant aerosol properties: cloud droplet number concen-tration (CDNC), aerosol–cloud interaction parameter (ACI) and light extinction coefficient (bext). We performed four
experiments to address the typical aerosol related phenom-ena in the atmosphere. We compared the results between a sectional model and both reallocating and unrestricted modal models.
Figure 14: The relative difference of the ACI parameter presented as mean over the 49 different distributions.
Fig. 14. The relative difference of the ACI parameter presented as mean over the 49 different distributions.
Figure 15: The relative difference of a extinction coefficient between the three models. Fig. 15. The relative difference of a extinction coefficient between the three models.
although less in the case of the unrestricted model. In the sec-ond experiment, particles also grew large enough to be able to affect the light extinction. The reallocating modal model gave the largest extinction coefficient values followed by the unrestricted model and the sectional model.
The last two experiments included full aerosol micro-physics and focused on simulations with new particle forma-tion. First we analysed in detail a single nucleation event with all three models for a range of updraft velocities. Eventually the reallocating model underestimates the CDNC compared to the unrestricted model, which in turn underestimates the CDNC when compared to the sectional model. In this exper-iment there were no significant differences in the extinction coefficient between the models.
In the last experiment, we assessed the effect of the initial background distribution by using 49 different initial combi-nations of Aitken and accumulation mode number concen-trations for 50 different updraft velocities. For the most part the results agree with the previous experiments. In a small number of cases in which the accumulation mode dominates the total number concentration, the models agree well with respect to CDNC and ACI values. However, in atmospheri-cally more relevant cases, in which the Aitken mode domi-nates, the underestimation in CDNC by reallocation is again
clearly noticeable. The extinction coefficient was overesti-mated by the reallocating model compared to both the unre-stricted and sectional models for all accumulation mode con-centrations. On the other hand, the unrestricted and sectional models agreed reasonably well with each other. A similar study by Mann et al. (2012) compared predicted CCN (cloud condensation nuclei) concentrations from a modal and a rel-atively coarse sectional global model. Their result showed an overestimation by the modal model compared to the sectional model. Although opposite to our findings, the results of these two studies are not directly comparable; our sectional model had a much higher size resolution, the global model setup introduces many new processes (deposition, cloud process-ing, advection) not considered in our study, and the Mann et al. study addressed CCN (i.e. particles larger than 50 and 150 nm) not CDNC.
modal models to estimate the aerosol–climate effects accu-rately: the underestimation of the CDNC after the nucleated particles grow big enough to form cloud droplets causes an underestimation of the first aerosol indirect effect, whereas the overestimation of the extinction will tend to cause a too-strong aerosol direct effect. These findings should be taken into account when using and developing aerosol models.
Acknowledgements. The research has been supported by the
strate-gic funding of the University of Eastern Finland, and by the Academy of Finland Centre of Excellence Program (project no. 1118615).
Hannele Korhonen and Sami Romakkaniemi acknowledge the Academy of Finland for the Academy Research Fellow positions (decisions 250348 and 267514).
Edited by: O. Morgenstern
References
Ahmad, I., Mielonen, T., Grosvenor, D., Portin, H., Arola, A., Mikkonen, S., Kühn, T., Leskinen, A., Joutsensaari, J., Komp-pula, M., Lehtinen, K., Laaksonen, A., and Romakkaniemi, S.: Long-term measurements of cloud droplet concentrations and aerosol-cloud interactions in continental boundary layer clouds, Tellus B, 65, 20138, doi:10.3402/tellusb.v65i0.20138, 2013. Asmi, A., Wiedensohler, A., Laj, P., Fjaeraa, A.-M., Sellegri, K.,
Birmili, W., Weingartner, E., Baltensperger, U., Zdimal, V., Zikova, N., Putaud, J.-P., Marinoni, A., Tunved, P., Hansson, H.-C., Fiebig, M., Kivekäs, N., Lihavainen, H., Asmi, E., Ulevicius, V., Aalto, P. P., Swietlicki, E., Kristensson, A., Mihalopoulos, N., Kalivitis, N., Kalapov, I., Kiss, G., de Leeuw, G., Henzing, B., Harrison, R. M., Beddows, D., O’Dowd, C., Jennings, S. G., Flentje, H., Weinhold, K., Meinhardt, F., Ries, L., and Kul-mala, M.: Number size distributions and seasonality of submi-cron particles in Europe 2008–2009, Atmos. Chem. Phys., 11, 5505–5538, doi:10.5194/acp-11-5505-2011, 2011.
Bauer, S. E., Wright, D. L., Koch, D., Lewis, E. R., Mc-Graw, R., Chang, L.-S., Schwartz, S. E., and Ruedy, R.: MA-TRIX (Multiconfiguration Aerosol TRacker of mIXing state): an aerosol microphysical module for global atmospheric models, Atmos. Chem. Phys., 8, 6003–6035, doi:10.5194/acp-8-6003-2008, 2008.
Binkowski, F. S. and Roselle, S. J.: Models-3 Commu-nity Multiscale Air Quality (CMAQ) model aerosol com-ponent, 1, Model description, J. Geophys. Res., 108, 4183, doi:10.1029/2001JD001409, 2003.
Cotton, W. R. and Anthes, R. A.: Storm and cloud dynamics, In-ternational Geophysics Series, Academic Press, San Diego, 883 pp., 1989.
Dentener, F., Kinne, S., Bond, T., Boucher, O., Cofala, J., Generoso, S., Ginoux, P., Gong, S., Hoelzemann, J. J., Ito, A., Marelli, L., Penner, J. E., Putaud, J.-P., Textor, C., Schulz, M., van der Werf, G. R., and Wilson, J.: Emissions of primary aerosol and precur-sor gases in the years 2000 and 1750 prescribed data-sets for Ae-roCom, Atmos. Chem. Phys., 6, 4321–4344, doi:10.5194/acp-6-4321-2006, 2006.
Forster, P., Ramaswamy, V., Artaxo, P., Berntsen, T., Betts, R., Fa-hey, D. W., Haywood, J., Lean, J., Lowe, D. C., Myhre, G., Nganga, J., Prinn, R., Raga, G., Schulz, M., and Van Dorland, R.: Changes in Atmospheric Constituents and in Radiative Forc-ing, in: Climate Change 2007: The Physical Science Basis. Con-tribution of Working Group I to the Fourth Assessment Report of the Intergovernmental Panel on Climate Change, edited by: Solomon, S., Qin, D., Manning, M., Chen, Z., Marquis, M., Av-eryt, K. B., Tignor, M., and Miller H. L., Cambridge Univer-sity Press, Cambridge, United Kingdom and New York, NY, US, 2007.
Ghan, S., Laulainen, N., Easter, R., Wagener, R., Nemesure, S., Chapman, E., Zhang, Y., and Leung, R.: Evaluation of aerosol di-rect radiative forcing in MIRAGE, J. Geophys. Res., 106, 5295– 5316, doi:10.1029/2000JD900502, 2001.
Harrington, D. Y. and Kreidenweis, S. M.: Simulations of sulphate aerosol dynamics-II, Model intercomparison, Atmos. Environ., 32, 1701–1709, 1998.
Hoppel, W. A., Frick, G. M., Fitzgerald, J. W., and Larson, R. E.: Marine boundary layer measurements of new parti-cle formation and the effects nonprecipitating clouds have on aerosol size distribution, J. Geophys. Res., 99, 14443–14459, doi:10.1029/94JD00797, 1994.
Jacobson, M. Z.: Fundamentals of Atmospheric Modeling, Second Edition, Cambridge University Press, New York, 2005. Kokkola, H., Korhonen, H., Lehtinen, K. E. J., Makkonen, R.,
Asmi, A., Järvenoja, S., Anttila, T., Partanen, A.-I., Kulmala, M., Järvinen, H., Laaksonen, A., and Kerminen, V.-M.: SALSA – a Sectional Aerosol module for Large Scale Applications, At-mos. Chem. Phys., 8, 2469–2483, doi:10.5194/acp-8-2469-2008, 2008.
Kokkola, H., Hommel, R., Kazil, J., Niemeier, U., Partanen, A.-I., Feichter, J., and Timmreck, C.: Aerosol microphysics modules in the framework of the ECHAM5 climate model – intercomparison under stratospheric conditions, Geosci. Model Dev., 2, 97–112, doi:10.5194/gmd-2-97-2009, 2009.
Liu, X., Easter, R. C., Ghan, S. J., Zaveri, R., Rasch, P., Shi, X., Lamarque, J.-F., Gettelman, A., Morrison, H., Vitt, F., Conley, A., Park, S., Neale, R., Hannay, C., Ekman, A. M. L., Hess, P., Mahowald, N., Collins, W., Iacono, M. J., Bretherton, C. S., Flan-ner, M. G., and Mitchell, D.: Toward a minimal representation of aerosols in climate models: description and evaluation in the Community Atmosphere Model CAM5, Geosci. Model Dev., 5, 709–739, doi:10.5194/gmd-5-709-2012, 2012.
Mann, G. W., Carslaw, K. S., Spracklen, D. V., Ridley, D. A., Manktelow, P. T., Chipperfield, M. P., Pickering, S. J., and Johnson, C. E.: Description and evaluation of GLOMAP-mode: a modal global aerosol microphysics model for the UKCA composition-climate model, Geosci. Model Dev., 3, 519–551, doi:10.5194/gmd-3-519-2010, 2010.
McComiskey, A., Feingold, G., Frisch, A. S., Turner, D. D., Miller, M. A., Chiu, J. C., Min, Q., and Ogren, J. A.: An assess-ment of aerosol-cloud interactions in marine stratus clouds based on surface remote sensing, J. Geophys. Res., 114, D09203, doi:10.1029/2008JD011006, 2009.
Mohs, J. and Bowman, F.: Eliminating Numerical Arti-facts When Presenting Moving Center Sectional Aerosol Size Distributions, Aerosol Air Quality Res., 11, 21–30, doi:10.4209/aaqr.2010.06.0046, 2011.
Nenes, A. and Seinfeld, J. H.: Parameterization of cloud droplet formation in global climate models, J. Geophys. Res., 108, 4415, doi:10.1029/2002JD002911, 2003.
Pringle, K. J., Tost, H., Message, S., Steil, B., Giannadaki, D., Nenes, A., Fountoukis, C., Stier, P., Vignati, E., and Lelieveld, J.: Description and evaluation of GMXe: a new aerosol submodel for global simulations (v1), Geosci. Model Dev., 3, 391–412, doi:10.5194/gmd-3-391-2010, 2010.
Salil, M., Evans, K. J. Truesdale, J. E., Hack, J. J., and Lamarque, J.-F.: Interannual Tropospheric Aerosol Variability in the Late Twentieth Century and Its Impact on Tropical Atlantic and West African Climate by Direct and Semidirect Effects, J. Climate, 25, 8031–8056, doi:10.1175/JCLI-D-12-00029.1, 2012.
Seigneur, C., Hudischewskyj, A. B., Seinfeld, J. H., Whitby, K. T., Whitby E. R., Brock J. R., ann Barnes, H. M.: Simulation of Aerosol Dynamics: A Comparative Review of Mathematical Models, Aerosol Sci. Technol., 5, 205–222, 1986.
Seinfeld, J. H. and Pandis, S. N.: Atmospheric Chemistry and Physics: From Air Pollution to Climate Change, 2nd Edn., J. Wi-ley, New York, 2006.
Sihto, S.-L., Kulmala, M., Kerminen, V.-M., Dal Maso, M., Petäjä, T., Riipinen, I., Korhonen, H., Arnold, F., Janson, R., Boy, M., Laaksonen, A., and Lehtinen, K. E. J.: Atmospheric sulphuric acid and aerosol formation: implications from atmospheric mea-surements for nucleation and early growth mechanisms, At-mos. Chem. Phys., 6, 4079–4091, doi:10.5194/acp-6-4079-2006, 2006.
Stier, P., Feichter, J., Kinne, S., Kloster, S., Vignati, E., Wilson, J., Ganzeveld, L., Tegen, I., Werner, M., Balkanski, Y., Schulz, M., Boucher, O., Minikin, A., and Petzold, A.: The aerosol-climate model ECHAM5-HAM, Atmos. Chem. Phys., 5, 1125–1156, doi:10.5194/acp-5-1125-2005, 2005.
Vignati, E., Wilson, J., and Stier, P.: M7: An efficient size-resolved aerosol microphysics module for large-scale aerosol transport models, J. Geophys. Res., 109, D22202, doi:10.1029/2003JD004485, 2004.
Vignati, E., Karl, M., Krol, M., Wilson, J., Stier, P., and Cavalli, F.: Sources of uncertainties in modelling black carbon at the global scale, Atmos. Chem. Phys., 10, 2595–2611, doi:10.5194/acp-10-2595-2010, 2010.
Whitby, E. R. and McMurry, P. H.: Modal Aerosol Dynamics Mod-eling, Aerosol Sci. Technol., 27, 673–688, 1997.
Zhang, Y., Seigneur, C., Seinfeld, J. H., Jacobson, M. Z., and Binkowski, F. S.: Simulation of aerosol dynamics: A compara-tive review of algorithms used in air quality models, Aerosol Sci. Technol., 31, 487–514, 1999.
Zhang, Y., Easter, R. C., Ghan, S. J., and Abdul-Razzak, H.: Impact of aerosol size representation on modeling aerosol-cloud interac-tions, J. Geophys. Res., 107, 4558, doi:10.1029/2001JD001549, 2002.