Open Access
Research
Cluster of systemic lupus erythematosus (SLE) associated with an
oil field waste site: a cross sectional study
James Dahlgren*
1, Harpreet Takhar
2, Pamela Anderson-Mahoney
3,
Jenny Kotlerman
4, Jim Tarr
5and Raphael Warshaw
6Address: 1Department of Occupational and Environmental Medicine, UCLA School of Medicine, Los Angeles, CA, USA, 2James Dahlgren Medical,
Santa Monica, CA, USA, 3Epidemiology Resources, Van Nuys, CA, USA, 4Epidemiology, UCLA School of Public Health, Los Angeles, CA, USA, 5Stone Lions, Rolling Hills Estates, CA, USA and 6Comprehensive Health Screening Services, Santa Monica, CA, USA
Email: James Dahlgren* - dahlgren@envirotoxicology.com; Harpreet Takhar - htakhar@envirotoxicology.com; Pamela Anderson-Mahoney - panderso@usc.edu; Jenny Kotlerman - jkotlerm@ucla.edu; Jim Tarr - info@stonelions.com; Raphael Warshaw - ray@wdds.com * Corresponding author
Abstract
Background: This is a community comparison study that examines persons living in a subdivision exposed to petroleum products and mercury.
Methods: We compared their health status and questionnaire responses to those living in another community with no known exposures of this type.
Results: Pristane house dust among the exposed homes was higher than in the comparison communities. The exposed subdivision has higher ambient air mercury levels compared to the control community. The prevalence of rheumatic diseases (OR = 10.78; CI = 4.14, 28.12) and lupus (OR = 19.33; CI = 1.96, 190.72) was greater in the exposed population compared to the unexposed. A higher prevalence of neurological symptoms, respiratory symptoms and several cardiovascular problems including stroke (OR = 15.41; CI = 0.78, 304.68) and angina (OR = 5.72; CI = 1.68, 19.43) was seen.
Conclusion: There were statistically significant differences in B cells, Natural Killer Cells, gamma glutamyl transferase, globulin and serum calcium levels between control and exposed subjects.
Background
Systemic lupus erythematosus (SLE or lupus) is an autoimmune disease in which the body produces anti-nuclear antibodies that attack healthy tissues leading to inflammation and damage to various body tissues. Lupus can affect many parts of the body, including the joints, skin, kidneys, heart, lungs, blood vessels, and brain. It is a chronic, complex, and potentially fatal multi-system inflammatory disorder that can be difficult to diagnose [1,2]. No single laboratory test confirms a diagnosis of
SLE. Many physicians use the American College of Rheu-matology's "Eleven Criteria of Lupus" to aid in the diag-nosis where the appearance of four of the "Eleven Criteria of Lupus" qualifies as a positive diagnosis of Lupus [2] (Figure 1).
SLE can occur at any age and in either sex. However, women are more likely to have SLE and women of color are more likely to have SLE compared to white women [3]. Migration studies suggest that environmental factors
Published: 22 February 2007
Environmental Health 2007, 6:8 doi:10.1186/1476-069X-6-8
Received: 11 May 2006 Accepted: 22 February 2007
This article is available from: http://www.ehjournal.net/content/6/1/8 © 2007 Dahlgren et al; licensee BioMed Central Ltd.
play a role in the development of SLE [4]. Residents living near industrial emissions or environmental contamina-tion have been shown to have an increase prevalence of SLE [5,6]. Research indicates that a combination of genetic and environmental factors can trigger the develop-ment of SLE, however there is a need for additional research to identify and characterize the specific exposures that contribute to the incidence and aggravation of SLE [7,8].
Animal studies suggest that pristane and mercury may be environmental triggers for SLE [9-15]. It has been demon-strated that both pristane and mercury will induce a con-dition in mice that mimics clinical features and the autoantibody pattern characteristic of SLE in humans. We know of no reports in the medical literature of SLE in humans following exposure to pristane. There have been case reports linking mercury to autoimmune disease in humans and a recent epidemiologic study of occupational risk factors for SLE identified mercury as a potential causal agent (OR = 3.6; 95% CI = 1.3,10.0) [7-10].
We investigated an apparent cluster of SLE cases in a com-munity in Hobbs, New Mexico. This investigation was ini-tiated by residents of a six square block area who noted an excess of SLE cases in their neighborhood. Most of the cases occurred in a new subdivision built on land that was an active oilfield from 1927 until the late 1960s. This sub-division was built on that site in 1976. Some of the homes were built on ground that had previously been used as a pit for oil field waste, which was estimated to be 200 feet long and 30 feet wide.
The residents experienced petroleum and/or rotten egg odors inside their homes on frequent occasions. They also
found black oily material oozing out of the ground either spontaneously or when digging in the soil around their property. The residents sought legal advice because they were concerned that there was a connection between the apparent residual oil field waste and the elevated SLE clus-ter in their neighborhood.
There was a tank battery and several active oil wells located directly to the west of the subdivision which con-tinued operating until 2000 (Figures 2 &3). The oil com-pany had installed a vapor recovery system for these oil wells and an acompanying tank battery to reduce vapors escaping from the storage tanks in 1969. When a lawsuit was filed the oil company investigated the area and based on the results of their investigation, closed down the tank battery and purchased the three homes closest to that tank battery site. The surface soil from the tank battery and home sites was transferred to a hazardous waste site because of very high Total Petroleum Hydrocarbons (TPH). Soil testing for metals, semi-volatiles and polycy-clic aromatic hydrocarbons (PAHs) at other nearby homes did not reveal levels high enough to oblige remediation. Both soil and air testing by the oil company and the experts retained by the plaintiffs' counsel revealed the presence of aromatic hydrocarbons including benzene, toluene, ethylbenzene, xylene, pristane and phytane. Peo-ple are still living in the remaining adjacent homes. We compared the health status of 90 residents along with their environmental and biomonitoring test results to a reference population.
Methods
Study designThis is a community comparison study that examines per-sons living in a subdivision exposed to petroleum
prod-American College of Rheumatology – The "Eleven Criteria" for diagnosis of SLE Figure 1
American College of Rheumatology – The "Eleven Criteria" for diagnosis of SLE. 1. Malar rash: butterfly-shaped rash across cheeks and nose
2. Discoid (skin) rash: raised red patches
3. Photosensitivity: skin rash as a result of unusual reaction to sunlight
4. Mouth or nose ulcers: usually painless
5. Non-erosive Arthritis (bones around joints do not get destroyed): in 2 or more joints with tenderness, swelling, or effusion
6. Cardio-pulmonary involvement: inflammation of the lining around the heart (pericarditis) and/or lungs (pleuritis)
7. Neurologic disorder: seizures and/or psychosis/cognitive dysfunction
8. Renal (kidney) disorder: excessive protein in the urine, or cellular casts in the urine
9. Hematologic (blood) disorder: hemolytic anemia, low white blood cell count, or low platelet count
10. Immunologic disorder: antibodies to double stranded DNA, antibodies to Sm (smooth Muscle), or antibodies to cardiolipin
ucts and mercury and compares their health status and questionnaire responses to those living in another com-munity with no known exposures of this type. A volunteer sample of 90 adults from the exposed neighborhood com-pleted a questionnaire and donated blood for the meas-urement of pristane, pristanic acid and phytane. We compared the environmental exposures and question-naire responses and pristane/phytane blood levels to those living in another community with no unusual expo-sures to these contaminants. We compared the observed prevalence of SLE in this community with values reported in the literature. Exposed study participants were all plain-tiffs in a lawsuit.
Setting and study populations
Exposed Population – Hobbs, New Mexico is a predomi-nantly Caucasian (63.5%) town of 28,657 residents located in Lea County on the southeast corner of New Mexico, 5 miles from the Texas border [16]. Hobbs was founded in 1907 as an agricultural and ranching commu-nity and became prominent after the discovery of oil in 1928. Hobbs is known as the oil capital of New Mexico
[17]. Numerous oil and gas wells are scattered throughout the area and this industry is the principal source of employment in Hobbs. We estimated a total population of 1490 residents in the study neighborhood by counting 532 homes and estimating 2.8 individuals in each house-hold. The bulk of the SLE cases are on two streets that roughly correspond to the location of the oil field waste pit until it was covered with fill dirt in the late 1960's. The study population of 90 adults had lived in the area for at least two years, and voluntarily enrolled in the study. We assumed that the rest of community did not have SLE.
Comparison Population – One hundred and twenty nine volunteers from a similar southwestern town without unusual chemical exposures were recruited through a church. We invited the members to participate in the study by filling out a questionnaire and volunteering to have blood drawn for biomonitoring. As with the exposed population, trained and experienced proctors adminis-tered a nearly identical questionnaire to all volunteers in small groups. The questionnaire differed only with respect to questions regarding exposure experiences unique to the
Photograph of Oil Field in Relation to Residents Homes Figure 2
Hobbs neighborhood. The control subjects were paid a small fee for their participation. The control town was matched for size, altitude, and demographics. The control population was not free of unusual petroleum hydrocar-bon exposure. Fifteen of the controls had been raised in Bakersfield a town similar to Hobbs with many nearby oil fields. Furthermore, the town is the site of a large railroad-switching yard. Given that Hobbs has a large Hispanic population we note some possible dietary issues specific to Hispanic populations (herbal teas, etc.).
Data collection
The questionnaire obtains data on demographics includ-ing age, gender, occupational and residential history as well as medical, social and behavioral history. Other top-ics covered in the questionnaire are health symptoms, dis-eases, surgeries, medications, family history, income, chemical exposures, and life style measures including smoking and alcohol drinking. One unlikely symptom question is designed to test for the veracity of the responses provided. Questionnaire responses are machine-readable, scanned on-site and verified before
subjects leave. This basic questionnaire has been used in prior studies of exposed and unexposed groups [18].
Case definition
We defined a case of SLE as an individual who had received a physician's diagnosis. We confirmed the diag-nosis with medical records to confirm that the diagdiag-nosis had been reached in accordance with American Rheuma-tology Association's "Eleven Criteria of Lupus" [12]. We excluded cases that were diagnosed within 6 months of moving to the neighborhood or cases that were diagnosed more than 5 years after moving away. This criteria for diagnosis is consistent with previously published studies [5,19].
Exposure assessment
House dust
We collected house dust samples from residents who per-mitted access to their homes. House dust samples were collected in the exposed and control community from 2/ 27/03 to 3/1/03 by Stone Lions Environmental Corpora-tion (Rolling Hills Estates, CA). A total of 19 house dust
Close up Photograph of Tank Battery in Relation to one of the two exposed Streets Figure 3
samples were collected in the exposed subdivision and three additional samples were taken about 2 miles north-east of the subdivision. Nine house dust samples were col-lected from the control community.
Stone Lions Environmental Corporation collected house dust samples using current state-of-the-art method for household dust sampling which involves using the HVS-3 forensic vacuum or a Sears Kenmore canister vacuum model 22085 sampling system. Dust was drawn into a new vacuum bag, which was removed after each house. The vacuum bags were immediately placed into a double Ziploc bag and labeled accordingly. Samples were col-lected in various places in each house depending on the availability of dust. The primary locations were attic, heater vents, windowsills, tops of furniture and appli-ances, tops of doorways and doorway frames, exposed shelves, and carpet (only for houses with minimal dust elsewhere). All cleaning and bag removal activities were performed while wearing powder free surgical gloves. The samples were analyzed for analytes, polycyclic aromatic hydrocarbons (PAHs), total petroleum hydrocarbons (TPH), radiochemistry, pristane and phytane. Metals, PAHs, and TPH were analyzed by West Coast Analytical Services (Santa Fe Springs, CA). Metals were analyzed using Inductively Coupled Plasma – Mass Spectrometry. PAHs were analyzed using EPA method 625/8270C/SIM. TPH were analyzed using EPA method 418.1. Radiochem-istry was analyzed at Fruit Growers Laboratory (Santa Paula, CA) using 901.0 (Gamma isotopic and 9310 (Radi-ochemistry). Pristane and phytane exposures were ana-lyzed at Humble Geochemical Services (Humble, Texas) using high-resolution gas chromatography. This method to measure and quantify pristane and phytane in crude oil is standard in the petroleum industry. The petroleum industry uses pytane/pristane fingerprints to determine the source of crude oil.
Air monitoring
An ambient air monitoring station for volatiles and reduced sulfur compounds was established at a site located directly on the old waste pit in the exposed subdi-vision. The site was located on a front lawn within a 10 by 10 foot chain link fence. Silica-lined Summa canisters were used to collect 24 ambient air samples on a schedule of approximately once every six days. The first sample was collected on October 18th, 2002 and the final sample was
collected on February 11th, 2003. Over that period of five
months, nineteen 24-hour samples were collected includ-ing one field blank. Canister preparation and sample analyses were performed by Zymax Envirotechnology (San Luis Obispo, California). Each sample was analyzed for volatile organic compounds (VOCs) and reduced sul-fur compounds. VOCs were analyzed using EPA method TO-14 GC/FPD.
A meteorological station (Davis Instruments) was installed at the same location as the ambient air-monitor-ing site. Instruments measurair-monitor-ing wind speed, wind direc-tion, ambient temperature, pressure, relative humidity and rainfall were mounted on a two-meter tower. Those parameters were recorded at half-hour intervals for the duration of the ambient air-monitoring period.
Mercury ambient air testing
The Lumex Zeeman Mercury Analyzer RA-915+ was used to measure the ambient air concentration of mercury from various locations inside and outside the homes in both the exposed and control communities. 30-second ambi-ent air samples were taken in the cambi-enter of each room and on the front porch.
Biomonitoring
General health screening panel
A trained phlebotomist collected blood and urine from volunteers from both the exposed and control communi-ties. One tiger top, two lavender tops and one grey top (for urine) was shipped overnight on ice to Pacific Toxicology Laboratories (Woodland Hills, California) for analyses. A complete blood count, chemistry panel and a urinalysis were performed using standard laboratory techniques.
Lymphocyte subpopulation analysis
The Lymphocyte Subpopulation Analysis (Enumeration Panel) was done to estimate the distribution of the com-mon lymphocytes. A trained phlebotomist collected one yellow top of blood from both exposed and control par-ticipants and shipped overnight on ice to Immunoscience Laboratories (Beverly Hills, California)
Pristane and phytane
Data analysis
Unadjusted frequencies and percents for age, gender, eth-nicity, smoking status and education are presented for exposed and unexposed populations. P-values for the unadjusted differences in percents between the two groups were estimated using the Pearson chi square test. Odds ratios and 95% confidence intervals are estimated for binary health outcomes using logistic regression to compare exposed and unexposed populations while con-trolling for age, gender, education and race/ethnicity. The Hosmer and Lemeshow goodness-of-fit test (Hosmer and Lemeshow 1989) for the case of a binary response model was performed for each model. In this procedure, the sub-jects are divided into approximately ten groups of roughly the same size based on the percentiles of the estimated probabilities. The discrepancies between the observed and expected number of observations in these groups are sum-marized by the Pearson chi-square statistic, which is then compared to a chi-square distribution with t degrees of freedom, where t is the number of groups minus n. By default, n = 2. A small p-value suggests that the fitted model is not an adequate model.
Odds ratio and confidence intervals are estimated for those health outcomes where the response possibilities
include a scale from 1 to 11 using multinomial logistic regression models. The odds ratio is interpreted as the odds of the exposed reporting a higher response from the 1 – 11 scale compared to the unexposed. All the ordinal outcome variables were fit into the ordinal logistic model and the goodness of fit was tested using the chi-square sta-tistic.
All statistical analyses were performed using SAS 8.0.
Results and discussion
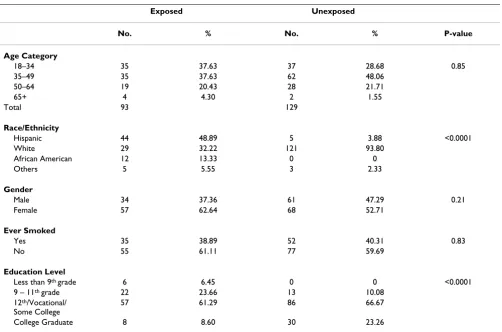
Ninety adult volunteers from the exposed community and 129 adults from the comparison community participated in the study (Table 1). The age, gender and smoking his-tory (ever/never) were similar between the two groups. The exposed population was more diverse in terms of race/ethnicity; the comparison group was Caucasian. Level of education was higher in the comparison group.
Environmental measures
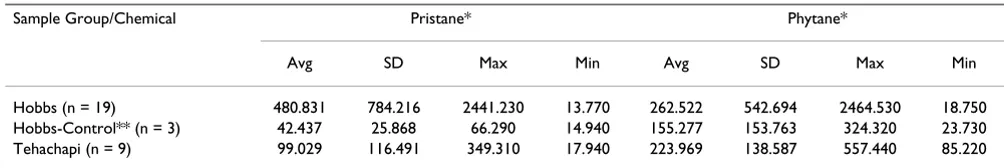
House dust samples for pristane and phytane were higher in the exposed homes (Table 2). Pristane and phytane were found in every sample tested from both the exposed and unexposed communities, however, significantly higher values were found in the exposed community.
Pris-Table 1: Demographic frequencies in Hobbs* and in a control community**
Exposed Unexposed
No. % No. % P-value
Age Category
18–34 35 37.63 37 28.68 0.85
35–49 35 37.63 62 48.06
50–64 19 20.43 28 21.71
65+ 4 4.30 2 1.55
Total 93 129
Race/Ethnicity
Hispanic 44 48.89 5 3.88 <0.0001
White 29 32.22 121 93.80
African American 12 13.33 0 0
Others 5 5.55 3 2.33
Gender
Male 34 37.36 61 47.29 0.21
Female 57 62.64 68 52.71
Ever Smoked
Yes 35 38.89 52 40.31 0.83
No 55 61.11 77 59.69
Education Level
Less than 9th grade 6 6.45 0 0 <0.0001
9 – 11th grade 22 23.66 13 10.08
12th/Vocational/
Some College
57 61.29 86 66.67
College Graduate 8 8.60 30 23.26
tane house dust among the exposed homes was higher than in the comparison communities. House dust sam-ples for mercury were not elevated in exposed homes (data not shown).
Air sampling by the oil company for pristane and phytane in the exposed neighborhood during both at baseline and soil removal operations consistently showed positive val-ues (Table 3). The baseline air sampling was conducted in July of 2001. The air samples were taken during the reme-diation that lasted approximately 6 months starting in March of 2002. The SVOC samples were obtained in the exposed subdivision at 6 sites.
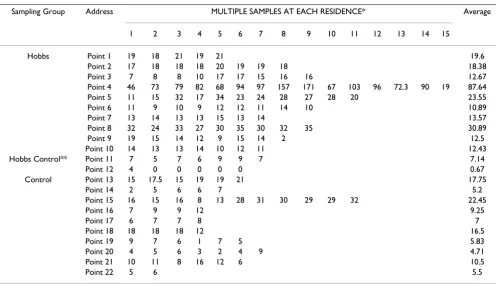
Results of ambient mercury air measurements are dis-played in Table 4. Outdoor air blanks (front porch read-ings) were consistently much lower than indoor values. Data is not shown. Summary of the ambient mercury air measurements are displayed in Table 5. The exposed sub-division has nearly 6.2 times higher mercury levels com-pared to other locations in Hobbs located two miles away and nearly 2.5 times higher mercury levels compared to the control community.
Biomonitoring
One of twenty-five (4.0%) from the comparison subjects and five of twenty (25%) from the exposed who were tested had detectable positive blood levels for pristane, phytane and/or pristanic acid. Each subject who had a detectable level of pristane, phytane and/or pristanic acid also had either a frank diagnosis of lupus or common symptoms associated with immune system disorders. The students' t-test produces a p-value of < 0.05 for this differ-ence.
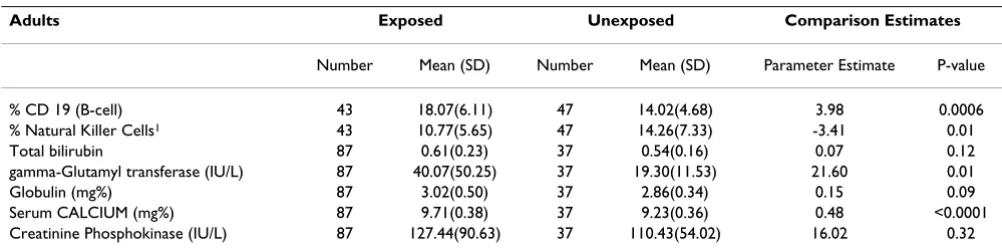
Blood samples were obtained from 97% (87/90) of the exposed subjects. Forty-three of 90 (47%) exposed sub-jects and 37/129 (28%) unexposed subsub-jects agreed to pro-vide additional vials of blood for natural killer cell and CD 19 (B cell) analysis. Ten additional control subjects participated only in the natural killer cell and CD 19 (B
cell) analysis (Table 6). There were biologically and statis-tically significant differences in B cells, Natural Killer Cells, gamma glutamyl transferase, globulin and serum calcium levels. Creatinine Phosphokinase (CPK) was not significantly different for the overall group; however, an examination of blood results for men only reveals the mean value in the exposed population is 220 versus 139 in the comparison group. Five of the nineteen exposed males (26.3%) had CPK above the laboratory normal of 269 IU/L and none of the comparison men were above that value. There was no influence by alcohol or other fac-tors.
Disease prevalence and symptoms
Hosmer and Lemeshow tests were performed on all of the outcomes modeled with logistic regression. All of the p-values are between 0.22 and 0.99. These results indicate that the data fit the model adequately in each case. For data scaled data modeled with multinomial logistic regression, the chi-square test for goodness of fit indicated an appropriate fit for each of the modeled outcomes.
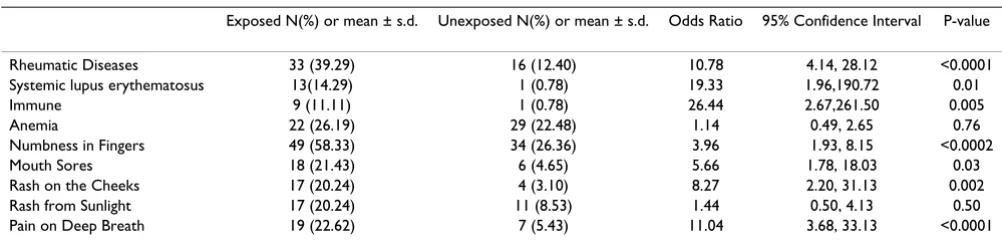
Lupus cases were confirmed by both phone call follow up and review of medical records (Table 7). The prevalence of rheumatic diseases and lupus was greater in the exposed population compared to the unexposed (OR = 10.78; CI = 4.14, 28.12 and 19.33; 1.96, 190.72, respectively) (Table 8). The wide confidence interval for lupus reflects the sin-gle case found in the unexposed community. Increased prevalences of symptoms thought to be predictive of autoimmune disorder were found in the exposed commu-nity including: numb fingers, mouth sores, and persistent rash on the cheeks and pain on deep breath.
The presence of neurological symptoms was elevated in the exposed community including: dizziness, lighthead-edness, loss of balance, extreme fatigue, sleep disorders, lack of concentration and memory loss (Table 9).
A higher prevalence of several cardiovascular problems occurred in the exposed population including stroke and
Table 2: Results for pristane and phytane house-dust sampling for Hobbs, Hobbs-Control, and Control Community.
Sample Group/Chemical Pristane* Phytane*
Avg SD Max Min Avg SD Max Min
Hobbs (n = 19) 480.831 784.216 2441.230 13.770 262.522 542.694 2464.530 18.750
Hobbs-Control** (n = 3) 42.437 25.868 66.290 14.940 155.277 153.763 324.320 23.730
Tehachapi (n = 9) 99.029 116.491 349.310 17.940 223.969 138.587 557.440 85.220
* results in ppm
** Samples collected 2 miles outside of the Westgate Subdivision AVG – Average
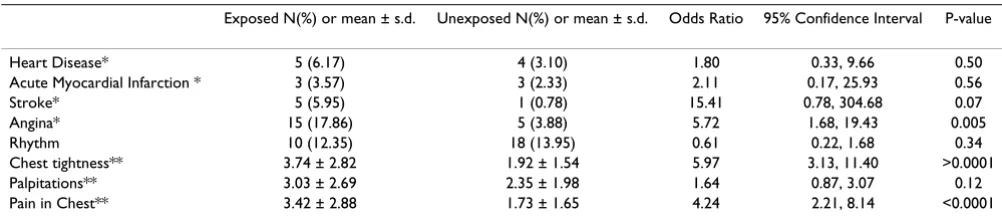
angina (OR = 15.41; CI = 0.78, 304.68 and 5.72; 1.68, 19.43, respectively) chest tightness and pain in the chest (Table 10). Again, the wide confidence interval for stroke reflects the paucity of stroke sufferers in the comparison community. No difference was found for the overall measure of heart disease or myocardial infarction.
Respiratory symptoms were significantly elevated in the exposed population including shortness of breath and wheezing, cough with blood or mucus, dry cough and chronic bronchitis (Table 11).
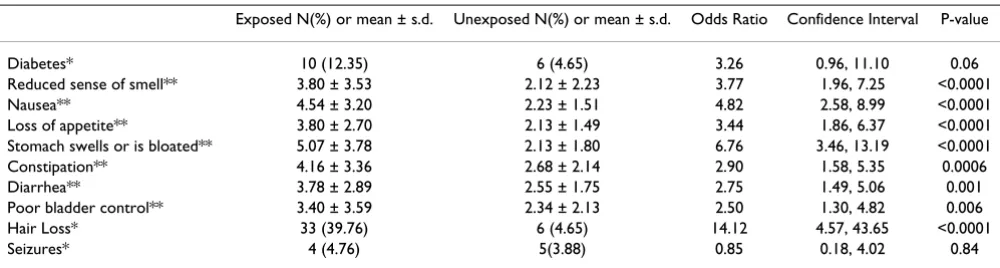
Other elevated symptoms include gastrointestinal prob-lems like diarrhea, constipation, nausea, stomach
swell-ing and loss of appetite (Table 12). Diabetes was also more prevalent in the exposed population; the difference nearly reached the level of statistical significance at the 0.05 level (OR = 3.26, CI = 0.96, 11.10; p-value = 0.06).
Discussion
We not only observed a significantly increased prevalence of SLE but also an increase of cardiovascular, neurological and respiratory problems in this subdivision of Hobbs, New Mexico. The literature reports a prevalence for SLE that varies from 14.6 to 50.8 cases/100,000. The highest rates are seen in African Americans [4,20-22]. If all the cases reported here in this one neighborhood were the only cases in the entire town of Hobbs, we would have a
Table 4: Results for ambient air mercury sampling for Hobbs, Hobbs-Control, and Control Community.
Sampling Group Address MULTIPLE SAMPLES AT EACH RESIDENCE* Average
1 2 3 4 5 6 7 8 9 10 11 12 13 14 15
Hobbs Point 1 19 18 21 19 21 19.6
Point 2 17 18 18 18 20 19 19 18 18.38
Point 3 7 8 8 10 17 17 15 16 16 12.67
Point 4 46 73 79 82 68 94 97 157 171 67 103 96 72.3 90 19 87.64
Point 5 11 15 32 17 34 23 24 28 27 28 20 23.55
Point 6 11 9 10 9 12 12 11 14 10 10.89
Point 7 13 14 13 13 15 13 14 13.57
Point 8 32 24 33 27 30 35 30 32 35 30.89
Point 9 19 15 14 12 9 15 14 2 12.5
Point 10 14 13 13 14 10 12 11 12.43
Hobbs Control** Point 11 7 5 7 6 9 9 7 7.14
Point 12 4 0 0 0 0 0 0.67
Control Point 13 15 17.5 15 19 19 21 17.75
Point 14 2 5 6 6 7 5.2
Point 15 16 15 16 8 13 28 31 30 29 29 32 22.45
Point 16 7 9 9 12 9.25
Point 17 6 7 7 8 7
Point 18 18 18 18 12 16.5
Point 19 9 7 6 1 7 5 5.83
Point 20 4 5 6 3 2 4 9 4.71
Point 21 10 11 8 16 12 6 10.5
Point 22 5 6 5.5
* 30-second averages, results in nanograms per cubic meter **Samples collected 2 miles outside of the Westgate Subdivision
Table 3: Air monitoring data for pristane, phytane and PAHs taken at baseline and during trenching operations*
Summary Statistics for SVOC Air Monitoring – Baseline
Summary Statistics for SVOC Analysis of Air – Trenching Operations
Compound Concentration (ng/m3) Concentration (ng/m3)
Minimum Maximum Mean Minimum Maximum Mean
Phytane 6.10 145 37.7 7.85 83.9 43.1
Pristane 4.43 182 50.5 8.21 110 41.9
Total PAH 57.0 655 178 89.4 769 224
SLE prevalence of 45 cases/100,000 (13 cases/28,657). However, that method of calculation would most likely be inaccurate because there are no doubt other SLE cases in Hobbs. Thirteen SLE cases are found on two blocks alone. This two-block area was on or near the site of the oil field waste pit and presumably would reflect a higher exposure than other areas. Taking only the exposed neigh-borhood we obtain a lupus prevalence of 872/100,000 (13 cases/1490 [532 homes × 2.8 individuals in each household]). In addition to the diagnosed SLE, there is an increased prevalence of reported immunologic symptoms and or problems in the exposed population compared to controls. Rheumatic disease is 10 times more likely; SLE is 10 times more likely in the exposed compared to their unexposed counterparts. Other symptoms common among those with immune problems are also reported with increased frequency in the exposed population including mouth sores, numbness, and rash.
The magnitude of the prevalence of SLE may be under-stated for three reasons. First there were other possible SLE cases however we could not confirm a physician diagnosis in their medical records. Second we compared the preva-lence using the highest-available expected estimates for
prevalence to be conservative. Third, we did not collect data on the entire subdivision or town; therefore we may not have identified all the cases of SLE, even in the exposed subdivision.
In addition to the finding of a significant increase in the prevalence of SLE in the exposed neighborhood the lym-phocyte testing of the exposed population's immune sys-tem shows significant abnormality compared with the controls. The lymphocyte population of the exposed resi-dents is not normal. Natural Killer Cells (NKC) are signif-icantly lower in the exposed population. Analysis of B-lymphocytes shows that the exposed population has sig-nificantly higher B-lymphocytes compared to controls. This finding is consistent with the known compensatory effects of B cells when other lymphocytes are inhibited. The natural killer cells are reduced causing compensatory changes in B-cells. Such a decrease of an essential compo-nent of the body's immune cells indicates a potentially significant impairment with implications for increased susceptibility to infection and cancer. The data presented here reports for the first time an adverse effect on lym-phocytes numbers associated with environmental expo-sures to oil field waste. The spectrum of long-term health effects arising from this exposure will require long-term follow-up. At the very least this data demonstrates a per-turbation of the immune system, which in concert with the finding of a significant cluster of SLE indicates that the exposure in this neighborhood is likely have additional effects on the residents, even those who have not been diagnosed with SLE. We are attempting to further charac-terize the immunological defect that is present in these residents.
Calcium is tightly regulated in the body because it is an essential mineral in many body functions. Even slight changes in serum calcium reflect alterations in hormone balance. In this case, there is a significantly higher serum calcium level in the exposed population. This finding reflects differences in hormone balance and is consistent
Table 6: Ordinary least squares regression analysis comparing blood results between exposed and unexposed, controlling for age.
Adults Exposed Unexposed Comparison Estimates
Number Mean (SD) Number Mean (SD) Parameter Estimate P-value
% CD 19 (B-cell) 43 18.07(6.11) 47 14.02(4.68) 3.98 0.0006
% Natural Killer Cells1 43 10.77(5.65) 47 14.26(7.33) -3.41 0.01
Total bilirubin 87 0.61(0.23) 37 0.54(0.16) 0.07 0.12
gamma-Glutamyl transferase (IU/L) 87 40.07(50.25) 37 19.30(11.53) 21.60 0.01
Globulin (mg%) 87 3.02(0.50) 37 2.86(0.34) 0.15 0.09
Serum CALCIUM (mg%) 87 9.71(0.38) 37 9.23(0.36) 0.48 <0.0001
Creatinine Phosphokinase (IU/L) 87 127.44(90.63) 37 110.43(54.02) 16.02 0.32
1. Natural Killer Cells = CD16 + 56+/CD45+ SD = Standard Deviation
Table 5: Summary Results for ambient air mercury sampling for Hobbs, Hobbs-Control, and Control Community.
Sample Group/Chemical Mercury*
Avg SD Max Min
Hobbs 24.21 31.34 171.00 2.00
Hobbs-Control** 3.90 3.67 9.00 0.00
Tehachapi 10.47 8.08 32.00 1.00
* 30-second averages, results in nanograms per cubic meter **Samples collected 2 miles outside of the Westgate Subdivision AVG – Average
with the endocrine disrupting effects of environmental pollutants. In this case the chemical agent or agents that may explain this phenomenon are unknown.
Creatinine Phosphokinase (CPK) is an enzyme, which appears in the blood. Elevations of this enzyme indicates damage to either heart, brain or muscle tissue The cause of the elevated CPK in the exposed males is another objective indication of adverse effects in the residents most logically as a result of their environmental exposure to oil field waste. As with the disruption of calcium metabolism the chemical agents responsible are unknown. In our experi-ence CPK is often elevated in patients with exposure to neurotoxic agents. It is likely that the source of the ele-vated serum CPK in this case is from damage to the nerv-ous tissue.
The residents in the exposed community were exposed to higher than usual background levels of various hydrocar-bons including benzene, xylene, toluene, pristane, phy-tane and polycyclic aromatic hydrocarbons (PAHs). We found higher levels of air mercury and house dust pris-tane/phytane in the affected neighborhood compared to other areas of Hobbs and the control town. Mercury is
very volatile and so the major route of exposure would be through vapor inhalation. Pristane/phytane on the other hand is not volatile and it would be expected to be higher in the house dust.
Mercury is one of the few chemicals that are conclusively known to cause adverse immune system disruption in ani-mals and humans. Exposure to mercury can depress or stimulate the immune system [23]. Inorganic mercury salt poisoning which was once a common cause of renal fail-ure is now less common [24]. Recent research has been done on the adverse effects of mercury on various compo-nents of the immune system [25-31]. Some strains of rodents develop autoimmunity upon very low exposure to mercury while other strains are not affected [9,23,32,33]. This finding reveals a key element to under-standing mercury toxicity and the immune system. Only those persons with the susceptibility will develop the dis-ease. The occurrence of autoimmunity in animal studies depends on the dose, chemical form or strain of animal. Animal studies show that low doses of mercury damages T cells, leads to immune system dysfunction and induces autoimmunity [9,34-47]. The immune reaction in humans to mercury exposure is varied. Humans have
Table 8: Estimated odds ratios and confidence intervals for autoimmune disorders comparing residents to controls
Exposed N(%) or mean ± s.d. Unexposed N(%) or mean ± s.d. Odds Ratio 95% Confidence Interval P-value
Rheumatic Diseases 33 (39.29) 16 (12.40) 10.78 4.14, 28.12 <0.0001 Systemic lupus erythematosus 13(14.29) 1 (0.78) 19.33 1.96,190.72 0.01 Immune 9 (11.11) 1 (0.78) 26.44 2.67,261.50 0.005 Anemia 22 (26.19) 29 (22.48) 1.14 0.49, 2.65 0.76 Numbness in Fingers 49 (58.33) 34 (26.36) 3.96 1.93, 8.15 <0.0002 Mouth Sores 18 (21.43) 6 (4.65) 5.66 1.78, 18.03 0.03 Rash on the Cheeks 17 (20.24) 4 (3.10) 8.27 2.20, 31.13 0.002 Rash from Sunlight 17 (20.24) 11 (8.53) 1.44 0.50, 4.13 0.50 Pain on Deep Breath 19 (22.62) 7 (5.43) 11.04 3.68, 33.13 <0.0001
*Odds ratio and confidence intervals are estimated using logistic regression Controlled for age, gender, race/ethnicity, education and smoking history Table 7: Exposure information for Lupus cases in Westgate Subdivision
Patient From Age To Age Total years Gender Date of Birth (age)
1 43 Present 14 Female 8/21/45 (57)
2 26 Present 22 Female 11/6/54 (48)
3 11 22 11 Female 1/4/76 (27)
4 30 Present 19 Female 1/23/54 (49)
5 37 Present 12 Female 7/3053 (49)
6 31 45 14 Male 6/7/56 (46)
7 33 35 2 Female 8/7/45 (57)
8 38 43 5 Female 12/4/39 (63)
9 28 30 2 Female 1/21/63 (40)
10 62 72 10 Female 12/20/26 (76)
11 18 40 22 Female 4/20/59 (43)
12 35 49 14 Female 9/23/51 (51)
increased activity of the immune system leading to autoimmunity [48] or sensitivities to the environment [49,50]. On the other hand there can be immune suppres-sion with decreases in immune defenses such as macro-phage function [51]. Low-level chronic exposure to mercury has been associated with Crohn's disease, endometriosis, lupus, and other autoimmune processes [8,28,52]. There have been case reports linking mercury to autoimmune disease in humans and a recent epidemio-logic study of occupational risk factors for SLE identified mercury as a potential causal agent (OR = 3.6; 95% CI = 1.3,10) [7-9].
Cooper's epidemiologic study of human exposure to mer-cury reveals increased rates of immunologic disease. Asso-ciations were seen with self-reported occupational exposure to mercury (OR = 3.6; 95% CI = 1.3, 10.0) and reported a significantly increased prevalence of SLE
among dental workers (OR = 7.1; 95% CI = 2.2, 23.4) [7]. None of our subjects had been dental workers. Mercury's presence can be explained in this community by mercury presence in crude oil and its use in instruments found in oil fields [53-55]. Studies have implicated residents living near industrial emissions or environmental contamina-tion to increased prevalence of SLE [5,6].
In 1976, Cancro and Potter injected mineral oil or the pure alkane pristane into mice [56]. Cancro and Potter reported that in as little as three days plasmacytosis was evident [56]. Pristane injected into a rat also induces arthritis [57-61]. In certain strains of mice. pristane expo-sure is known to induce autoimmunity and systemic lupus erythematosus [12,13,62-73]. Satoh in 2000 reported that pristane was able to induce lupus in virtually any strain of mouse regardless of its genetic background [13]. Phytane is also likely to have a similar effect because
Table 10: Odds ratios and confidence intervals for cardiovascular disorders between exposed and unexposed residents.
Exposed N(%) or mean ± s.d. Unexposed N(%) or mean ± s.d. Odds Ratio 95% Confidence Interval P-value
Heart Disease* 5 (6.17) 4 (3.10) 1.80 0.33, 9.66 0.50 Acute Myocardial Infarction * 3 (3.57) 3 (2.33) 2.11 0.17, 25.93 0.56 Stroke* 5 (5.95) 1 (0.78) 15.41 0.78, 304.68 0.07 Angina* 15 (17.86) 5 (3.88) 5.72 1.68, 19.43 0.005 Rhythm 10 (12.35) 18 (13.95) 0.61 0.22, 1.68 0.34 Chest tightness** 3.74 ± 2.82 1.92 ± 1.54 5.97 3.13, 11.40 >0.0001 Palpitations** 3.03 ± 2.69 2.35 ± 1.98 1.64 0.87, 3.07 0.12 Pain in Chest** 3.42 ± 2.88 1.73 ± 1.65 4.24 2.21, 8.14 <0.0001
*Odds ratio and confidence intervals are estimated using logistic regression
** Odds ratio and confidence intervals are estimated using multinomial logistic regression models with generalized estimating equations (GEE); odds ratio interpreted as the odds of exposed being in a higher category compared to unexposed. Respondents were asked to "score each question on a scale of 1 – 11, one representing never and 11 representing always.
Controlled for age, gender, race/ethnicity, education and smoking history
Table 9: Odds ratios and confidence intervals for neurologic and behavioral disorders comparing exposed and unexposed residents
Exposed N(%) or mean ± s.d.
Unexposed N(%) or mean ± s.d.
Odds Ratio 95% Confidence Interval P-value
Dizziness* 4.40 ± 3.10 2.25 ± 1.96 4.42 2.37, 8.24 <0.0001
Lightheadedness* 4.85 ± 3.12 2.65 ± 1.81 5.02 2.69, 9.34 <0.0001
Loss of balance* 3.68 ± 3.07 2.24 ± 1.73 2.83 1.53, 5.22 0.0009
Extreme fatigue* 6.97 ± 3.69 3.12 ± 2.40 11.50 5.94, 22.28 <0.0001
Somnolence* 5.08 ± 3.76 2.11 ± 1.86 4.99 2.66, 9.36 <0.0001
Can't fall asleep* 4.79 ± 3.79 2.89 ± 2.50 1.94 1.06, 3.54 0.03
Wake up frequently* 5.12 ± 3.79 2.91 ± 2.55 3.98 2.16, 7.36 >0.0001
Sleep soundly for only a few hours* 4.83 ± 3.59 2.81 ± 2.51 4.00 2.16, 7.40 >0.0001
Lack of concentration* 5.70 ± 3.73 3.76 ± 2.66 2.67 1.47, 4.84 0.001
Recent memory loss* 5.22 ± 3.82 3.76 ± 2.66 2.87 1.58, 5.23 0.0006
Decreased libido* 4.36 ± 4.00 2.92 ± 2.35 3.00 1.60, 5.59 0.0006
When driving in familiar areas, do you ever get lost or go the wrong way *
2.67 ± 2.73 1.55 ± 1.33 3.05 1.54, 6.08 0.002
* Odds ratio and confidence intervals are estimated using multinomial logistic regression models with generalized estimating equations (GEE); odds ratio interpreted as the odds of exposed being in a higher category compared to unexposed. Respondents were asked to "score each question on a scale of 1 – 11, one representing never and 11 representing always.
of its similar structure and toxicity [72]. Pristane is a likely candidate to be an environmental trigger for SLE in sus-ceptible sub-populations. The authors wrote in their paper "Finally, it may be worth noting that pristane is found in mineral oil, shark oil, and many foods, raising the possibility that environmental exposure to pristane could be involved in the pathogenesis of some cases of human SLE" [12].
It has been demonstrated that both pristane and mercury will alter immune system function [57,58,74,75]. We are not aware of any human cases of pristane induced SLE, this study should encourage further research on autoim-mune diseases and environmental exposures.
The fact that all of the subjects with pristane or phytane in their blood have significant autoimmune diseases or symptoms of autoimmune disease is consistent with the animal models implicating pristane as a causal factor in the development of SLE. Interestingly, the one control subject with pristane and phytane in her blood reported a rash after being in the sun and also a diagnosis of pleurisy. These two symptoms are often antecedent to developing lupus.
Some researchers question whether reliable data can be obtained from participants involved in litigation. While it is claimed that litigants exaggerate their symptoms we know of no evidence that this is true, particularly when
Table 12: Odds ratios and confidence intervals for other disorders between exposed and unexposed residents
Exposed N(%) or mean ± s.d. Unexposed N(%) or mean ± s.d. Odds Ratio Confidence Interval P-value
Diabetes* 10 (12.35) 6 (4.65) 3.26 0.96, 11.10 0.06
Reduced sense of smell** 3.80 ± 3.53 2.12 ± 2.23 3.77 1.96, 7.25 <0.0001
Nausea** 4.54 ± 3.20 2.23 ± 1.51 4.82 2.58, 8.99 <0.0001
Loss of appetite** 3.80 ± 2.70 2.13 ± 1.49 3.44 1.86, 6.37 <0.0001
Stomach swells or is bloated** 5.07 ± 3.78 2.13 ± 1.80 6.76 3.46, 13.19 <0.0001
Constipation** 4.16 ± 3.36 2.68 ± 2.14 2.90 1.58, 5.35 0.0006
Diarrhea** 3.78 ± 2.89 2.55 ± 1.75 2.75 1.49, 5.06 0.001
Poor bladder control** 3.40 ± 3.59 2.34 ± 2.13 2.50 1.30, 4.82 0.006
Hair Loss* 33 (39.76) 6 (4.65) 14.12 4.57, 43.65 <0.0001
Seizures* 4 (4.76) 5(3.88) 0.85 0.18, 4.02 0.84
*Odds ratio and confidence intervals are estimated using logistic regression
** Odds ratio and confidence intervals are estimated using multinomial logistic regression models with generalized estimating equations (GEE); odds ratio interpreted as the odds of exposed being in a higher category compared to unexposed. Respondents were asked to "score each question on a scale of 1 – 11, one representing never and 11 representing always.
Controlled for age, gender, race/ethnicity, education and smoking history
Table 11: Odds ratios and confidence intervals for respiratory disorders between exposed and unexposed residents
Exposed Unexposed 95%
N(%) or mean ± s.d. N(%) or mean ± s.d. Odds Ratio Confidence Interval P-value
Pneumonia* 11(13.58) 18(13.95) 1.19 0.45, 3.15 0.72
Pleurisy* 5 (6.33) 4 (3.10) 1.48 0.29, 7.61 0.64
Chronic bronchitis* 16 (19.75) 3 (2.33) 17.4 4.06, 74.35 0.0001
Dry cough** 4.64 ± 3.21 2.36 ± 1.74 5.06 2.67, 9.60 <0.0001
Cough with mucous** 4.73 ± 3.51 2.79 ± 1.75 2.6 1.43, 4.73 0.002
Cough with Blood** 2.30 ± 2.55 1.11 ± 0.45 11.8 4.33, 32.03 <0.0001
Asthma Diagnosed by MD* 11 (13.41) 17 (13.18) 2.13 0.78, 5.82 0.14
Rhinitis* 24 (29.63) 21 (16.28) 3.45 1.49, 8.01 0.004
Sinusitis range** 4.57 ± 3.71 2.50 ± 1.91 2.62 1.43, 4.79 0.002
Short of Breath at Rest* 23 (27.38) 4 (3.10) 11.3 3.11, 40.98 0.0002
Short of Breath on Walking* 40 (48.19) 6 (4.65) 34.3 10.52, 112.09 <0.0001
Short of Breath Climbing Stairs* 52 (62.65) 34 (26.36) 6.17 2.81, 13.56 <0.0001
Wheezing* 24 (28.57) 7 (5.43) 19.2 5.59, 65.98 <0.0001
*Odds ratio and confidence intervals are estimated using logistic regression
** Odds ratio and confidence intervals are estimated using multinomial logistic regression models with generalized estimating equations (GEE); odds ratio interpreted as the odds of exposed being in a higher category compared to unexposed. Respondents were asked to "score each question on a scale of 1 – 11, one representing never and 11 representing always.
examining averaged group responses. A study by the Agency for Toxic Substance and Disease Registry (ATSDR) revealed no evidence of "litigation bias" among subjects being followed for health effects from trichloroethylene in their drinking water with no statistically significant differ-ence in the validity of the survey responses from litigant versus non-litigant populations [76]. These authors write, "Litigants are no more likely than non-litigant(s) to pro-vide inaccurate or exaggerated responses."
Observational bias is unlikely to influence these results because the techniques used to collect the data do not require interpretation. In addition, there is no indication that there would have been differential bias in this regard. The questionnaires were filled out in a neutral environ-ment supervised by trained proctors. All subjects were given the same instructions. Recall bias is also unlikely to affect the results, particularly when it comes to lupus. Most people who were ever diagnosed with this disease would never forget it.
Conclusion
Despite some possible limitations, the findings in this study are compelling. The hypothesis that environmental toxins may induce lupus is consistent with the known ability of certain medications to cause SLE [77-79]. There exists a plausible biological basis for such an association [80]. Examples include the association of prolonged sil-ica-dust exposure with scleroderma [81], the occurrence of Raynaud's phenomenon, sclerodermatous skin changes, and acroosteolysis among vinyl chloride workers [82,83].
This study adds to the evidence implicating pristane and mercury in the development of lupus and generates ques-tions as to the possible synergistic effects of organic sol-vents including pristane and phytane, mercury and other exposures. Further research is needed to determine the mechanism of effect for each of the suspected causal expo-sures and to assess possible synergy between expoexpo-sures.
Competing interests
The author was first hired by a law firm to investigate, however the law case has been dropped for several years, therefore the authors declare that they have no competing interests.
Authors' contributions
JD conceived of the study and supervised all aspects of its implementation and reviewed drafts of the manuscript; HT and PAM assisted in writing the manuscript; JK com-pleted the analysis; JT carried out the environmental test-ing and participated in drafttest-ing the manuscript; and RW assisted in the design of the study.
Acknowledgements
We thank Dr. Marilyn Zwass for her help in reviewing a previous draft. We would also like to thank Elaine Nitta for her help on the manuscript.
References
1. Cohen : Preliminary criteria for the classification of systemic lupus erythematosus. Bull Rheum Dis 1971, 21(9):643-648. 2. ACR: Guidelines for referral and management of systemic
lupus erythematosus in adults. American College of Rheu-matology Ad Hoc Committee on Systemic Lupus Erythema-tosus Guidelines. Arthritis Rheum 1999, 42:1785-1796.
3. Hopkinson ND: Epidemiology of systemic lupus erythemato-sus. Ann Rheumatol Dis 1992, 51:1292-1294.
4. Fessel WJ: System lupus erythematosus in the community.
Arch Int Med 1974, 134:1027-1035.
5. Kardestuncer T, Frumkin H: Systemic lupus erythematosus inrelation to environmental pollution: An investigation in an African-American community in North Georgia. Arch Environ Health 1997, 52(2):85-90.
6. Balluz L, Philen R, Ortega L, Rosales C, Brock J: Investigation of Systemic Lupus Erythematosus in Nogales, Arizona. Am J Epi-demiol 2001, 154:1029-1034.
7. Cooper GS, Parks CG, Treadwell EL, St Clair EW, Gilkeson GS, Doo-ley MA: Occupational risk factors for the development of sys-temic lupus erythematosus. J Rheumatol 2004,
31(10):1928-1933.
8. Yoshida S, Gershwin ME: Autoimmunity and selected environ-mental factors of disease induction. Semin Arthritis Rheum 1993,
22:399-419.
9. Bagenstose L, Salgame P, Monestier M: Murine Mercury-Induced Autoimmunity. Immunol Res 1999, 20:67-78.
10. Mayes MD: Epidemiologic Studies of Environmental Agent-sand Systemic Autoimmune Diseases. Environ Health Perspect 1999, 107:743-748.
11. Pollard KM, Pearson DL, Hultman P, Hildebrandt B, Kono : Lupus Prone Mice as models to study xenobiotic-induced accelera-tion of systemic autoimmunity. Environ Health Perspect 1999,
107(Suppl 5):729-735.
12. Satoh M, Hamilton K, Ajmani A, Dong X, Wang J, Kanwar Y, Reeves W: Autoantibodies to Ribosomal P Antigens with Immune Complex Glomerulonephritis in SJL Mice Treated with Pris-tane. J Immunol 1996, 157(7):3200-3206.
13. Satoh M, Richards HB, Shaheen VM, Yoshida H, Shaw M, Naim JO, Wooley PH, Reeves WH: Widespread susceptibility among inbred mouse strains to the induction of lupus autoantibod-ies by pristane. Clin Exp Immunol 2000, 121(2):399-405. 14. Satoh M, Reeves W: Induction of Lupus-Associated
Autoanti-bodies in BALB/c Mice by Intraperitoneal Injection of Pris-tane. J Exp Med 1994, 180:2341-2346.
15. Weening JJ, Hoedmaeker J, Bakker WW: Immunoregluation and anti-nuclear antibodies in mercury-induced glomerulopathy in rat. Clin Exp Immunol 1981, 45:64-71.
16. Census, 2005 Website – Census 2005 [http://quickfacts.cen sus.gov/qfd/states/35/3532520.html]
17. Hobbs Web Site, 2005 Web Site – Hobbs [http://www.relo cate-america.com/states/NM/cities/hobbs.htm]
18. Dahlgren J, Warshaw R, Thornton J, Anderson-Mahoney CP, Takhar H: Health effects on nearby residents of a wood treatment plant. Environ Res 2003, 92(2):92-98.
19. Freni-Titulaer LWJ, Kelley DB, Grow AG, McKinley TW, Arnett FC, Hochberg MC: Connective Tissue disease in southeastern Georgia: a case control study of etiological factors. Am J Epi-demiol 1989, 130:404-409.
20. Siegel M, Holly HL, Lee SL: Epidemiological studies on systemic lupus erythematosus: comparative data for New York City and Jefferson County, Alabama, 1956–1965. Arth Rheumatol 1970, 13(6):802-811.
21. Siegel M, Lee SL: The epidemiology of systemic lupus ery-thematosus. Sem Arth Rheumatol 1973, 3:1-54.
22. Michet CJ Jr, McKenna CH, Elveback LR, Kaslow RA, Kurland LT:
23. Bigazzi P: Mercury. In Immunotoxicology of Environmental and Occupa-tional Metals Edited by: Zelikoff J, Thomas P. London: Taylor Francis Ltd; 1998:131-162.
24. Solez K: Acute Renal Failure ('acute tubular necrosis', infarc-tion, and cortical necrosis). In Pathology of the Kidney Edited by: Heptinstall RH. Boston: Little, Brown and Company; 1983:1069-1148. 25. Bigazzi PE: Autoimmunity and heavy metals. Lupus 1994,
3:449-453.
26. Bigazzi PE: Autoimmunity induced by metals. In Toxicology of Metals Edited by: Chang W. Boca Raton, Florida: CRC Lewis Publish-ers; 1996:835-852.
27. Lawrence DA, McCabe MJ Jr: Immune modulation by toxic met-als. In Metal Toxicology Edited by: Goyer RA, Klaasen CD, Waalkes MP. San Diego: Academic Press; 1995:305-337.
28. Pelletier L, Druet P: Immunotoxicology of metals. In Toxicology of Metals Edited by: Goyer RA, Cherian MG. Berline: Springer-Verlag; 1995:72-92.
29. Exon JH, South EH, Hendrix K: Effects of metals on the humoral immune response. In Toxicology of metals Edited by: Chang LW. Boca Raton, Florida: CRC Lewis Publishers; 1996:797-810. 30. Kimber I, Basketter DA: Contact hypersensitivity to metals. In
Toxicology of Metals Edited by: Chang LW. Boca Raton, Florida: CRC Lewis Publishers; 1996:827-833.
31. Solen L, Vimercati L, Bruno S, Loeto M, Zocchetti C, Stefano R, Can-dilio G, Lasorsa G, Franco G, Foa V: Minimal immunological effects on workers with prolonged low exposure to inorganic mercury. Occup Environ Med 1997, 54:437-442.
32. Nielsen JB, Hultman P: Experimental studies on genetically determined susceptibility to mercury-induced autoimmune response. Ren Fail 1999, 21:343-348.
33. Warfvinge K, Hansson H, Hultman P: Systemic Autoimmunity Due to Mercury Vapor Exposure in Genetically Susceptible Mice: Dose-Response Studies. Toxicol Appl Pharmacol 1995,
132:299-309.
34. Barregard L, Hogstedt B, Schutz A, Karlsson A, Sallsten G, Thiringer G: Effects of occupational exposure to mercury vapor on lymphocyte micronuclei. Scand J Work Environ Health 1991,
17:263-268.
35. Close AH, Guo TL, Shenker BJ: Activated human T lymphocytes exhibit reduced susceptibility to methylmercury chloride-induced apoptosis. Toxicol Sci 1999, 49:68-77.
36. Hirokawa K, Hayashi Y: Acute Methyl Mercury Intoxication in Mice. Volume 30. Tokyo Medical and Dental University, Department of Pathology, Medical Research Institute; 1980:12-32.
37. Hultmann P, Johansson U: Strain Differences in the Effect of Mercury on Murine Cell-Mediated Immune Reactions. Fd Chem Toxicol 1991, 9:633-638.
38. Hu H, Moller G, Abedi-Valugerdi M: Thiol compounds inhibit mercury-induced immunological and immunopathological alterations in susceptible mice. Clin Exp Immunol 1997,
107:68-75.
39. Jiang Y, Moller G: IL-2 may be a limiting factor precluding lym-phocytes from genetically resistant mice from responding to HgCl2. Int Immunol 1999, 11(5):627-633.
40. Larsson W: Contact stomatitis to mercury associated with spontaneous mononuclear cell infiltrates in Brown Norway (BN) rats with HgCI2-induced autoimmunity. J Oral Pathol Med 1994, 23:441-445.
41. Wild L, Ortega H, Lopez M, Salvaggio J: Immune system altera-tion in the rat after indirect exposure to methyl mercury chloride or methyl mercury sulfide. Environ Res 1997, 74:34-42. 42. Via C, Nguyen P, Niculescu F, Papadimitriou J, Hoover D, Silbergeld E: Low-Dose Exposure to Inorganic Mercury Accelerates Disease and Mortality in Acquired Murine Lupus. Environ Health Perspect 2003, 111(10):1273-1277.
43. Hultman P, Enestrom S: Dose-response studies in murine mer-cury-induced autoimmunity and immune-complex disease.
Toxicol Appl Pharmacol 1992, 113:199-208.
44. Hultman P, Bell L, Enestrom S, Pollard M: Murine susceptibility to mercury II. Autoantibody profiles and renal immune depos-its in hybrid, backcross, and H-2d congenic mice. Clin Immunol Immunopathol 1993, 68:9-20.
45. Hultman P, Johansson U, Turley S, Lindh U, Enestrom S, Pollard MK:
Adverse immunological effects and autoimmunity induced by dental amalgam and alloy in mice. The FASEB Journal 1994,
8:1183-1190.
46. Michaelson J, McCoy J, Hirszel P: Mercury-Induced Autoimmune Glomerulonephritis in Inbred Rats. Surv Synth Path Res 1985,
4:401-411.
47. Pelletier L, Hirsch F, Rossert J, Druet E, Druet P: Experimental Mercury-Induced Glomerulonephritis. Springer Semin Immun-opathol 1987, 9:359-369.
48. Druet P, Hirsch F, Sapin C, Druet E, Bellon B: Immune dysregula-tion and auto-immunity induced by toxic agents. Transplanta-tion Proc 1982, 14(3):482-484.
49. Queiroz ML, Perlingeiro RC, Dantas DC, Bizzacchi JM, De Capitani EM: Immunoglobulin levels in workers exposed to inorganic mercury. Pharmacol Toxicol 1994, 74:72-75.
50. Insug O, Datar S, Koch CJ, Shapiro IM, Shenker BJ: Mercuric com-pounds inhibit human monocyte function by inducing apop-tosis: evidence for formation of reactive oxygen species, development of mitochondrial membrane permeability transition and loss of reductive reserve. Toxicology 1997,
124:211-224.
51. Contrino J, Kosuda LL, Marucha P, Kreutzer DL, Bigazzi PE: The in vitro effects of mercury on peritoneal leukocytes (PMN and macrophages) from inbred Brown Norway and Lewis rats.
Int J Immunopharmacol 1992, 14(6):1051-1059.
52. Langworth S, Elinder C, Sundqvist K: Minor effects of low expo-sure to inorganic mercury on the human immune system.
Scand J Work Environ Health 1993, 19:405-413.
53. Bloom NS: Analysis and stability of mercury speciation in petroleum hydrocarbons. Fresenius J Anal Chem 2000,
366(5):438-43.
54. Wilhelm SM: Estimate of mercury emissions to the atmos-phere from petroleum. Environ Sci Technol 2001,
35(24):4704-4710.
55. Renneberg AJ, Dudas MJ: Calcium hypochlorite removal of mer-cury and petroleum hydrocarbons from co-contaminated soils. Waste Manag Res 2002, 20(5):468-75.
56. Cancro M, Potter M: The Requirement of an Adherent Cell Substratum for the Growth of Developing Plasmacytoma Cells in Vivo. J Exp Med 1976, 144:1554-1567.
57. Potter M, Wax J: Genetics of Susceptibility to Pristane-Induced Plasmacytomas in BALB/cAn: Reduced Susceptibility in BALB/cJ with a Brief Description of Pristane-Induced Arthri-tis. J Immunol 1981, 127(4):1591-1595.
58. Barker R, Wells A, Ghoraishian M, Easterfield A, Hitsumoto Y, Elson C, Thompson S: Expression of mammalian 60-kD heat shock protein in the joints of mice with pristane-induced arthritis.
Clin Exp Immunol 1996, 103:83-88.
59. Stasiuk L, Ghoraishian M, Elson C, Thompson S: Pristane-induced arthritis is CD4+ T-cell dependent. Immunology 1997, 90:81-86. 60. Wooley P, Sud S, Whalen J, Nasser S: Pristane-Induced Arthritis in Mice: V. Susceptibility to Pristane-Induced Arthritis is Determined by the Genetic Regulation of the T Cell Reper-toire. Arthritis Rheum 1998, 41(11):2022-2031.
61. Vigar N, Cabrera W, Araujo L, Ribeiro O, Ogata T, Siquiera M, Olga , Ibanez M, De Franco M: Pristane-induced arthritis in mice selected for maximal or minimal acute inflammatory reac-tion. Eur J Immunol 2000, 30:431-437.
62. Kuroda Y, Nacionales D, Akaogi J, Reeves W, Satoh M: Autoimmu-nity induced by adjuvant hydrocarbon oil components of vac-cine. Biomed Pharmacotherapy 2004, 58:325-337.
63. Richards H, Satoh M, Shaheen M, Yoshida H, Reeves W: Induction of B Cell Autoimmunity by Pristane. Curr Top Microbiol Immunol 1999, 246:387-392.
64. Richards HB, Satoh M, Jennette JC, Okano T, Kanwar YS, Reeves WH: Disparate T Cell requirements of two subsets of lupus-specific autoantibodies in pristane-treated mice. Clin Exp Immunol 1999, 115:547-553.
65. Richards H, Reap E, Shaw M, Satoh M, Yoshida H, Reeves W: B Cell Subsets in Pristane-induced Autoimmunity. Curr Top Microbiol Immunol 2000, 252:201-207.
66. Akaogi J, Nacionales D, Kuroda Y, Reeves W, Satoh M: Ecotropic murine leukemia viruses and exogenous mouse mammary tumor viruses are not essential for pristane-induced lupus.
Arthritis Rheum 2003, 48(10):2990-2992.
67. Drappa J, Kamen L, Chan E, Georgiev M, Ashany D, Marti F, King P:
Impaired T Cell Death and Lupus-like Autoimmunity in T Cell-specific Adapter Protein-deficient Mice. J Exp Med 2003,
Publish with BioMed Central and every scientist can read your work free of charge
"BioMed Central will be the most significant development for disseminating the results of biomedical researc h in our lifetime."
Sir Paul Nurse, Cancer Research UK
Your research papers will be:
available free of charge to the entire biomedical community
peer reviewed and published immediately upon acceptance
cited in PubMed and archived on PubMed Central
yours — you keep the copyright
Submit your manuscript here:
http://www.biomedcentral.com/info/publishing_adv.asp
BioMedcentral
68. Hamilton K, Satoh M, Swartz J, Richards HB, Reeves WH: Influence of Microbial Stimulation on Hypergammaglobulinemia and Autoantibody Production in Pristane-Induced Lupus. Clin Immunol Immunopathol 1998, 86(3):271-279.
69. Richards H, Satoh M, Shaw M, Libert C, Poli V, Reeves W: Inter-leukin 6 Dependence of Anti-DNA Antibody Production: Evidence for Two Pathways of Autoantibody Formation in Pristane-induced Lupus. J Exp Med 1998, 188(5):985-990. 70. Satoh M, Treadwell E, Reeves W: Pristane induces high titers of
anti-Su and anti-nRNP/Sm autoantibodies in BALB/c mice; Quantitation by antigen capture ELISAs based on monospe-cific human autoimmune sera. J Immunol Methods 1995,
182:51-62.
71. Satoh M, Kumar A, Kanwar Y, Reeves W: Anti-nuclear antibody production and immune-complex glomerulonephritis in BALB/c mice treated with pristane. Proc Natl Acad Sci 1995,
92:10934-10938.
72. Satoh M, Kuroda Y, Yoshida H, Behney K, Mizutani A, Akaogi J, Nacionales D, Lorenson T, Rosenbauer R, Reeves W: Induction of lupus autoantibodies by adjuvants. J Autoimmunity 2003, 21:1-9. 73. Yang J, Sing A, Wilson M, Satoh M, Stanic A, Park J, Hong S, Gadola S, Mizutani A, Kakumanu S, Reeves W, Cerundolo V, Joyce S, Van Kaer L, Sing R: Immunoregulatory Role of CD1d in the Hydrocar-bon Oil-Induced Model of Lupus Nephritis. J Immunol 2003,
171:2142-2153.
74. Potter M, Kutkat L: Inhibition of Pristane-Induced Peritoneal Plasmacytoma Formation. Curr Top Microbiol Immunol 1999,
246:351-361.
75. Potter M, Jones G, DuBois W, Williams K, Mushinski E: Myeloma Proteins that Bind Hsp65 (GroEL) are Polyreactive and are found in High Incidence in Pristane Induced Plasmacytomas.
Curr Top Microbiol Immunol 2000, 252:265-271.
76. Allred SL, Burg JR: Environmental personal injury litigation as one source of response effects: Findings from the National Exposure Registry. Toxicol Ind Health 1995, 11(2):217-230. 77. Skaer TL: Medication induced systemic lupus erythematosus.
Clin Therap 1992, 14(4):496-506.
78. Stevens MB: Drug induced lupus. Hosp Pract 1992, 30:26-32. 79. Hess EV: Role of drugs and environmental agents in lupus
syn-dromes. Curr Opin Rheumatol 1995, 34:597-599.
80. Reidenberg MM: Aromatic amines and the pathogenesis of lupus erythematosus. Am J Med 1983, 75:1037-1042.
81. Rodnan GP, Benedeck TG: The association of systemic progres-sive sclerosis (scleroderma) with coal miners' pneumoniosis and other forms of silicosis. Ann Int Med 1967, 66:323-334. 82. Dodson VN, Dinman BD: Occupational acroosteolysis: III. A
clinical study. Arch Environ Health 1971, 22:83-91.