R E S E A R C H A R T I C L E
Open Access
Measuring inter-rater reliability for nominal
data
–
which coefficients and confidence
intervals are appropriate?
Antonia Zapf
1*, Stefanie Castell
2, Lars Morawietz
3and André Karch
4,5Abstract
Background:Reliability of measurements is a prerequisite of medical research. For nominal data, Fleiss’kappa (in the following labelled as Fleiss’K) and Krippendorff’s alpha provide the highest flexibility of the available reliability measures with respect to number of raters and categories. Our aim was to investigate which measures and which confidence intervals provide the best statistical properties for the assessment of inter-rater reliability in different situations.
Methods:We performed a large simulation study to investigate the precision of the estimates for Fleiss’K and Krippendorff’s alpha and to determine the empirical coverage probability of the corresponding confidence intervals (asymptotic for Fleiss’K and bootstrap for both measures). Furthermore, we compared measures and confidence intervals in a real world case study.
Results:Point estimates of Fleiss’K and Krippendorff’s alpha did not differ from each other in all scenarios. In the case of missing data (completely at random), Krippendorff’s alpha provided stable estimates, while the complete case analysis approach for Fleiss’K led to biased estimates. For shifted null hypotheses, the coverage probability of the asymptotic confidence interval for Fleiss’K was low, while the bootstrap confidence intervals for both measures provided a coverage probability close to the theoretical one.
Conclusions:Fleiss’K and Krippendorff’s alpha with bootstrap confidence intervals are equally suitable for the analysis of reliability of complete nominal data. The asymptotic confidence interval for Fleiss’K should not be used. In the case of missing data or data or higher than nominal order, Krippendorff’s alpha is recommended. Together with this article, we provide an R-script for calculating Fleiss’K and Krippendorff’s alpha and their corresponding bootstrap confidence intervals.
Keywords:Inter-rater heterogeneity, Fleiss’kappa, Fleiss’K, Krippendorff’s alpha, Bootstrap, Confidence interval
Background
In interventional as well as in observational studies, high validity and reliability of measurements are crucial for providing meaningful and trustable results. While validity is defined by how well the study captures the measure of interest, high reliability means that a measurement is re-producible over time, in different settings and by different raters. This includes both the agreement among different raters (inter-rater reliability, see Gwet [1]) as well as
the agreement of repeated measurements performed by the same rater (intra-rater reliability). The importance of reliable data for epidemiological studies has been dis-cussed in the literature (see for example Michels et al. [2] or Roger et al. [3]).
The prerequisite of being able to ensure reliability is, however, the application of appropriate statistical mea-sures. In epidemiological studies, information on disease or risk factor status is often collected in a nominal way. For nominal data, the easiest approach for assessing reli-ability would be to simply calculate observed agreement. The problem of this approach is that “this measure is biased in favour of dimensions with small number of * Correspondence:[email protected]
1Department of Medical Statistics, University Medical Center Göttingen,
Humboldtallee 32, 37073 Göttingen, Germany
Full list of author information is available at the end of the article
categories” (Scott [4]). In order to avoid this problem, two other measures of reliability, Scott’s pi [4] and Cohen’s kappa [5], were proposed, where the observed agreement is corrected for the agreement expected by chance. As the original kappa coefficient (as well as Scott’s pi) is limited to the special case of two raters, it has been modified and extended by several researchers so that various formats of data can be handled [6]. Although there are limitations of kappa, which have already been discussed in the literature (e.g., [7–9]), kappa and its varia-tions are still widely applied. A frequently used kappa-like coefficient was proposed by Fleiss [10] and allows includ-ing two or more raters and two or more categories. Although the coefficient is a generalization of Scott’s pi, not of Cohen’s kappa (see for example [1] or [11]), it is mostly called Fleiss’kappa. As we do not want to perpetu-ate this misconception, we will label it in the following as Fleiss’K as suggested by Siegel and Castellan [11].
An alternative measure for inter-rater agreement is the so-called alpha-coefficient, which was developed by Krippendorff [12]. Alpha has the advantage of high flexibility regarding the measurement scale and the number of raters, and, unlike Fleiss’ K, can also handle missing values.
Guidelines for reporting of observational studies, ran-domized trials and diagnostic accuracy studies [13–15] request that confidence intervals should always be pro-vided together with point estimates as the meaning of point estimates alone is limited. For reliability measures, the confidence interval defines a range in which the true coefficient lies with a given probability. Therefore, a con-fidence interval can be used for hypothesis testing. If, for example, the aim is to show reliability better than chance at a confidence level of 95 %, the lower limit of the two-sided 95 % confidence interval has to be above 0. In contrast, if a substantial reliability is to be proven (Landis and Koch [16] define substantialas a reliability coefficient larger than 0.6, see below), the lower limit has to be above 0.6. For Fleiss’K, a parametric asymp-totic confidence interval (CI) exists, which is based on the delta method and on the asymptotic normal distri-bution [17, 18]. This confidence interval is in the follow-ing referred to as “asymptotic confidence interval”. An alternative approach for the calculation of the confi-dence intervals for K is the use of resampling methods, in particular bootstrapping. For the special case of two categories and two raters, Klar et al. [19] performed a simulation study and recommended using bootstrap confidence intervals when assessing the uncertainty of kappa (including Fleiss’ K). For Krippendorff’s alpha, bootstrapping offers the only suitable approach, because the distribution of alpha is unknown.
The assessment of reliability in epidemiological studies is heterogeneous, and often uncertainty is not taken into
account, which results in an inappropriate methodo-logical use. Moreover, there is a lack of evidence which reliability measure performs best under different circum-stances (with respect to missing data, prevalence distri-bution and number of raters or categories). Except for a study by Häußler [20], who compared measures of agreement for the special case of two raters and binary measurements, there is no systematic comparison of re-liability measures available. Therefore, it was our aim to
a) compare Fleiss’K and Krippendorff’s alpha (as the most generalized measures for agreement in the framework of inter-rater reliability) regarding the precision of their estimates;
b) compare the asymptotic CI for Fleiss’K with the bootstrap CIs for Fleiss’K and Krippendorff’s alpha regarding their empirical coverage probability; c) give recommendations on the measure of agreement
and confidence interval for specific settings.
Methods
Fleiss’ K is based on the concept that the observed agreement is corrected for the agreement expected by chance. Krippendorff’s alpha in contrast is based on the observed disagreement corrected for disagreement ex-pected by chance. This leads to a range of −1 to 1 for both measures, where 1 indicates perfect agreement, 0 indicates no agreement beyond chance and negative values indicate inverse agreement. Landis and Koch [16] provided cut-off values for Cohen’s kappa from poor to almost perfect agreement, which could be transferred to Fleiss’ K and Krippendorff’s alpha. However, e.g., Thompson and Walter [7] demonstrated that reliability estimates strongly depend on the prevalence of the cat-egories of the item investigated. Thus, interpretation based on simple generalized cut-offs should be treated with caution, and comparison of values across studies might not be possible.
Fleiss’K
From the available kappa and kappa-like coefficients we chose Fleiss’ K [10] for this study because of its high flexibility. It can be used for two or more categories and two or more raters. However, similarly to other kappa and kappa-like coefficients, it cannot handle missing data except by excluding all observations with missing values. This implies that allN observations are assessed by n raters, and that all observations with less than n
Fleiss [18], this standard error is only appropriate for testing the hypothesis that the underlying value is zero. Applying the multivariate central limit theorem of Rao [22], an approximate normal distribution can be assumed for large samples under the hypothesis of randomness [18]. This leads to the asymptotic two-sided 1 –αconfidence interval
CIasympð Þ ¼Κ K^ z1−α=2se K^
with z1−α/2 as quantile of the standard normal distri-bution. The asymptotic CI is by definition generally only applicable for large sample sizes; moreover, Efron [23] stated that the delta method in general tends to under-estimate the standard error, leading to too narrow confi-dence intervals and to an inflation of the type-one error. Therefore, several authors proposed resampling methods [24–26] as an alternative for calculating confidence in-tervals for Fleiss’ K. We will here use a standard boot-strap approach, as suggested by Klar et al. [19] and Vanbelle et al. [26]. In each bootstrap step b= 1,…,B a random sample of size N is drawn with replacement from the N observations. Each observation drawn con-tains the associated assessments of all raters. For each bootstrap sample the point estimate is calculated, de-noted by Kb. The vector of the point estimates, sorted
by size, is given by ΚB¼ K^½ 1;…; K^½ B
. Then the two-sided bootstrap confidence interval for the type-one errorαis defined by the empiricalα/2 and 1–α/2 per-centiles ofKB:
CIBootstrapð Þ ¼Κ K^½B⋅α=2; ^K½B⋅ð1−α=2Þ:
Krippendorff’s alpha
Krippendorff [12] proposed a measure of agreement,
which is even more flexible than Fleiss’ K, called
Krippendorff’s alpha. It can also be used for two or more raters and categories, and it is not only applic-able for nominal data, but for any measurement scale, including metric data. Another important advantage of Krippendorff’s alpha is that it can handle missing values, given that each observation is assessed by at least two raters. Observations with only one assessment have to be excluded.
The formulas for the estimation of Krippendorff’s alpha  are given in the Additional file 1. For details, we refer to Krippendorff’s work [27]. Gwet [1] points out that Krippendorff’s alpha is similar to Fleiss’K, especially if there are no missing values. The difference between the two measures is explained by different definitions of the expected agreement. For the calculation of the expected agreement for Fleiss’ K, the sample size is taken as infinite, while for Krippendorff’s alpha the actual sample size is used.
For Krippendorff’s alpha the theoretical distribution is not known, even not an asymptotic one [28]. However, the empirical distribution can be obtained by the boot-strap approach. Krippendorff proposed an algorithm for bootstrapping [28, 29], which is also implemented in the SAS- and SPSS-macro from Hayes [28, 30]. The pro-posed algorithm differs from the one described for Fleiss’ K above regarding three aspects. First, the algorithm weights for the number of ratings per individual to ac-count for missing values. Second, not the N observa-tions, with each observation containing the associated assessments of all raters, are randomly sampled. Instead the random sample is drawn from the coincidence matrix, which is needed for the estimation of Krippen-dorff’s alpha (see Additional file 1). This means that the dependencies between the raters are not taken into ac-count. The third difference is that Krippendorff keeps the expected disagreement fixed, and only the observed disagreement is calculated anew in each bootstrap step. We performed simulations for a sample size of N= 100 observations, which showed that the empirical and the theoretical coverage probability differ considerably (median empirical coverage probability of 60 %). Therefore, we decided to use in our study the same bootstrap algorithm for Krippendorff’s alpha as for Fleiss’K (in the following labelled as standard approach). This leads to a vector of the bootstrap estimates (sorted by size) ΑB= (Â[1],…, Â[B]). Then the bootstrap 1 – α/2 confi-dence interval is defined by the percentiles:
CIBootstrapð Þ ¼Α Α^½B⋅α=2; ^Α½B⋅ð1−α=2Þ
:
R-script K_alpha
As there is no standard software, where Fleiss’ K and Krippendorff’s alpha with bootstrap confidence intervals are implemented (for an overview see Additional file 2), we provide an R-script together with this article, named “K_alpha”. The R-function kripp.alpha from the package irr [31] and the SAS-macro kalpha from Andrew Hayes [30] served as reference. The function K_alpha calculates Fleiss’ K (for nominal data) with the asymptotic and the bootstrap interval and Krippendorff’s alpha with the standard bootstrap interval. The description of the pro-gram as well as the propro-gram itself, the function call for a fictitious dataset and the corresponding output are given in the Additional file 3.
Simulation study
the number of observations, i.e.,N = 50, 100, 200 the number of raters, i.e.,n = 3, 5, 10
the number of categories, i.e.,k = 2, 3, 5.
the strength of agreement (low, moderate and high), represented by Fleiss’K and Krippendorff’s alpha∈ [0.4,0.93](see below)
This resulted in a total of 81 scenarios. The choice of factor levels was motivated by the real world case study used in this article and by scenarios found frequently in the literature.
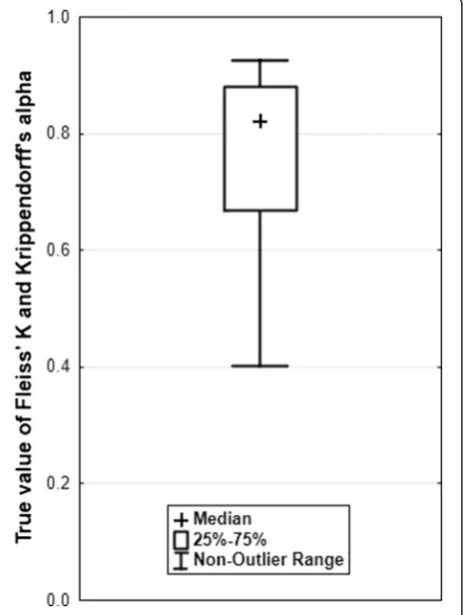
We generated nominal data by using the multinomial distribution withNsubjects,nraters, andkcategories be-cause Fleiss’K in its unweighted version is only appropriate for nominal data. Varying the probabilities of the multi-nomial distribution between 0.1 and 0.5 led to true param-eters between 0.40 and 0.93 on the [−1; 1] scale; in half of the scenarios the true value lied between 0.67 and 0.88 (see Fig. 1). The true values for Krippendorff’s alpha and Fleiss’ K differed only at the fourth to fifth decimal place.
We used 1,000 simulation runs and 1,000 bootstrap samples for all scenarios in accordance with Efron [23], and set the two-sided type-one error to 5 %. For each simulated dataset, we calculated Fleiss’K with the two-sided 95 % asymptotic and the bootstrap confidence
interval, and Krippendorff’s alpha with the two-sided 95 % bootstrap interval. We investigated two statistical criteria: bias and coverage probability. The mean bias is defined by the mean point estimates over all simulation runs minus the true value given. The number of simulation runs, in which the true value was located inside the two-sided 95 % confidence interval divided by the total number of simulation runs, gives the empirical coverage probability.
For three specific scenarios, we deleted (completely at random) a pre-specified proportion of the data (10, 25, and 50 %) in order to evaluate the ramifications of miss-ing values under the missmiss-ing completely at random (MCAR) assumption. The selection criteria for the sce-narios were an empirical coverage probability close to 95 % for Fleiss’ K and Krippendorff’s alpha, a sample size of 100, as well as variation in agreement, categories and raters over the scenarios.
The three scenarios, each for a sample size of 100, are:
I: five raters, a scale with two categories and low agreement
II: five raters, a scale with five categories and high agreement
III: ten raters, a scale with three categories and medium agreement.
Then we applied the standard bootstrap algorithm for Fleiss’ K and Krippendorff’s alpha to investigate the ro-bustness against missing values.
Case study
In order to illustrate the theoretical considerations learnt from the simulation study, we applied the same ap-proach to a real world dataset focusing on the inter-rater agreement in the histopathological assessment of breast cancer as used for epidemiological studies and clinical decision-making. The firstn= 50 breast cancer biopsies of the year 2013 that had been sent in for routine histopatho-logical diagnostics at the Institute of Pathology, Diagnostik Ernst von Bergmann GmbH (Potsdam, Germany), were retrospectively included in the study. For the present study, the samples were independently re-evaluated by four senior pathologists, who are experienced in breast cancer pathology and immunohistochemistry, and who were blinded to the primary diagnosis and immunohisto-chemical staining results. Detailed information is provided in the Additional file 4.
Results
Simulation study
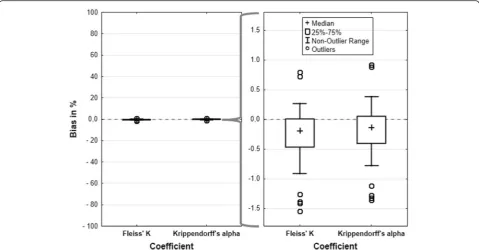
Point estimates of Fleiss’ K and Krippendorff’s alpha did neither differ considerably from each other (Additional file 5 above) nor from the true values over all scenarios (Fig. 2).
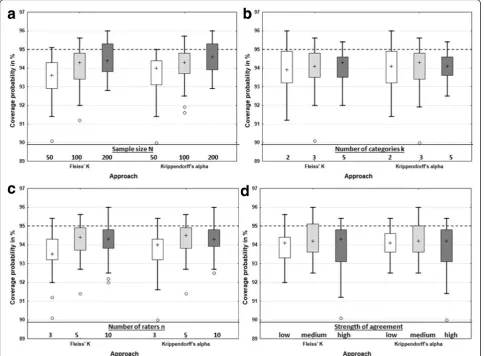
Regarding the empirical coverage probability, it could be shown that the asymptotic confidence interval for Fleiss’ K leads to a low coverage probability in most cases (and also for a sample size up to 1000, see Additional file 5 below), while the bootstrap intervals for Krippendorff’s alpha and Fleiss’ K provide virtually the same results and the empirical coverage probabil-ity is close to the theoretical one (Fig. 3).
We investigated the effect of each variation factor indi-vidually; to do so, we fixed one factor at a given level, then varied the levels of all other factors, and reported results over these simulation runs. It can be seen that with larger sample sizes the median empirical coverage probability gets closer to the nominal level of 95 % for Krippendorff’s alpha as well as for Fleiss’K (Fig. 4a). For a sample size of 200, the median empirical coverage probability is quite close to the theoretical of 95 %. With increasing number of categories the range of the cover-age probability gets smaller (Fig. 4b). For three raters, the coverage probability is below that for five or ten raters, while for five and ten raters the coverage prob-ability is more or less the same (Fig. 4c). With increasing strength of agreement, the median empirical coverage probability tends to get closer to 95 % for both coeffi-cients (Fig. 4d).
Missing values cannot be considered by Fleiss’ K ex-cept by excluding all observations with missing values. In contrast, for Krippendorff’s alpha all observations
with at least two assessments are included in the calcula-tion. We investigated the robustness of both coefficients in the case of missing values under MCAR conditions with respect to the mean bias and the empirical two-sided type-one error for three scenarios (I. N= 100,n= 5, k = 2, low agreement; II. N= 100, n= 5, k = 5, high agreement; III. N= 100, n= 10, k = 3, medium agree-ment; see also methods section). Krippendorff’s alpha was very robust against missing values, even if 50 % of the values were missing. In contrast, Fleiss’ K was un-biased only in the case of 10 % missing values in all three scenarios. For 50 % missing values, in all three sce-narios the bias was larger than 20 % and the coverage probability was below 50 % (Table 1).
Results of the case study
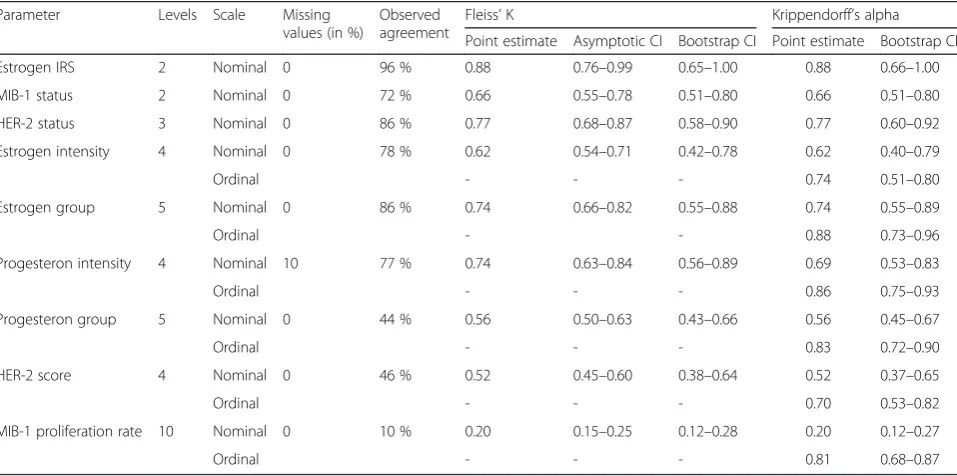
Observed agreement in the case study showed consider-able differences between the parameters investigated (Table 2), ranging from 10 % (MIB-1 proliferation rate) to 96 % (estrogen receptor group). Parameters based on semi-objective counting (i.e., hormone receptor groups and MIB-1 proliferation) had no higher agreement than parameters based on pure estimation.
study, confidence intervals were narrower for Fleiss’ K when using the asymptotic approach than when applying the bootstrap approach. The relative difference of both approaches became smaller the lower the observed agreement was. There was no relevant difference be-tween the bootstrap confidence intervals for Fleiss’ K and Krippendorff’s alpha.
For the three measures used for clinical decision-making (MIB-1 state, HER-2 status, estrogen IRS), point estimates between 0.66 and 0.88 were observed, indicat-ing some potential for improvement. Alpha and Fleiss K’ estimates for the six other measures (including four to ten categories) varied from 0.20 to 0.74.
In the case of missing data (progesteron intensity), Krippendorff’s alpha showed a slightly lower estimate than Fleiss’ K which is in line with the results of the simulation study.
For variables with more than two measurement levels, we also assessed how the use of an ordinal scale instead of a nominal one affected the predicted reliability. As Fleiss’ K does not provide the option of ordinal scaling, we performed this analysis for Krippendorff’s alpha only. Alpha estimates increased by 15–50 % when using an ordinal scale compared to a nominal one. However, use of an ordinal scale gives for these variable correct esti-mates of alpha as data were collected in an ordinal way. Here, we could obtain point estimates from 0.70 (HER-2 score) to 0.88 (estrogen group) indicating substantial agreement between raters.
Discussion
We compared the performance of Fleiss’ K and
Krippendorff’s alpha as measures of inter-rater reliabil-ity. Both coefficients are highly flexible as they can han-dle two or more raters and categories. In our simulation study as well as in a case study, point estimates of Fleiss’ K and Krippendorff’s alpha were very similar and were not associated with over- or underestimation. The asymp-totic confidence interval for Fleiss’ K led to a very low coverage probability, while the standard bootstrap interval led to very similar and valid results for both, Fleiss’K and Krippendorff’s alpha. The limitations of the asymptotic confidence interval approach are linked to the fact that the underlying asymptotic normal distribution holds only true for the hypothesis that the true Fleiss’ K is equal to zero. For shifted null hypotheses (we simulated true values between 0.4 and 0.93), the standard error is no longer ap-propriate [18, 23]. As bootstrap confidence intervals are not based on assumptions about the underlying distribu-tion, they offer a better approach in cases where the deriv-ation of the correct standard error for specific hypotheses is not straight forward [24–26].
alpha and Fleiss’K as there is no systematic difference in the way the parameters are assessed. Moreover, the simulation results for the missing data analysis are only valid for MCAR conditions as we did not investigate sce-narios in which data were missing at random or missing not at random. However, in many real-life reliability studies the MCAR assumption may hold as missingness is indeed completely random, for example because each subject is only assessed by a random subset of raters due to time, ethical or technical constraints.
Interestingly, Krippendorff’s alpha is, compared to the kappa coefficients (including Fleiss’K), rarely applied in practice, at least in the context of epidemiological stud-ies and clinical trials. A literature search performed in Medline, using the search terms Krippendorff’s alpha or kappa in combination with agreement or reliability (each in title or abstract), led to 11,207 matches for kappa and only 35 matches for Krippendorff’s alpha from 2010 up to 2016 (2016/03/01). When extracting
opportunity of selection bias. It can be assumed that in articles, which report reliability coefficients in the main text but not in the abstract, confidence intervals are used even less. This could also have influenced the ob-served difference in usage of kappa and Krippendorff’s alpha; however, is this case we do not think that the pro-portion of the two measures would be different.
In general, agreement measures are often criticized for the so-called paradoxa associated with them (see [9]). For example, high agreement rates might be associated
with low measures of reliability, if the prevalence of one category is low. Krippendorff extensively discussed these paradoxa and identified them as conceptual problems in the understanding of observed and expected agreement [36]. We did not simulate such scenarios with unequal fre-quencies of categories or discrepant frefre-quencies of scores between raters. However, as the paradoxa concern both coefficients likewise, because only the used sample size for the expected agreement differs (actual versus infinite), it can be assumed that there is no difference between alpha and Fleiss’K in their behaviour in those situations.
An alternative approach to the use of agreement coeffi-cients in the assessment of reliability would be to model the association pattern among the observers’ ratings. There are three groups of models which can be used for this: latent class models, simple quasi-symmetric agree-ment models, and mixture models (e.g.,) [37, 38]. How-ever, this modelling approaches request a higher level of statistical expertise so that for standard applicants it is in general much simpler to estimate the agreement coeffi-cients and especially to interpret them.
Conclusion
In the case of nominal data and no missing values, Fleiss’ K and Krippendorff’s alpha can be recommended equally for the assessment of inter-rater reliability. As the asymptotic confidence interval for Fleiss’ K has a very low coverage probability, only standard bootstrap confidence intervals as used in our study can be recom-mended. If the measurement scale is not nominal and/or missing values (completely at random) are present, only
Table 2Results of the case study (n= 50) of histopathological assessment of patients with mamma carcinoma rated by four independent and blinded readers. The six ordinal parameters were also assessed if as they were measured in a nominal way
Parameter Levels Scale Missing
values (in %)
Observed agreement
Fleiss’K Krippendorff’s alpha
Point estimate Asymptotic CI Bootstrap CI Point estimate Bootstrap CI
Estrogen IRS 2 Nominal 0 96 % 0.88 0.76–0.99 0.65–1.00 0.88 0.66–1.00
MIB-1 status 2 Nominal 0 72 % 0.66 0.55–0.78 0.51–0.80 0.66 0.51–0.80
HER-2 status 3 Nominal 0 86 % 0.77 0.68–0.87 0.58–0.90 0.77 0.60–0.92
Estrogen intensity 4 Nominal 0 78 % 0.62 0.54–0.71 0.42–0.78 0.62 0.40–0.79
Ordinal - - - 0.74 0.51–0.80
Estrogen group 5 Nominal 0 86 % 0.74 0.66–0.82 0.55–0.88 0.74 0.55–0.89
Ordinal - - 0.88 0.73–0.96
Progesteron intensity 4 Nominal 10 77 % 0.74 0.63–0.84 0.56–0.89 0.69 0.53–0.83
Ordinal - - - 0.86 0.75–0.93
Progesteron group 5 Nominal 0 44 % 0.56 0.50–0.63 0.43–0.66 0.56 0.45–0.67
Ordinal - - - 0.83 0.72–0.90
HER-2 score 4 Nominal 0 46 % 0.52 0.45–0.60 0.38–0.64 0.52 0.37–0.65
Ordinal - - - 0.70 0.53–0.82
MIB-1 proliferation rate 10 Nominal 0 10 % 0.20 0.15–0.25 0.12–0.28 0.20 0.12–0.27
Ordinal - - - 0.81 0.68–0.87
Table 1Empirical coverage probability and bias in % of Krippendorff’s alpha and Fleiss’K for simulated data with varying percentage of missing values
Missing values Krippendorff’s alpha Fleiss’K
Coverage probability (%)
Bias (%) Coverage probability (%)
Bias (%)
I 10 % 95.4 - 0.82 94.4 - 0.78
25 % 94.3 - 0.54 94.3 - 1.40
50 % 93.9 - 0.67 40.8 - 25.93
II 10 % 92.9 0.04 95.2 - 0.16
25 % 94.7 0.03 67.7 8.27
50 % 93.6 0.01 13.3 - 25.72
III 10 % 95.1 0.01 93.8 - 0.26
25 % 95.2 −0.02 65.5 - 7.76
50 % 94.8 −0.13 33.3 - 23.72
Krippendorff’s alpha is appropriate. The correct choice of measurement scale of categorical variables is crucial for an unbiased assessment of reliability. Analysing vari-ables in a nominal setting which have been collected in an ordinal way underestimates the true reliability of the measurement considerably, as can be seen in our case study. For those interested in a one-fits-all approach, Krippendorff’s alpha might, thus, become the measure of choice. Since our recommendations cannot easily be applied within available software solutions, we offer a free R-script with this article which allows calculating Fleiss’ K as well as Krippendorff’s alpha with the pro-posed bootstrap confidence intervals (Additional file 3).
Additional files
Additional file 1:Estimators - Estimators of Fleiss’K (with standard error) and Krippendorff’s alpha. (DOCX 19 kb)
Additional file 2:Available software–implementation of Fleiss’K and/ or Krippendorff’s alpha in most common statistical software programs used in epidemiology/biometry. (DOCX 14 kb)
Additional file 3:R-script k_alpha–syntax, explanation, and analysis of a fictitious data set. (DOCX 25 kb)
Additional file 4:Case study–description, dataset, syntax, and output. (DOCX 21 kb)
Additional file 5:Figures A1 and A2–scatter plot of the point estimates of Fleiss’K versus Krippendorff’s alpha and empirical coverage probability of the asymptotic confidence interval for Fleiss’K. (DOCX 92 kb)
Abbreviations
CI, confidence interval; MCAR, missing completely at random; se, standard error
Acknowledgements
The authors thank Prof. Klaus Krippendorff very sincerely for his helpfulness, the clarifications and fruitful discussions. AZ thanks Prof. Sophie Vanbelle from Maastricht University for her helpful comments. All authors thank Dr. Susanne Kirschke, Prof. Hartmut Lobeck and Dr. Uwe Mahlke (all Institute of Pathology, Diagnostik Ernst von Bergmann GmbH, Potsdam, Germany) for histopathological assessment.
Funding
No sources of financial support.
Availability of data and materials
We offer a free R-script for the calculation of Fleiss’K and Krippendorff’s alpha with the proposed bootstrap confidence intervals in the Additional file 3.
Authors’contribution
AZ, AK and SC designed the overall study concept; AZ and AK developed the simulation study. AZ wrote the simulation program and performed the simulation study. AK conducted the literature review. LM conducted the case study. All authors wrote and revised the manuscript. All authors read and approved the final manuscript.
Competing interests
The authors declare that they have no competing interests.
Consent for publication
Not applicable.
Ethics approval and consent to participate
For this type of study formal consent is not required.
Author details
1Department of Medical Statistics, University Medical Center Göttingen,
Humboldtallee 32, 37073 Göttingen, Germany.2Department of Epidemiology, Helmholtz Centre for Infection Research, Inhoffenstrasse 7, 38124 Braunschweig, Germany.3Institute of Pathology, Diagnostik Ernst von Bergmann GmbH, Charlottenstr. 72, 14467 Potsdam, Germany.4ESME -Research Group Epidemiological and Statistical Methods, Helmholtz Centre for Infection Research, Inhoffenstrasse 7, 38124 Braunschweig, Germany. 5German Center for Infection Research, Hannover-Braunschweig site,
Göttingen, Germany.
Received: 9 March 2016 Accepted: 28 July 2016
References
1. Gwet KL. Handbook of Inter-Rater Reliability. 3rd ed. USA: Advanced Analytics, LLC; 2012.
2. Michels KB. A renaissance for measurement error. Int J Epidemiol. 2001; 30(3):421–2.
3. Roger VL, Boerwinkle E, Crapo JD, et al. Strategic transformation of population studies: recommendations of the working group on epidemiology and population sciences from the National Heart, Lung, and Blood Advisory Council and Board of External Experts. Am J Epidemiol. 2015;181(6):363–8.
4. Scott WA. Reliability of content analysis: the case of nominal scale coding. Public Opinion Quarterly. 1955;XIX:321–5.
5. Cohen J. A coefficient of agreement for nominal scales. Educ Psychol Meas. 1960;20:37–46.
6. Hallgren KA. Computing inter-rater reliability for observational data:_an overview and tutorial. Tutor Quant Methods Psychol. 2012;8(1):23–4. 7. Thompson WD, Walter SD. A reappraisal of the kappa coefficient. J Clin
Epidemiol. 1988;41(10):949–58.
8. Kraemer HC, Bloch DA. Kappa coefficients in epidemiology: an appraisal of a reappraisal. J Clin Epidemiol. 1988;41(10):959–68.
9. Feinstein A, Cicchetti D. High agreement but low kappa: I. The problems of two paradoxes. J Clin Epidemiol. 1990;43(6):543–9.
10. Fleiss JL. Measuring nominal scale agreement among many raters. Psychol Bull. 1971;76:378–82.
11. Siegel S, Castellan Jr NJ. Nonparametric Statistics for the Behavioral Sciences. 2nd ed. New York: McGraw-Hill; 1988.
12. Krippendorff K. Estimating the reliability, systematic error, and random error of interval data. Educ Psychol Meas. 1970;30:61–70.
13. von Elm E, Altman D, Egger M, Pocock SJ, Gotzsche PC, Vandenbroucke JP, for the STROBE Initiative. The strenghtening the reporting of observational studies in epidemiology (STROBE) statement: guidelines for reporting observational studies. J Clin Epidemiol. 2008;61:344–9.
14. Schulz KF, Altman DG, Moher D, for the CONSORT group. CONSORT 2010 statement: updated guidelines for reporting parallel group randomized trials. J Clin Epidemiol. 2010;63:834–40.
15. Bossuyt PM, Reitsma JB, Bruns DE, Gatsonis CA, Glasziou PP, Irwig LM, Lijmer JG, Moher D, Rennie D, de Vet HCW, for the STARD steering group. Towards complete and accurate reporting of studies of diagnostic accuracy: the STARD initiative. Br Med J. 2003;326:41–4.
16. Landis JR, Koch GG. The measurement of observer agreement for categorical data. Biometrics. 1977;33(1):159–74.
17. Fleiss JL, Cohen J, Everitt BS. Large sample standard errors of kappa and weighted kappa. Psychol Bull. 1969;72(5):323–7.
18. Fleiss JL, Nee JCM, Landis JR. Large sample variance of kappa in the case of different sets of raters. Psychol Bull. 1979;86(5):974–7.
19. Klar N, Lipsitz SR, Parzen M, Leong T. An exact bootstrap confidence interval for k in small samples. J Royal Stat Soc Series D (The Statistician). 2002;51(4):467–78.
20. Häußler S. Evaluation of reader heterogeneity in diagnostic trials. Master thesis at the University of Bremen, study course: Medical Biometry / Biostatistics; 2010.
21. Fleiss JL, Levin B, Paik MC. Statistical Methods for Rates and Proportions. 3rd ed. Hoboken: Wiley; 2003.
23. Efron B. Six questions raised by the bootstrap. Exploring the limits of bootstrap. In: LePage R, Billard L, editors. Technical Report No. 139. New York: Division of Biostatistics, Stanford University. Wiley; 1992.
24. Fleiss JL, Davies M. Jackknifing functions of multinomial frequencies, with an application to a measure of concordance. Am J Epidemiol. 1982;115:841–5. 25. McKenzie DP, Mackinnon AJ, Péladeau N, Onghena P, Bruce PC, Clarke DM, Harrigan S, McGorry PD. Comparing correlated kappas by resampling: is one level of agreement significantly different from another? J Psychiatr Res. 1996;30(6):483–92.
26. Vanbelle S, Albert A. A bootstrap method for comparing correlated kappa coefficients. J Stat Comput Simulation. 2008;78(11):1009–15.
27. Krippendorff. Content analysis, an introduction to its methodology. SAGE Publications, 2nd Edition; 2004.
28. Krippendorff. Algorithm for bootstrapping Krippendorff’scα. Version from 2015.06.17. Obtained by personal communication with Klaus Krippendorff; 2015.
29. Hayes A, Krippendorff K. Answering the call for a standard reliability measure for coding data. Comm Methods Measures. 2007;1(1):77–89. 30. Hayes A. http://www.afhayes.com/spss-sas-and-mplus-macros-and-code.
html. Accessed 4 Aug 2016.
31. Gamer M, Lemon J, Singh P. Various coefficients of interrater reliability and agreement. Package‘irr’, version 0.84; 2015.
32. MacPherson P, Choko AT, Webb EL, Thindwa D, Squire SB, Sambakunsi R, van Oosterhout JJ, Chunda T, Chavula K, Makombe SD, Lalloo DG, Corbett EL. Development and validation of a global positioning system-based“map book”system for categorizing cluster residency status of community members living in high-density urban slums in Blantyre. Malawi Am J Epidemiol. 2013;177(10):1143–7.
33. Devine A, Taylor SJ, Spencer A, Diaz-Ordaz K, Eldrige S, Underwood M. The agreement between proxy and self-completed EQ-5D for care home residents was better for index scores than individual domains. J Clin Epidemiol. 2014;67(9):1035–43.
34. Johnson SR, Tomlinson GA, Hawker GA, Granton JT, Grosbein HA, Feldmann BM. A valid and reliable belief elicitation method for Bayesian priors. J Clin Epidemiol. 2010;63(4):370–83.
35. Hoy D, Brooks P, Woolf A, Blyth F, March L, Bain C, Baker P, Smith E, Buchbinder R. Assessing risk of bias in prevalence studies: modification of an existing tool and evidence of interrater agreement. J Clin Epidemiol. 2012;65(9):934–9.
36. Krippendorff K. Commentars: A dissenting view on so-called paradoxes of reliability coefficients. In: Salmond CT, editor. Communication Yearbook 36. New York: Routledge; 2012. chapter 20: 481–499.
37. Schuster C. A mixture model approach to indexing rater agreement. Br J Math Stat Psychol. 2002;55(2):289–303.
38. Schuster C, Smith DA. Indexing systematic rater agreement with a latent-class model. Psychol Methods. 2002;7(3):384–95.
• We accept pre-submission inquiries
• Our selector tool helps you to find the most relevant journal
• We provide round the clock customer support
• Convenient online submission
• Thorough peer review
• Inclusion in PubMed and all major indexing services
• Maximum visibility for your research Submit your manuscript at
www.biomedcentral.com/submit