Impact of TV Viewing on Behavioural Changes on Children with Special
Reference to Coimbatore, Tamil Nadu
1Dr. J. Chandrakhanthan, 2Mr. A. Prasathkumar, 3Mr. P. Mayilrajan
1Assistant Professor, 2Assistant Professor, 3Assistant Professor
1, 2, 3 School of Management, Sri Krishna College of Technology, Coimbatore, India
Email - 1[email protected], 2[email protected], 3[email protected]
1. INTRODUCTION:
Children’s are the pillars of the future India. The former President of India Dr.A.P.J.Abdul Kalam uttered to
the students that “Dream it, so that you can succeed”. A strong India would be created with the hands of youngsters.
But where their life is going?
The consumer in this era is in target of massive media attacks effectively planned, and enlighten with glamour as per the emotions, needs, wants and demands of the consumers. Marketers and companies are spending billions of dollars on consumer research and to know the important factors involved in consumer decision making. While talking
about the marketing mix now a day’s marketers main focus is on designing persuasive messages/commercials to
attract the target customers. Because the major chunk of the population and among all consumption of household a considerable portion is of children products. So marketers are focusing and trying to attract and influence the children by designing ads that are considerably attractive for children and persuasive enough for their emotional attachment with the product.
In the most recent couple of decades, youth heftiness has tripled and it has come to pestilence levels in developed nations. Around 10% of school kids matured between 5 to 17 years around the world are overweight out of which 70% grow up to wind up stout grown-ups. Weight has noteworthy effect on both physical and mental wellbeing of the youngster, expanding inclination of the overweight youngsters to experience the ill effects of hyper-lipidemia, strange glucose resistance, hypertension, coronary supply route malady, obstructive rest apnea, fruitlessness, orthopedic issues and so forth. Likewise, social and mental issue, for example, discouragement, demonization and poor self-regard happen with expanded recurrence in fat youngsters.
Weight is an autonomous danger component for cardiovascular illness. Weight is connected with an expanded danger of grimness and mortality and in addition decreased future. For youngsters and youths, overweight are characterized utilizing age and sex particular normograms for body mass file (BMI).
Emotional and rapid societal changes amid the most recent decades have contributed essentially to adolescence obesity. There is confirmation expressing that singular's eating and physical movement practices are vigorously impacted by encompassing social and physical ecological connections both for grown-ups and youngsters. Urbanization related admission practices that have been demonstrated to advance heftiness incorporate continuous utilization of dinners at fast-food outlets, utilization of curiously large partitions at home and at eateries, utilization of unhealthy nourishments, for example, high-fat, low-fiber sustenance, and admission of sweetened drinks. Bodyweight is regulated by numerous physiological mechanisms that maintain balance between energy intake and energy expenditure. Any factor that raises energy intake or decreases energy expenditure by even a small amount will cause obesity in the long-term. Genetic factors can have a great effect on individual predisposition; however, rising prevalence rates among genetically stable populations indicate that environmental and, perhaps, perinatal factors must underlie the childhood obesity epidemic.
Abstract: The present study focused on the impact of TV viewing pattern on the behavioural changes of children.
The opinion was collected from the parents of the children in the age group of 8 – 16 years in Coimbatore city. A structured questionnaire was used by the researcher to collect the necessary data. A sample of 233 respondents were chosen randomly. The changes due to television viewing pattern among the children is measured with the help of nine variables. The collected Data was analyzed by using the statistical tools like frequency analysis, F-test, t-F-test, Cronbach alpha and Regression analysis. We completely understanding that the TV Media have impact on children’s behavioural changes. Efforts are needed to overcome the TV impact on Children Behavioural changes.
2. OBJECTIVES OF THE STUDY:
To reveal the profile of the parents of the TV Viewing children.
To study the level of TV viewing pattern among the children as per the view of their parents.
To evaluate the impact of TV viewing pattern on behavioural changes among the children.
To study the potential strategies adopted by parents to limit the TV viewing pattern and its consequences.
3. HYPOTHESES:
There is no significant difference among the Lesser Educated and Higher Educated parents regarding the view
on various aspects related to their children’s TV viewing pattern and its consequences.
There is no significant association between the profile of parents regarding the view on various aspects related
to their children’s TV viewing pattern and its consequences on behavioural changes. There is no significant impact of TV view pattern on various consequences of TV viewing.
4. RESEARCH DESIGN:
Quantitative research approach was adopted to carry out this study, particularly the survey design. Sampling unit refers to the parents of the children in Coimbatore under the age category of 6-15 years old are considered for the present study. Size of the sample attained is 233. In this research, the researcher has adopted a convenient sampling method to collect the primary data. In this study the researcher selected children of Coimbatore for the study. In this research, Data analysis is done by utilizing the following statistical tools like frequency analysis, F-test, t-test, Cronbach alpha and Regression analysis.
5. ANALYSIS:
The changes due to television viewing pattern among the children is measured with the help of nine variables. The respondents are asked to rate the nine variables at five-point scale. The mean scores of each variable in changes
among the LE and HE have been computed separately along with its ‘t statistics. The highly viewed variables in
changes by the LE are social interaction and weight of child since its mean scores are 3.3341 and 3.3094 respectively. As per the view of HE, these two variables are weight of the child and social interaction since its mean scores are 3.9674 and 3.9671 respectively. Regarding the view on variables in changes, the significant difference among the LE
and HE have been noticed in the case of 8 out of nine variables in changes since it’s ‘t’ statistics are significant at five
per cent level.
The included nine variables in changes explain it to an extent of 79.49 per cent since its Cronbach alpha is 0.7949. The standardized factor loading of variables in changes are greater than 0.60 which reveals its content validity.
The significance of ‘t’ statistics of the standardized factor loading of variables in changes reveal its convergent validity. It is also proved by the composite reliability and average variance extracted since these are greater than its standard minimum of 0.50 and 50.00 per cent respectively.
The higher and lesser SOCDTV have been noticed among the children with the age of above 12 and less than 8 years since its mean scores are 3.8411 and 3.1607 respectively. The higher and lesser consistency in SOCDTV have been noticed among the children with the age of less than 8 and 8 to 10 years since its co-efficient of variation are 22.59 and 14.55 per cent respectively. There is a significant association between the age of the children and their
SOCDTV as per view of their parents since their ‘F’ statistics is significant at five per cent level.
The higher and lesser SOCDTV have been noticed among the children with other and relatives care since its mean scores are 3.6997 and 3.2455 respectively. The higher consistency in SOCDTV is noticed among the children who is under the care of servants since it’s co-efficient of variation is 10.48 per cent. There is a significant association
between the care taker of children and the SOCDTV among the children since it’s ‘F’ statistics is significant at five
per cent level.
The children who viewed TV more than 2 hours have a higher SOCDTV compared to the children who viewed TV less than half an hour since their respective mean scores are 3.6972 and 3.0509 respectively. The higher consistency is SOCDTV has been noticed among the children who viewed TV more than 2 hours since it’s co -efficient of variation in 13.45 per cent. There is a significant association between the hours spent on TV viewing and
the SOCDTV among the children since their respective ‘F’ statistics is significant at five per cent level.
The highly viewed variable in Sedentary Behaviour by the LE are Lesser outing and not responding other call
since its mean score are 3.3884 and 3.3117 respectively. As per the view of HE, these two variables are ‘not play with others’ and ‘lesser outing’ since its mean score are 3.9224 and 3.0556 respectively. The significant difference among the LE and HE have been noticed in their view on all variables in SB since its ‘t’ statistics are significant at five per
cent level.
watching TV and Bed time resistance since its mean score are 3.8999 and 3.8545 respectively. Regarding the view on variables in Sleeping Pattern, the significant difference among the LE and HE have been noticed in their view on all
six variables in Sleeping Pattern since its ‘t’ statistics are significant at five per cent level.
The highly viewed variable in Consumption Pattern by the LE are uneven in timing of taking and taking of pre-sugared products since its mean score are 3.7554 and 3.7045 respectively. Among the HE, these two variables are uneven in timing of taking food and taking food and taking of more soft drinks since its mean score are 3.9694 and 3.9114 respectively. Regarding the view on variables in Consumption Pattern, the significant difference among the LE and HE have not been noticed in the variables in Consumption Pattern since its ‘t’ statistics are not significant at five -point level.
The highly viewed variables in Social Isolation by the LE are not responding on others love and avoiding
family function since it’s mean score are 3.4856 and 3.4245 respectively. As per the view of HE, these two variables
are ‘dislike to participate in social function’ and ‘not responding on other’s love’ since its mean score are 3.9776 and
3.9476 respectively. Regarding the view on variables in Social Isolation, the significant difference among the children
of LE and HE have been noticed regarding than view on all seven variables in Social Isolation since its ‘t’ statistics are
significant at five per cent scale.
The highly viewed variable in Lesser Physical Activity by the LE are dislike to walk and dislike to do small
family works since it’s mean scores are 3.4997 and 3.4229 respectively. Among the HE, these two variables are ‘dislike to do small family works’ and ‘reduction of games activities’ since its mean scores are 3.9676 and 3.9472
respectively. Regarding the view on variables in LPA, the significant difference among the LE and HE have been
noticed in all seven variables in LPA since its ‘t’ statistics are significant at five per cent level.
The highly viewed components of Behavioural Changes by LE are poor in academic achievement and consumption pattern since its mean scores are 3.7092 and 3.6633 respectively. Among the HE, these two components are social isolation and lesser physical activities since its mean scores are 3.9237 and 3.9183 respectively. Regarding the level of components of BC, the significant difference among the children of LE and HE have been noticed in the
case of six out of seven components of BC since its ‘t’ statistics are significant at five per cent level.
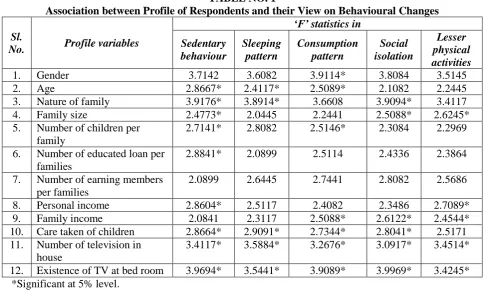
Since the profile of respondents and their view on the behavioural changes among their children may be associated, the present study has made an attempt to examine it with the help of one-way analysis of variance. All the twelve profile variables and the score on first five components of Behavioural Changes have been included for the analysis.
TABLE NO. 1
Association between Profile of Respondents and their View on Behavioural Changes
Sl.
No. Profile variables
‘F’ statistics in
Sedentary behaviour
Sleeping pattern
Consumption pattern
Social isolation
Lesser physical activities
1. Gender 3.7142 3.6082 3.9114* 3.8084 3.5145
2. Age 2.8667* 2.4117* 2.5089* 2.1082 2.2445
3. Nature of family 3.9176* 3.8914* 3.6608 3.9094* 3.4117
4. Family size 2.4773* 2.0445 2.2441 2.5088* 2.6245*
5. Number of children per family
2.7141* 2.8082 2.5146* 2.3084 2.2969
6. Number of educated loan per families
2.8841* 2.0899 2.5114 2.4336 2.3864
7. Number of earning members
per families
2.0899 2.6445 2.7441 2.8082 2.5686
8. Personal income 2.8604* 2.5117 2.4082 2.3486 2.7089*
9. Family income 2.0841 2.3117 2.5088* 2.6122* 2.4544*
10. Care taken of children 2.8664* 2.9091* 2.7344* 2.8041* 2.5171
11. Number of television in house
3.4117* 3.5884* 3.2676* 3.0917* 3.4514*
12. Existence of TV at bed room 3.9694* 3.5441* 3.9089* 3.9969* 3.4245*
*Significant at 5% level.
children per family, caretaker of children and number of television in house since its ‘F’ statistics are significant at
five per cent level.
The significantly associating profile variables regarding the view on consumption pattern are gender, age, number of children in the family, family income, caretaker of children, number of television in home and existence of TV at bedroom, whereas, in the case of view on social isolation, these profile of variables are nature of family, family
size, family income, caretaker of children, and number of television in home since its ‘F’ statistics are significant at
five per cent level. The significantly associating profile variables regarding the view on aggressive in nature are number of children per family, number of educated person per family, personal income, family income, caretaker of children and number of TV in Home. Whereas in the case of view on poor in academic achievement, these profile variables are age, number of children per family, number of educated persons per family whereas in the case of view on social isolation, these profile variables are nature of family, family size, family income, caretaker of children, number of television in home and existence of TV at bed room. Regarding the view on lesser physical activities, the significantly associating profile variables are family size, personal income, family income, and number of television in Home.
It is essential to find out the relative importance of TV viewing pattern on the determination of sedentary behaviour among the children for some policy implications. The multiple regression analysis has been administered for this purpose. The fitted regression model is:
Y = a + b1x1 + b2x2+ …. b8x8 + e
Whereas
Y – Score on sedentary behaviour among the children x1– Hours spent on TV view in among the children
x2– Score on unnecessary TV watching among the children
x3– Score on preferred programmes among the children
x4– Timing of watching of TV programmes among the children
x5– Score on hours spent on TV viewing among the children
x6– Score on need for TV viewing for sleep among the children
x7– Score on favourite TV programmes among the children
x8– Score on favourite TV channel among the children
b1, b2…b8– regression co-efficient of independent variables
a – intercept and e – error term.
In the present study, the variables namely unnecessary TV watching, preferred programmes, timing of watching of TV programmes, companion in TV viewing, need for TV viewing for sleep, favourite TV programme and formative TV channel are treated as the dummy variables. The impact of TV viewing pattern on sedentary behaviour among the children of LE and HE have been assessed separately along with the analysis of pooled data. The results are given in the following Table
Impact of TV Viewing Pattern on SB among Children
Sl.
No. TV viewing pattern
Regression co-efficient as per the view of
LE HE Pooled data
1. Hours spent on TV viewing 0.1893* 0.2044* 0.1917*
2. Unnecessary TV watching 0.2014* 0.2345* 0.2242*
3. Preferred programmes 0.0997 0.1022 0.0996
4. Timing of watching of TV
programmes 0.1088 0.1703* 0.1403*
5. Companion in TV viewing 0.0473 0.1045 0.0779
6. Need for TV viewing for sleep 0.1249* 0.1719* 0.1504*
7. Favourite TV programme 0.1011 0.1403* 0.1242*
8. Favourite TV channel 0.0997 0.0886 0.0897
Constant 0.4193 0.7244 0.6033
R2 0.7393 0.8045 0.8409
‘F’ statistics 8.4194* 9.1173* 9.8991*
*Significant at 5% level.
TV viewing for sleep and favourite TV programmes since their respective regression co-efficient are significant at five per cent level. The higher impact of TV viewing pattern sedentary behaviour among the children of HE is noticed than that among the children of LEs.
The analysis of pooled data reveals that a unit change in hours spent on TV viewing, unnecessary TV watching, timing of watching TV programmes, need for TV viewing for sleep and favourite TV programmes result in an increase in the sedentary behaviour among the children by 0.1917, 0.7242, 0.1403, 0.1504 and 0.1242 units respectively. The changes in the TV viewing pattern explains the changes in the Sedentary behaviour among the children to an extent of 84.09 per cent since its R2 is 0.8409. The analysis reveals that the important TV viewing
pattern increase the Sedentary behaviour among the children is unnecessary TV watching and hours spent on TV viewing.
6. FINDINGS :
The highly viewed variables in changes by the Lesser Educated are Social intention and Weight of Child, since its Mean scores are 3.3341 and 3.3094 respectively. As per the view of Higher Educated these two variables are Weight of the Child and Social Intention, since the Mean scores are 3.9674 and 3.9671 respectively.
The dominance age group among the children in the family of the respondents are 8 to 10 and less than 8 years, which constitutes 37.21% and 32.36%. Both Lesser Educated and Higher Educated, the respondents responded that 8 – 10 and less than 8 years are the dominance age group. The higher and lesser SOCDTV have been noticed among the children in the age of above 12 and less than 8 years since its Mean scores are 3.8411 and 3.1607 respectively. There is a significant association between the age of the children and their SOCDTV as per the view of their parents since their F statistics is significant at five percent level.
In Higher Educated the servants are the caretaker and in Lesser Educated on their own they will be care taking in the house. The higher and lesser SOCDTV have been noticed among the children with others and relatives since its Mean scores are 3.6997 and 3.2455 respectively. The higher consistency in SOCDTV is noticed among the children who is under the care of servants since its coefficient of variation is 10.45%. There is a significant association between the caretaker of children and the SOCDTV among the children since its F statistics is significant at five percent level.
The dominance hours spent on TV viewing among the children are 1.01 hours to 02.00 hours and more than 02.00 hours which constitutes 35.08% and 36.72% respectively. The hours spent on TV viewing is higher among the children of Higher Educated compare to children of Lesser Educated. The children who viewed TV more than 2 hours have a higher SOCDTV compared to the children who viewed TV less than half an hour since their respective Mean scores are 3.6972 and 3.0509 respectively. The higher consistency in SOCDTV has been noticed among the children who viewed TV more than 2 hours since its coefficient of variation is 13.45%. There is a significant association between the hours spent on TV viewing and the SOCDTV among the children since their respective F statistics significant at five percent level.
The highly viewed component of behavioural changes by lesser educated are poor in academic achievements and consumption pattern since its Mean scores are 3.7092 and 3.6633 respectively. Among the higher educated its Mean scores are 3.9237 and 3.9183 respectively. Regarding the level of components of behavioural changes the significant difference among the children of lesser educated and higher educated have been noticed in the case of six out of seven components of behavioural changes since its t statistics are significant at five percent level.
As per the view of lesser educated the significantly influencing TV viewing pattern on the sleeping pattern among the children are hours spent on TV viewing and unnecessary TV watching whereas as per the view of higher educated, these are hours spent on TV viewing, unnecessary TV watching, timing of watching TV programmes and need for TV viewing for sleep since its regression coefficient are significant at five percent level. The higher impact of Tv viewing pattern on the sleeping pattern among the children of higher educated is noticed compared to the children of lesser educated since its R² are 0.7941 and 0.7246 respectively. The analysis reveals the relative importance of unnecessary TV watching and hours spent on TV viewing in the determination of sleeping pattern among the children. The analysis of pooled data reveals that a unit change in hours spent on TV viewing, need for TV viewing for sleep and favorite TV channel explain the changes in the consumption pattern of the children by 0.1604, 0.1597, and 0.1307 units respectively. The changes in the TV viewing pattern explain the changes in the consumption pattern among the children to an extent of 80.42percent.
The analysis of pooled data reveals that a unit change in hours spent on TV viewing, unnecessary TV watching, timing of watching of TV programmes, and need for viewing sleep result in the change of the social isolation by 0.1503, 0.1917, 0.1507 and 0.1511 units respectively. The changes in the TV viewing pattern explain the changes in social isolation to an extent of 79.09 percent.
7. CONCLUSION:
We completely understanding that the TV Media have impact on children’s behavioural changes. Efforts are
needed to overcome the TV impact on Children Behavioural changes. Parents must adopt the strategies to keep their
children in control. The Parents’ could reduce the Children TV spent time by increase their quality spending time with
the children and interaction with the children. The Parents could insist their children to avoid watching TV while eating. The Parents could encourage their Children on Physical activity like Brain games, role play, floor games like cycling, skipping, swimming etc., which leads to Healthy and active body. Parents must inculcate the good habits by creating curiosity and being a role model.
REFERENCES:
1. Michael M. Borghese , Mark S. Tremblay, Genevieve Leduc, Charles Boyer, Priscilla Bélanger, Allana G. LeBlanc, Claire Francis and Jean-Philippe Chaput,(2015) Television viewing and food intake during television viewing in normal-weight, overweight and obese 9- to 11-year-old Canadian children: a cross-sectional analysis, Journal of Nutritional Science , vol. 4, e8, page 1 of 9
2. Chaput JP, Borghese M, Saunders TJ, Mathieu ME, Henderson M, Tremblay MS, O’Loughlin J, Tremblay A,
on behalf of the QUALITY cohort research group (2013).Combined associations between moderate to vigorous physical activity and sedentary behaviour with cardiometabolic risk factors in children. Canadian Journal of Diabetes, 37(2): S262
3. Chaput J-P, Klingenberg L, Astrup A, et al. (2011) Modern sedentary activities promote overconsumption of food in our current obesogenic environment. Obesity Reviews 12, e12–20.
4. Christakis DA, Liekweg K, Garrison MM, Wright JA. (2013) Infant Video Viewing and Salivary Cortisol Responses: A Randomized Experiment. The Journal of Pediatrics. 162(5):1035-1040.
5. Cliff D.P, Hesketh K.D, Vella S.A, et.al, (2016) Objectively measured sedentary behaviour and health and development in children and adolescents: systematic review and meta-analysis, Obesity Reviews, Volume 17, Issue 4.
6. David Jernigan, Jonathan Noel, Jane Landon, Nicole Thornton, Tim Lobstein (2017), Alcohol marketing and youth alcohol consumption: a systematic review of longitudinal studies published since 2008, Addiction, 112, 7 - 20
7. Ekris E. Van, Altenburg T.M, Singh.A.S, Proper K.I, Heymans M.W, Chinapaw M.J.M, (2016) An
evidence-update on the prospective relationship between childhood sedentary behaviour and biomedical health indicators: a systematic review and meta-analysis, Obesity Reviews, 17, 9, 833 - 849.
8. Farooq Ahmed Jam, Shakeel Akhtar, Syed Tahir Hijazi, Muhammad Bashir Khan (2010), Impact of Advertisement on Children Behaviour: Evidence from Pakistan. European Journal of Social Sciences, Vol.12, No.4 (2010) 663 – 670
9. Lewis K, Castrucci B, Gossman G, Mirchandani G, Sayegh M, Moehlman C, Van Eck M, Petrilli K. (2010)
Overweight among low-income Texas preschoolers aged 2 to 4 years. Journal of Nutrition and Education Behaviour, 42(3):178-84.
10. Maya Samaha, , Nazir S. Haw, (2017) Associations between screen media parenting practices and children’s
screen time in Lebanon, Telematics and Informatics 34 351–358
11. McMillen I, Rattanatray L, Duffield J, Morrison J, MacLaughlin S, Gentili S, Muhlhausler B. (2009) The early origins of later obesity: Pathways and mechanisms. Sansom Research Institute, 71-81. Accessed March 23, 2010.
12. Mendelsohn, A.L., Brockmeyer, C.A., Dreyer, B.P., Fierman, A.H., Berkule-Silberman, S.B., Tomopoulos, S. (2010) Do verbal interactions with infants during electronic media exposure mitigate adverse impacts on their language development as toddlers?. Infant and Child Development, 19:577–593.
13. Mitchell J, Pate RR, Beets MW, et al. (2013) Time spent in sedentary behaviour and changes in childhood BMI: a longitudinal study from ages 9 to 15 years. International Journal of Obesity (London) 37, 54–60. 14. Nassim Matin Roya Kelishadi et.al, (2017) Joint association of screen time and physical activity on self-rated
health and life satisfaction in children and adolescents: the CASPIAN-IV study International Health, Volume 9, Issue 1, 1 January 2017, Pages 58–68,
15. Ogden C, Carroll, M, Curtin L. (2010) Prevalence of high body mass index. JAMA;303(3): 242- 249.
16. Pankaj Priya, Rajat Kanti Baisya, Seema Sharma (2010) Television Advertisements and Childrens Buying behaviour, Marketing Intelligence & Planning, Vol.28, Issue.2, 151 – 169.
17. Pearson N, Biddle SJH. (2011) Sedentary behaviour and dietary intake in children, adolescents, and adults. A systematic review. American Journal of Preventive Medicine 41, 178–88.
19. Singh G, Siahpush M, Kogan M. (2010) Rising social inequalities in U.S. childhood obesity. Annals of Epidemiology; 20:40-52.
20. Susanne Kobel, Christine Lämmle, Olivia Wartha, Dorothea Kesztyüs, Tamara Wirt, Jürgen M. Steinacker, (2017) Effects of a Randomised Controlled School-Based Health Promotion Intervention on Obesity Related Behavioural Outcomes of Children with Migration Background, Journal of Immigrant and Minority Health, Volume 19, Issue 2, pp 254–262
21. Travis J. Saunders, Jeff K. Vallance, (2017) Screen Time and Health Indicators Among Children and Youth: Current Evidence, Limitations and Future Directions, Applied Health Economics and Health Policy, Volume 15, Issue 3, pp 323–331
22. Tremblay M, LeBlanc A, Kho M, et al. (2011) Systematic review of sedentary behaviour and health indicators in school-aged children and youth. International Journal of Behavioural Nutrition and Physical Activity, 8, 98. 23. Ventura A, Gromis J, Lohse B. (2010) Feeding practices and styles used by a diverse sample of low- income