R E S E A R C H
Open Access
High throughput DNA sequencing to detect
differences in the subgingival plaque microbiome
in elderly subjects with and without dementia
Andrew F Cockburn
1, Jonathan M Dehlin
1, Tiffany Ngan
2, Richard Crout
2, Goran Boskovic
3, James Denvir
3,
Donald Primerano
3, Brenda L Plassman
4, Bei Wu
5and Christopher F Cuff
1*Abstract
Background:To investigate the potential association between oral health and cognitive function, a pilot study was conducted to evaluate high throughput DNA sequencing of the V3 region of the 16S ribosomal RNA gene for determining the relative abundance of bacterial taxa in subgingival plaque from older adults with or without dementia.
Methods:Subgingival plaque samples were obtained from ten individuals at least 70 years old who participated in a study to assess oral health and cognitive function. DNA was isolated from the samples and a gene segment from the V3 portion of the 16S bacterial ribosomal RNA gene was amplified and sequenced using an Illumina HiSeq1000 DNA sequencer. Bacterial populations found in the subgingival plaque were identified and assessed with respect to the cognitive status and oral health of the participants who provided the samples.
Results:More than two million high quality DNA sequences were obtained from each sample. Individuals differed greatly in the mix of phylotypes, but different sites from different subgingival depths in the same subject were usually similar. No consistent differences were observed in this small sample between subjects separated by levels of oral health, sex, or age; however a consistently higher level of Fusobacteriaceae and a generally lower level of Prevotellaceae was seen in subjects without dementia, although the difference did not reach statistical significance, possibly because of the small sample size.
Conclusions:The results from this pilot study provide suggestive evidence that alterations in the subgingival microbiome are associated with changes in cognitive function, and provide support for an expanded analysis of the role of the oral microbiome in dementia.
Keywords:Cognitive impairment, Oral disease, Oral microbiome, Subgingival plaque
Background
In addition to the hypothesized link between oral health and chronic systemic diseases, such as cardiovascular disease, stroke, and diabetes, there now appears to be an association between oral health and neurodegenerative diseases, ranging from mild to moderate loss of cognitive function to Alzheimer’s Disease (AD) [1]. Poorer cogni-tive performance and tooth loss have been linked
epidemiologically in both retrospective and prospective studies [2-7], and tooth loss has been associated with an increased risk of both dementia and cognitive decline [8]. Indeed, increasing tooth loss over time is associated with increased likelihood of low cognitive scores [2]. Be-yond epidemiological associations, independent lines of experimental evidence support the hypothesis that bac-teria associated with diseases of the oral cavity contrib-ute to neurodegeneration. Oral bacteria and bacteria closely related to those found in the oral cavity have been found at a higher frequency post mortem in the brains of patients with AD than in those of patients who did not have AD [9,10]. In addition, the Third National * Correspondence:[email protected]
1Microbiology, Immunology & Cell Biology, School of Medicine, Robert C.
Byrd Health Sciences Center, West Virginia University, P.O. Box 4622, Morgantown, WV 26506-4622, USA
Full list of author information is available at the end of the article
Health and Nutrition Examination Survey (NHANES-III) provided evidence that gingival bleeding and loss of periodontal attachment were associated with lower cog-nitive function [11]. Furthermore, subjects with high levels of antibody against the periodontal pathogen Por-phyromonas gingivalishad significantly greater impaired verbal memory and subtraction test performance, and this finding remained robust when adjusting for poten-tial sociodemographic and vascular confounders [12]. Levels of immunoglobulin G (IgG) antibodies and serum tumor necrosis factor levels have been found to discrim-inate between normal subjects and AD patients [7], and recently Sparks Steinet al. [13] found that elevated anti-body levels to periodontal disease bacteria were observed in subjects years before cognitive impairment, suggesting that periodontal disease could potentially contribute to the risk of AD onset or progression.
If oral health is linked to neurodegeneration, it is plausible that bacteria found in the oral cavity play a causal role in establishing this link. The collection of microorganisms in the oral cavity, the‘oral microbiome’, has been studied using a variety of molecular methods that can identify both cultivatable and non-cultivatable bacteria within various ecological niches in the oral cav-ity [14,15]. Despite the evidence linking oral health and cognitive function, there is a paucity of empirical data that assess the oral microbiome in patients with cogni-tive degeneration [16]. Microbiome analysis could be used to determine whether the bacterial compositions of the oral microbiome or‘bacterial signatures’could serve as a predictive biomarker for increased risk of cognitive impairment. It is also possible that preventive treatment could target the makeup of the oral microbiome and the efficacy of such treatment could be monitored with this approach.
Recent advances in the availability and reduced costs of high throughput DNA sequencing and bioinformatics tools provide a broadly available and increasingly cost ef-fective method to identify bacterial populations found in polymicrobial biofilms associated with human tissue, in-cluding the oral cavity [17-19]. The present study was undertaken to develop a sampling and analysis pipeline using next generation DNA sequencing technology that could be used to characterize microbial populations in subgingival plaque samples. Using an Illumina HiSeq1000 DNA sequencer and a sample preparation and analysis pipeline that enabled multiple samples to be sequenced within the same sequencing lane, we were able to gener-ate and analyze economically more than one million bac-terial DNA sequences from each of 15 subgingival plaque samples. The participants were enrolled in a study that assessed oral health and cognitive function among adults at least 70 years old from West Virginia, some of whom were from medically underserved communities [20].
These sequences were analyzed using bioinformatics tools available in the publicly accessable software package Quantitative Insights into Microbial Ecology (QIIME) [21], and sequence comparisons were made among parti-cipants who were clinically assessed as normal or exhib-ited alterations in cognitive function. The results provide a road map for future efforts to use high throughput DNA sequencing to characterize the oral microbiome in the context of systemic disease, and provide preliminary evidence that differences exist in the bacterial compos-ition of subgingival plaque in patients with alterations in cognitive function. In contrast to other approaches to microbiome analysis, high throughput sequencing holds out the promise of also being useful for metagenomic analysis of the oral microbiome to identify potential viru-lence factors that contribute to systemic disease.
Methods
Oral health screening, cognitive analysis, and sample collection
A total of 15 samples of bacterial DNA from 10 indivi-duals were sequenced for this report, four of which (N1, N2, C2, C3) were obtained and partially analyzed during an earlier phase of the study [16]. Eleven additional sub-gingival plaque samples were obtained using sterile peri-odontal curettes from pocket probing depths of 1 to 3 mm, 3 to 5 mm, or >5 mm. These samples were col-lected into tubes containing Invitek SalivaGene DNA stabilization buffer (STRATEC Molecular GmbH, Berlin, Germany). In most cases, multiple plaque samples from the same pocket probing depth in the same participant were pooled into one tube for DNA extraction.
DNA extraction
DNA from the 11 new samples was purified using an Invitek PSP SalivaGene DNA Kit. As part of the purifica-tion procedure, 100 μg of lysozyme (Sigma-Aldrich, St. Louis, MO, USA) was added to each tube, the mixture incubated at 37°C for 10 minutes, and then processed according to the manufacturer's recommendations.
PCR and fragment purification
PCR primers, conditions for amplification of sequences in the V3 region of the 16S ribosomal RNA gene, and a multiplexed DNA sequencing strategy were as described in Bartramet al. [27] unless otherwise indicated. The V3 region varies in length by about 30 base pairs among dif-ferent species of bacteria in the Greengenes database, and the sequences obtained and analyzed in this study showed a similar size variability. The amplicon ranges from 296 to 327 base pairs, of which 160 base pairs is the primer. High pressure liquid chromatography-purified PCR primers were obtained from Integrated DNA Technologies (Coralville, IA, USA). Purified DNA was amplified using an AccuPrime PCR Kit (Invitrogen Life Technologies, Grand Island, NY, USA) on an MJ Re-search PTC-200 Thermal Cycler using the following conditions: 95°C for 6 minutes denature; 95°C for 2 min-utes, 50°C for 2 minmin-utes, 72°C for 2 minutes 30 cycles; 72°C for 4 minutes extend. Each reaction contained 0.5μl TAQ polymerase, 5μl 10x buffer 1(600 mM Tris-SO4 (pH 8.9), 180 mM (NH4)2Tris-SO4, 20 mM MgTris-SO4, 2 mM dGTP, 2 mM dATP, 2 mM dTTP, 2 mM dCTP, thermostable AccuPrime™protein, 10% glycerol), 20μM forward primer, 20 μM reverse primer, and up to 60 ng DNA in a total volume of 50μl. PCR reactions were per-formed in triplicate and reaction products were pooled prior to purification. Because there was a low concentra-tion of DNA in some of the samples, it was necessary to perform 30 cycles of amplification to obtain sufficient material to view on a gel. Pooled PCR products were purified by electrophoresis through 2% agarose in Tris/ borate/EDTA gels and the bands corresponding to ap-proximately 300 base pairs were excised and purified
using a QIAquick Gel Extraction Kit (Qiagen, Valencia, CA, USA) according to the manufacturer's directions.
DNA sequencing
Indexed libraries were pooled so that 12 libraries were sequenced in each lane of the flow cell. Eight pmols of the pooled libraries were clustered onto an Illumina v2 sequencing flow cell using an Illumina cBOT. Libraries were then sequenced in a 2 x 125 bp paired-end strategy on an Illumina HiSeq1000, so that the forward and re-verse reads could be assembled into a single contig. Reads were converted from Illumina bcl format to fastq format and separated into bins based on exact match to the index using CASAVA 1.8.2 (Illumina, San Diego CA, USA). An average of 6.7 million reads/sample passing the filter was sequenced in each library.
DNA sequence processing
discarded. This removed chimeras and most major PCR artifacts and represented approximately 5% of the total remaining sequences. Matching at 97% identity meant that any single base PCR artifacts would be combined with the corresponding authentic sequence (since the re-gion is about 100 bases long, up to three single base changes will be ignored). 5) The resulting table of oper-ational taxonomic units (OTUs) was filtered to remove any sequences that appeared less than 150 times.
Finally, scripts written in-house in biopython were used to convert the filtered Illumina data to the FASTA format for analysis by QIIME for taxonomic assignment and measurements of microbial diversity, but scripts to do this are now part of QIIME. To process Illumina-generated files in QIIME, the file headers were changed to begin with ‘>sample_number’ where ‘sample’ is the sample number and ‘number’ is the number of the se-quence in the file. All of the sese-quences were then com-bined into one file for analysis with QIIME. DNA sequences generated and analyzed in this study can be found at the National Center for Biotechnology Informa-tion Sequence Read Archive, project number SRA057340.
QIIME
All QIIME analyses were performed on a virtual server hosted by Amazon Web Services using an existing QIIME image. The server had the following specification: QIIME 1.4.0 EBS East XLARGE (ami-438d5b2a). The following QIIME scripts were used during analysis and default parameters were used unless otherwise noted: 1) ‘pick_ reference_otus_through_otu_table.py’matched sequences at 97% sequence identity with OTUs associated with spe-cific bacterial phylotypes in the Greengenes database (4Feb2011); 2) ‘summarize_taxa_through_plots.py’ gener-ated bar graphs of the relative abundance of different taxa in each sample; 3) ‘alpha_rarefaction.py’generated alpha rarefication plots; 4) ‘pick_rep_set.py’, ‘align_seqs.py’,
‘filter_alignment.py’, and ‘make_phylogeny.py’ were chained to generate a phylogenetic tree of the OTUs; 5) ‘beta_diversity_through_plots.py’ (using the phylogenetic tree and the weighted UniFrac option) generated a beta diversity table and principle coordinate plots for the inter-subject diversity; and 6) ‘otu_category_significance. py’generated analysis of variance (ANOVA) scores for all OTUs versus various categories. This script calculated raw, Bonferroni corrected, and false discovery rate cor-rected probabilities.
Statistical analysis
Data analyses involved logistic regression as implemen-ted in JMP/Pro Software (version 9.0.2) and random for-ests as implemented in R Software [28].
Results
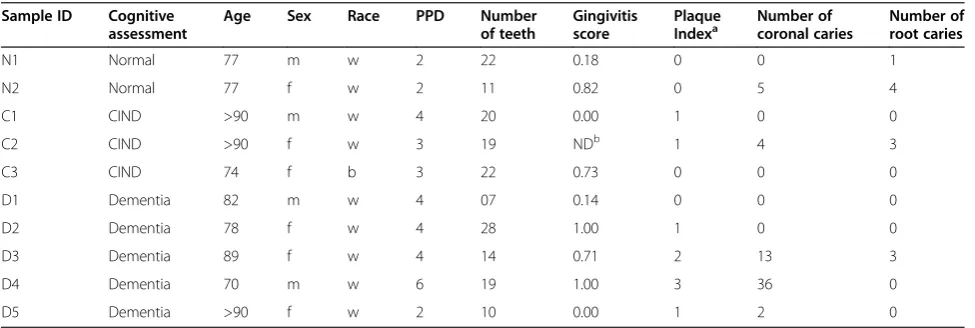
Demographics and health status of study participants A total of 15 samples was obtained from 10 individual participants. Participants ranged from 70 to 101 years old, were a nearly even mix of men and women, and all but one were self-identified as Caucasian. The number of teeth retained by the participants ranged from 7 to 22. Additional features of their oral health examinations are listed in Table 1.
Generation and filtering of DNA sequences
The Illumina sequencing run of the 15 DNA samples generated a total of more than 100 million paired-end DNA sequencing reads that met the initial quality filter-ing criteria (Table 2). Approximately 44 million reads could be aligned to produce a continuous sequence with at least a 58 base overlap with 100% identity and of these, more than 34 million DNA sequences passed all quality filtering steps. These sequences were clustered into OTUs matching the Greengenes database at 97% homology. An OTU clustered at 97% homology was
Table 1 Demographics and health status of study participants
Sample ID Cognitive
assessment
Age Sex Race PPD Number
of teeth
Gingivitis score
Plaque
Indexa Number ofcoronal caries Number ofroot caries
N1 Normal 77 m w 2 22 0.18 0 0 1
N2 Normal 77 f w 2 11 0.82 0 5 4
C1 CIND >90 m w 4 20 0.00 1 0 0
C2 CIND >90 f w 3 19 NDb 1 4 3
C3 CIND 74 f b 3 22 0.73 0 0 0
D1 Dementia 82 m w 4 07 0.14 0 0 0
D2 Dementia 78 f w 4 28 1.00 1 0 0
D3 Dementia 89 f w 4 14 0.71 2 13 3
D4 Dementia 70 m w 6 19 1.00 3 36 0
D5 Dementia >90 f w 2 10 0.00 1 2 0
a
considered a unique phylotype that approximates a ‘spe-cies’, but the 97% identity rule typically applies across the entire 16S rDNA sequence. If the V3 region is more or less variable this rule may not apply accurately to a shorter read length. An average of about 2.4 million sequences was analyzed per DNA sample. Approxi-mately 34% of the initial output of DNA sequences could thus be assigned as high quality OTUs for analysis using this sequencing and quality filtering pipeline. OTUs containing fewer than 150 sequences were dis-carded, resulting in identification of a total of 492 OTUs in this study [See Additional file 1].
Population diversity in samples
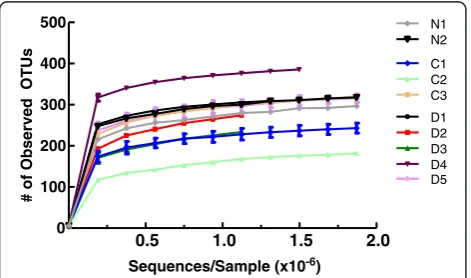
Alpha diversity is the amount of population diversity within a given sample. Alpha diversity was measured as the number of phylotypes observed versus number of sequences analyzed. Once each sequence was assigned to an OTU, QIIME was used to assess the alpha diver-sity of each subject and generate diversification plots (Figure 1). The number of OTUs identified in subgingi-val plaque samples ranged from 182 (CIND2) to 385 (Dementia 4). Population diversity essentially plateaued after approximately 350,000 reads were analyzed, and
this result was consistent across participants, irrespective of the final diversity. Using the QIIME script otu_ category_significance.py to run ANOVA, the amount of diversity among participants was not linked to the method of DNA isolation, mental status, age, race, or parameters of oral health listed in Table 1 (data not shown). Although the population diversity varied among participants, multiple samples from individual partici-pants yielded similar curves when analyzed separately. This characteristic is illustrated by the small error bars in Figure 1, where results from separate samples taken from different probing depths from some individuals were combined and averaged.
Taxonomic assignments
Taxonomic assignments for DNA sequences from each sample were made and analyzed at the phylum, class, order, family, and genus levels. Because of the relatively short region sequenced, assignments at the species level were not robust. Results are shown for analysis of sam-ples at the phylum and family levels for each participant and for multiple probing depth sites where available. In general, most of the identified bacteria were distributed among the phyla Fusobacteria, Bacteroidetes, Firmi-cutes, TM7, Actinobacteria, and Proteobacteria with less than 1% contribution of bacteria from any other phyla (Figure 2). There appeared to be a higher proportion of Fusobacteria-specific sequences in the samples from par-ticipants who did not have dementia compared to those who did. Additionally, at the phylum level the proportion of sequences identified as members of the Bacteroidetes phylum seemed to be slightly elevated in the samples from subjects with dementia. These potential relation-ships were explored in more detail at lower taxonomic levels. Sixty-eight different families were identified during taxonomic assignment (Figure 2) and the large inter-person variation in bacterial populations became evident. Nevertheless, the most striking observation was that in a comparison of samples in the non-dementia versus the dementia groups, the non-dementia samples had a higher proportion of sequences identified as from the family Fusobacteriaceae (primarily genera Fusobacterium and Leptotrichia) and a lower proportion of sequences from Prevotellaceae (almost entirelyPrevotella).
The two most common families varied in the diversity of detected phylotypes. Sixty-nine phylotypes of Prevo-tella and one rare phylotype not assigned to a genus were seen in the Prevotellaceae. There was substantial diversity in the phylotypes of Prevotella (Figure 3), as has been recently reported in ethnically diverse popula-tions including those of Aboriginal descent in Australia [29] and in a population from the Netherlands [19]. In contrast, only 17 phylotypes of Fusobacteriaceae were found, even though about twice as many sequences were Table 2 Number of DNA sequences obtained during
processing
Processing step Total %
Initial Number of Sequences 101,081,862 100
Successful end pairing 44,142,704 44
PHRED score >5 36,213,577 36
OTUs identified and analyzed 34,655,555 34
Average sequences/sample 2,310,370 n.a.
n.a. not applicable;OTUoperational taxonomic units.
D1 D2 D3 D4 C1
D5 C3 C2 N2 N1
0.5 1.0 1.5 2.0
0 100 200 300 400 500
Sequences/Sample (x10-6)
# of Observed OTUs
assigned to this group. There were only five phylotypes of Fusobacterium, although this was the most common genus in the entire data set.
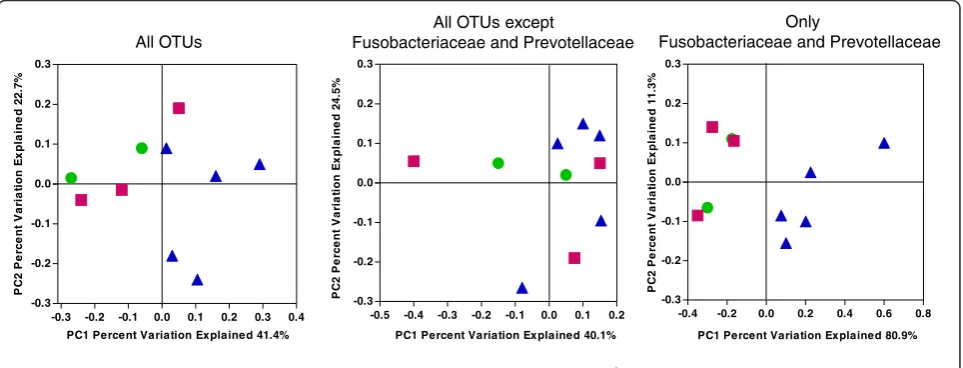
Subroutines in QIIME were used to compute the Uni-Frac weighted beta diversity distance matrix among sam-ples. Beta diversity is the measure of differences between samples in the abundance of phylotypes. Weighted Uni-Frac takes into account the phylogenetic distances be-tween the OTUs, so that it captures differences not only at the level of individual phylotypes but also differences at higher taxonomic levels. The first two principal coor-dinates are plotted in Figure 4. The normal and CIND subjects tend to cluster in the top left of the graph and the subjects with dementia tend to be in the upper and lower right half of the graph. There is no obvious separ-ation of normal from CIND. The first principal
coordinate separates all but one of the normal/CIND subjects from the participants with dementia and the second principal coordinate provides some additional separation. The observed clustering in the non-dementia samples was due to differences in Fusobacteriaceae and Prevotellaceae. When the analysis was conducted with only Fusobacteriaceae and Prevotellaceae, the first co-ordinate completely separated the participants with de-mentia from the others. When all Fusobacteriaceae and Prevotellaceae were removed and the analyses repeated, there was no clustering of the non-dementia samples (Figure 4). Dementia versus non-dementia was the only variable that produced clustering on the principal coor-dinates plot. No clustering was evident for gingivitis score, age, sex, or number of teeth (data not shown). A variety of tests were used to determine whether these
Phylum
Family
Normal
CIND
Dementia
1 2 1 2 3 1 2 3 4 5
Fusobacteriaceae Prevotellaceae Porphyromonadaceae Streptococcaceae EW055 Lactobacillaceae Lachnospiraceae Flavobacteriaceae Micrococcaceae Campylobacteraceae Veillonellaceae Actinomycetaceae TM7-Rs-045
ClostridialesFamily XI.IncertaeSedis Spirochaetaceae
Neisseriaceae Bifidobacteriaceae Dethiosulfovibrionaceae Corynebacteriaceae Pasteurellaceae Clostridiales
observed differences were statistically significant. Logis-tic regression analysis indicated that the levels of Fuso-bacterium and Prevotella were significantly different (P <0.0018 and P <0.0049, respectively) between non-dementia and non-dementia. However, random forest analysis, a somewhat more robust test of statistical significance indicated that the observed differences did not reach stat-istical significance.
Samples from multiple probing depths were obtained from 5 of the 10 participants and individual analysis of
paired samples at the phylum and genus levels are shown in Figure 5. In samples from four of the five par-ticipants, subgingival plaque harbored similar distribu-tions of genera irrespective of probing depth, although the percentages of minor genera differed substantially among participants. However, for the two samples from Dementia 3, the samples from the shallower probing depth of 3 to 5 mm contained high levels of lactobacilli and streptococci, whereas the sample from >5 mm con-tained a high level of undefined Porphyromonads.
PC1 Percent Variation Explained 41.4%
P
C
2
P
e
rc
e
n
t V
a
ri
a
ti
on E
x
pl
a
ine
d 2
2
.7
%
-0.3 -0.2 -0.1 0.0 0.1 0.2 0.3 0.4 -0.3
-0.2 -0.1 0.0 0.1 0.2 0.3
All OTUs
P
C
2
P
e
rc
e
n
t V
a
ri
a
ti
o
n E
x
pl
a
ine
d 1
1
.3
%
-0.4 -0.2 0.0 0.2 0.4 0.6 0.8 -0.3
-0.2 -0.1 0.0 0.1 0.2 0.3
PC1 Percent Variation Explained 80.9% Only
Fusobacteriaceae and Prevotellaceae
-0.5 -0.4 -0.3 -0.2 -0.1 0.0 0.1 0.2 -0.3
-0.2 -0.1 0.0 0.1 0.2 0.3
PC1 Percent Variation Explained 40.1%
P
C
2
P
e
rc
e
n
t V
a
ri
a
ti
on E
x
pl
a
ine
d 2
4
.5
%
All OTUs except
Fusobacteriaceae and Prevotellaceae
Cognitively Normal Impaired, Not Dementia Dementia
Figure 4Clustering of bacterial taxa by cognitive function.Weighted UniFrac was used to generate a matrix of pairwise distances between communities and a scatterplot was generated from the matrix of distances using Principal Coordinate Analysis in QIIME. Each symbol represents the values of all samples from one participant analyzed collectively. In the left hand panel all OTUs that occur more than 150 times are included in the analysis. In the middle panel, the OTU table is further edited to remove any OTUs assigned to the Fusobacteriaceae or Prevotellaceae. In the right hand panel, only OTUs that were identified as Fusobacteriaceae or Prevotellaceae were analyzed. (green circle) cognitively normal, (red square) cognitively impaired without dementia, and (purple triangle) dementia. OTU, Operational Taxonomic Units.
*
Discussion
The two purposes of this study were to develop a sample preparation and analysis pipeline to assess the oral microbiome using high throughput DNA sequencing, and to expand an ongoing study on the relationship be-tween oral health and cognitive function in older West Virginians.
The major advantage of the Illumina platform is its capacity to generate millions of reads from each sample. Because of the relatively short read lengths, care must be used in choosing an appropriate region of the 16S RNA gene for analysis using the Illumina platform. The V3 re-gion was selected because the primers used are the same as those used for older methods of bacterial community
Fusobacterium Prevotella Leptotrichia Streptococcus
undefined Porphyromonadaceae undefined TM7
Lactobacillus Capnocytophaga Campylobacter Rothia Porphyromonas undefined TM7
undefined Lachnospiraceae Oribacterium
Actinomyces
undefined Clostridiales Family XI Tannerella
Veillonella Treponema
undefined Dethiosulfovibrionaceae
analysis, and this region had been used previously in Illumina-based analysis of microbial communities from environmental samples [27]. The region amplified in this study is longer (170 to 190 bases) than the V6 region (105 to 120 bases) [30] or the V5 region (approximately 82 bases) [18] sequenced in other studies. Using the PCR primers described in Bartramet al. [27] it was pos-sible to run up to 12 samples per sequencing lane in this study, thereby substantially reducing the cost of the ana-lysis. However, a challenge to using this system for microbiome analysis is the relatively short read lengths that are typically generated in a run (approximately 125 bp) and the lower quality of many of these reads. These disadvantages are obviated by using a paired-end sequencing approach, and successful microbiome ana-lyses of various environmental niches [27] including the oral cavity [18,31] have been documented. Furthermore, recent additions to the QIIME program have stream-lined analysis of Illumina-generated data. We used the Greengenes database to identify the taxa corresponding to our sequences. About 5% of our sequences were not found in Greengenes; we believe that most of these are artifacts, but it is possible that a small number of rare OTUs could have been excluded, which limits the utility of this approach for identifying very rare phylotypes with a high level of confidence. Nevertheless, we successfully obtained millions of sequences from each sample, yield-ing profound details of the structure of the microbiome in subgingival plaque.
Although the main goal of this pilot study was to work out methods for obtaining high quality data and per-forming subsequent analysis using validated, universally available software and databases, two interesting obser-vations were made during the phylogenetic analysis of the data. First, a very high level of Fusobacteria was found, particularly in the samples from normal and CIND participants. Fusobacteria are well-studied anae-robes that have been found with great frequency in the oral cavity using culture-independent analyses [32-35],
and members of the genus Fusobacterium were
previ-ously found to be among the most commonly identified species in the oral cavities of elderly patients [34,35], particularly in association with root caries [35]. A second novel observation was that the levels of Fusobacteriaceae were lower, and that levels of Prevotellaceae were higher in samples from subjects with dementia compared to subjects without dementia. We had hundreds of taxa in our results, so by chance some of them would likely ap-pear to be correlated with dementia. However, Prevotel-laceae and Fusobacteriaceae are the two most abundant families of bacteria, and antibody levels to individual species in those families have been shown to increase to higher levels in people who develop dementia than in those who do not [13].
There are four possible explanations for the correla-tions between dementia and components of the micro-biome: 1) the correlations are spurious due to the small sample size; 2) dementia affects the microbiome; 3) the microbiome affects dementia; and 4) a third variable affects both.
First, we acknowledge that the sample size is small and that many more subjects need to be evaluated to obtain a robust result. Whether a larger sample size will confirm these preliminary observations is an open question.
Second, it might seem self-evident that individuals with dementia have poor oral hygiene resulting from changes in diet or oral hygiene behavior, and therefore worse oral health than individuals without dementia. As expected, the participants with dementia in this study had on average, slightly more gingivitis, fewer teeth, more caries, and much higher plaque indices. However, while this is true on average, it was not always the case on an individual basis. Participant Normal 2 had poor oral health while participants Dementia 1 and Dementia 5 had relatively good oral health, albeit with fewer teeth. Participant Dementia 2 had the highest number of teeth of all those in the study. If dementia causes poor oral health, which in turn causes the changes in the micro-biome, then the correlations between the directly related parameters (cognition and oral health, or oral health and the microbiome) should be higher than the correlation between the indirectly related parameters (cognition and the microbiome). Since we found the opposite, the data do not support the hypothesis that the observed differ-ences are merely secondary effects of poor oral hygiene in subjects with dementia.
expressed in dementia patients and play a role in disease awaits metagenomic analyses. There were no other pre-dominant phylotypes found in higher levels in partici-pants with dementia compared to non-dementia, arguing against the idea that the presence of certain bacteria pro-motes dementia. However, the fact that higher levels of Fusobacteriaceae were found in all samples from partici-pants without dementia suggests an alternate explanation, that perhaps certain oral bacteria provide protection against dementia, possibly by filling environmental niches that could be populated by more inflammatory microor-ganisms, by actively suppressing local or systemic inflam-matory responses, or by producing biomolecules that are neuroprotective.
The final possibility is that both dementia and the microbiome are affected by a third variable. There is a strong genetic link to some forms of dementia, including the presence of the APOE-e4 variant of the Apolipopro-tein E gene [38]. It is possible that the presence or ab-sence of specific taxa could be due to genetic factors in the subject such as host immune responses, expression of adhesion molecules on host tissues that affect bacter-ial adherence, or other undefined factors. The relation-ship between human genotype and the oral microbiome needs to be studied carefully.
Sparks Stein et al. [13] found elevated levels of anti-bodies toPrevotella intermediaandFusobacterium nucle-atum in the blood of subjects who later developed AD. These investigators also found that subjects with Mild Cognitive Impairment (MCI), unlike AD subjects, had no differences inP. intermediaand F. nucleatumcompared to normal subjects, but had reduced levels of antibodies to several other oral bacteria. Similarly, we found that our normal and CIND subjects did not separate based on their microbiome beta diversity and, in particular, that their Prevotellaceae and Fusobacteriaceae were similar. We hypothesize that our results can be reconciled with those of Sparks Stein et al. by predicting that subjects who will develop dementia have a leakier sub-gingival compartment resulting in increased interaction between the microbiome and the immune system, leading to higher antibody levels to the most prevalent bacteria: Fusobacterium and Prevotella. Compared to Prevotella, Fusobacteria are much less genetically diverse at the 16S gene, so they might be more sensitive to elevated serum antibody levels because of less diversity of surface pro-teins that could serve as targets for antibodies. Thus, later in life one might predict that higher levels of antibody might reduce levels of Fusobacteria yet fail to be as effect-ive against genetically deffect-iverse Prevotella. Alternatively, it is possible that the difference in findings for Fusobacteria-ceae might be because Sparks Steinet al. were using anti-bodies that would differentiate strains on the basis of surface proteins while we used 16S ribosomal sequences.
In summary, our results demonstrate, via high through-put DNA sequencing, that substantial inter-person vari-ability exists in the oral microbiome of subgingival plaque. There appears to be a consistent difference in the levels of Fusobacteriaceae, and perhaps Prevotellaceae, in samples from patients who do or do not have dementia, which should be studied in more detail.
Conclusions
We have shown that high throughput DNA sequencing is an effective and inexpensive method for analyzing the microbiome of oral subgingival plaque from individual subjects. It is sensitive enough to provide a measure of the bacteria from a single sampling site. Substantial inter-person variability exists in the sub-gingival plaque microbiome, while there is generally little variation at depths ranging from 1 to 5 mm in an individual subject's mouth. There appears to be a consistent difference in the levels of Fusobacteriaceae, and perhapsPrevotella, in samples from patients who do or do not have dementia, which should be studied in more detail.
Additional file
Additional file 1:Comma Separated Value (.csv).Trimmed OTU Table Generated by QIIME. This is a comma separated value table that is generated by QIIME listing the number of hits for each OTU in each sample. The table has been trimmed to include all phylotypes that occur at least 150 times in the analysis.
Abbreviations
AD: Alzheimer’s Disease; ANOVA: analysis of variance; bp: base pair; CIND: cognitive impairment without dementia; IgG: immunoglobulin G; MCI: Mild Cognitive Impairment; NHANES-III: Third National Health and Nutrition Examination Survey; OTU: operational taxonomic unit; PPD: pocket probing depth; QIIME: Quantitative Insights into Microbial Ecology.
Competing interests
The authors declare that they have no competing interests.
Authors’contributions
AFC aided in study design, carried out DNA isolation, amplification, and purification, performed data analysis, and helped draft the manuscript. JD wrote programming code for aligning and organizing sequences and performed data analysis. TN coordinated the study, obtained samples, performed evaluations and organized clinical data. DP, GB, and JD participated in study design and performed DNA sequencing and primary evaluation of sequencing data. RC participated in study design, in recruitment and evaluation of participants and helped draft the manuscript. BW and BP participated in the design of the study and performed analysis of data related to cognitive function and helped draft the manuscript. CC conceived of the study, participated in its design and execution, and helped to draft the manuscript. All authors read and approved the final manuscript.
Acknowledgements
samples from the earlier study. The authors thank the study participants and their families.
Author details
1Microbiology, Immunology & Cell Biology, School of Medicine, Robert C.
Byrd Health Sciences Center, West Virginia University, P.O. Box 4622, Morgantown, WV 26506-4622, USA.2Periodontics, School of Dentistry, Robert
C. Byrd Health Sciences Center, West Virginia University, P.O. Box 9400, Morgantown, WV 26506-9400, USA.3Department of Biochemistry and
Microbiology, Robert C. Byrd Biotechnology Science Center, Joan C. Edwards School of Medicine, One John Marshall Drive, Huntington, WV 25755, USA.
4
Department of Psychiatry and Behavioral Sciences, Duke University Medical Center, 2200 West Main Street, Durham, NC 27706, USA.5School of Nursing
and Global Health Institute, Duke University, 307 Trent Drive, Durham, NC 27710, USA.
Received: 28 June 2012 Accepted: 30 August 2012 Published: 21 September 2012
References
1. Kamer AR, Dasanayake AP, Craig RG, Glodzik-Sobanska L, Bry M, Leon MJ:
Alzheimer's disease and peripheral infections: the possible contribution from periodontal infections, model and hypothesis.J Alzheimers Dis2008,
13:437–449.
2. Kaye EK, Valencia A, Baba N, Spiro A, Dietrich T, Garcia RI:Tooth loss and periodontal disease predict poor cognitive function in older men.J Am Geriatr Soc2010,58:713–718.
3. Grabe HJ, Schwahn C, Völzke H, Spitzer C, Freyberger HJ, John U, Mundt T, Biffar R, Kocher T:Tooth loss and cognitive impairment.J Clin Periodontol
2009,36:550–557.
4. Stewart R, Hirani V:Dental health and cognitive impairment in an English national survey population.J Am Geriatr Soc2007,55:1410–1414. 5. Wu B, Plassman BL, Crout RJ, Liang J:Cognitive function and oral health
among community-dwelling older adults.J Gerontol A Biol Sci Med Sci
2008,63:495–500.
6. Stein PS, Kryscio RJ, Desrosiers M, Donegan SJ, Gibbs MB:Tooth loss, apolipoprotein E, and decline in delayed word recall.J Dent Res2010,
89:473–477.
7. Kamer AR, Craig RG, Pirraglia E, Dasanayake AP, Norman RG, Boylan RJ, Nehorayoff A, Glodzik L, Brys M, de Leon MJ:TNF-alpha and antibodies to periodontal bacteria discriminate between Alzheimer's disease patients and normal subjects.J Neuroimmunol2009,216:92–97.
8. Batty GD, Li Q, Huxley R, Zoungas S, Taylor BA, Neal B, de Galan B, Woodward M, Harrap SB, Colagiuri S, Patel A, Chalmers J, On behalf of the ADVANCE Collaborative group:Oral disease in relation to future risk of dementia and cognitive decline: prospective cohort study based on the Action in Diabetes and Vascular Disease: Preterax and Diamicron Modified-Release Controlled Evaluation (ADVANCE) trial.Eur Psychiatry
2011, epub ahead of print.
9. Miklossy J:Alzheimer's disease–a spirochetosis?Neuroreport1993,
4:841–848.
10. Riviere GR, Riviere KH, Smith KS:Molecular and immunological evidence of oral Treponema in the human brain and their association with Alzheimer's disease.Oral Microbiol Immunol2002,17:113–118. 11. Stewart R, Sabbah W, Tsakos G, D'Aiuto F, Watt RG:Oral health and
cognitive function in the Third National Health and Nutrition Examination Survey (NHANES III).Psychosom Med2008,70:936–941. 12. Noble JM, Borrell LN, Papapanou PN, Elkind MS, Scarmeas N, Wright CB:
Periodontitis is associated with cognitive impairment among older adults: analysis of NHANES-III.J Neurol Neurosurg Psychiatry2009,
80:1206–1211.
13. Sparks SP, Steffen MJ, Smith C, Jicha G, Ebersole JL, Abner E, Dawson D III:
Serum antibodies to periodontal pathogens are a risk factor for Alzheimer's disease.Alzheimers Dement2012,8:196–203.
14. Aas JA, Paster BJ, Stokes LN, Olsen I, Dewhirst FE:Defining the normal bacterial flora of the oral cavity.J Clin Microbiol2005,43:5721–5732. 15. Dewhirst FE, Chen T, Izard J, Paster BJ, Tanner AC, Yu WH, Lakshmanan A,
Wade WG:The human oral microbiome.J Bacteriol2010,192:5002–5017. 16. Olson JC, Cuff CF, Lukomski S, Lukomska E, Canizales Y, Wu B, Crout RJ,
Thomas JG, McNeil DW, Weyant RJ, Marazita ML, Paster BJ, Elliott T:Use of 16S ribosomal RNA gene analyses to characterize the bacterial signature
associated with poor oral health in West Virginia.BMC Oral Health2011,
11:7.
17. Lazarevic V, Whiteson K, Gaia N, Gizard Y, Hernandez D, Farinelli L, Osteras M, Francois P, Schrenzel J:Analysis of the salivary microbiome using culture-independent techniques.J Clin Bioinforma2012,2:4. 18. Lazarevic V, Whiteson K, Huse S, Hernandez D, Farinelli L, Osteras M,
Schrenzel J, Francois P:Metagenomic study of the oral microbiota by Illumina high-throughput sequencing.J Microbiol Methods2009,
79:266–271.
19. Keijser BJ, Zaura E, Huse SM, van der Vossen JM, Schuren FH, Montijn RC, ten Cate JM, Crielaard W:Pyrosequencing analysis of the oral microflora of healthy adults.J Dent Res2008,87:1016–1020.
20. Wu B, Goedereis EA, Crout RJ, Plassman BL, DiNapoli EA, McNeil DW, Wiener M, Boone ML, Wiener RC, Kao E, Bai L:Recruitment of rural and cognitively impaired older adults for dental research.Spec Care Dentist2010,
30:193–199.
21. Caporaso JG, Kuczynski J, Stombaugh J, Bittinger K, Bushman FD, Costello EK, Fierer N, Pena AG, Goodrich JK, Gordon JI, Huttley GA, Kelley ST, Knights D, Koenig JE, Ley RE, Lozupone CA, McDonald D, Muegge BD, Pirrung M, Reeder J, Sevinsky JR, Turnbaugh PJ, Walters WA, Widmann J, Yatsunenko T, Zaneveld J, Knight R:QIIME allows analysis of high-throughput community sequencing data.Nat Methods2010,7:335–336.
22. Centers for Disease Control and Prevention (CDC):National Center for Health Statistics (NCHS). National Health and Nutrition Examination Survey Examination Protocol. Hyattsville, MD: U.S. Department of Health and Human Services; 2001.
23. Shah A, Phongsathorn V, Bielawska C, Katona C:Screening for depression among geriatric inpatients with short versions of the Geriatric Depression Scale.Int J Geriatr Psychiatry1996,11:915–918.
24. American Psychiatric Association:Diagnostic and Statistical Manual of Mental Disorders. Washington DC: American Psychiatric Association; 1994. 25. Plassman BL, Steffens DC, Burke JR, Welsh-Bohmer KA, Newman TN,
Drosdick D, Helms MJ, Potter GG, Breitner JC:Duke twins study of memory in aging in the NAS-NRC twin registry.Twin Res Hum Genet2006,
9:950–957.
26. Plassman BL, Langa KM, McCammon RJ, Fisher GG, Potter GG, Burke JR, Steffens DC, Foster NL, Giordani B, Unverzagt FW, Welsh-Bohmer KA, Heeringa SG, Weir DR, Wallace RB:Incidence of dementia and cognitive impairment, not dementia in the United States.Ann Neurol2011,
70:418–426.
27. Bartram AK, Lynch MD, Stearns JC, Moreno-Hagelsieb G, Neufeld JD:
Generation of multimillion-sequence 16S rRNA gene libraries from complex microbial communities by assembling paired-end Illumina reads.Appl Environ Microbiol2011,77:3846–3852.
28. R Development Core Team:R: A language and environment for statistical computing. Vienna, Austria: R Foundation for Statistical Computing; 2011. 29. Nadkarni MA, Browne GV, Chhour KL, Byun R, Nguyen KA, Chapple CC,
Jacques NA, Hunter N:Pattern of distribution of Prevotella species/ phylotypes associated with healthy gingiva and periodontal disease.Eur J Clin Microbiol Infect Dis2012, in press.
30. Gloor GB, Hummelen R, Macklaim JM, Dickson RJ, Fernandes AD, MacPhee R, Reid G:Microbiome profiling by illumina sequencing of combinatorial sequence-tagged PCR products.PLoS One2010,5:e15406.
31. Lazarevic V, Whiteson K, Hernandez D, Francois P, Schrenzel J:Study of inter- and intra-individual variations in the salivary microbiota.BMC Genomics2010,11:523.
32. Colombo AP, Bennet S, Cotton SL, Goodson JM, Kent R, Haffajee AD, Socransky SS, Hasturk H, Van Dyke TE, Dewhirst FE, Paster BJ:Impact of periodontal therapy on the subgingival microbiota of severe periodontitis: comparison between good responders and "refractory" subjects by the human oral microbe identification microarray (HOMIM).J Periodontol2012, in press.
33. Ahn J, Yang L, Paster BJ, Ganly I, Morris L, Pei Z, Hayes RB:Oral microbiome profiles: 16S rRNA pyrosequencing and microarray assay comparison. PLoS One2011,6:e22788.
34. Preza D, Olsen I, Willumsen T, Grinde B, Paster BJ:Diversity and site-specificity of the oral microflora in the elderly.Eur J Clin Microbiol Infect Dis2009,28:1033–1040.
35. Preza D, Olsen I, Willumsen T, Boches SK, Cotton SL, Grinde B, Paster BJ:
36. Alauzet C, Marchandin H, Lozniewski A:New insights into Prevotella diversity and medical microbiology.Future Microbiol2010,5:1695–1718. 37. Masakiyo Y, Yoshida A, Shintani Y, Takahashi Y, Ansai T, Takehara T:The
identification of genes specific toPrevotella intermediaandPrevotella nigrescensusing genomic subtractive hybridization.Anaerobe2010,
16:265–269.
38. Ward A, Crean S, Mercaldi CJ, Collins JM, Boyd D, Cook MN, Arrighi HM:
Prevalence of apolipoprotein E4 genotype and homozygotes (APOE e4/ 4) among patients diagnosed with Alzheimer's disease: a systematic review and meta-analysis.Neuroepidemiology2012,38:1–17.
doi:10.1186/2041-2223-3-19
Cite this article as:Cockburnet al.:High throughput DNA sequencing to detect differences in the subgingival plaque microbiome in elderly subjects with and without dementia.Investigative Genetics20123:19.
Submit your next manuscript to BioMed Central and take full advantage of:
• Convenient online submission
• Thorough peer review
• No space constraints or color figure charges
• Immediate publication on acceptance
• Inclusion in PubMed, CAS, Scopus and Google Scholar
• Research which is freely available for redistribution