Ann. Geophys., 27, 687–703, 2009 www.ann-geophys.net/27/687/2009/
© Author(s) 2009. This work is distributed under the Creative Commons Attribution 3.0 License.
Annales
Geophysicae
Global structure, seasonal and interannual variability of the
migrating semidiurnal tide seen in the SABER/TIMED
temperatures (2002–2007)
D. Pancheva, P. Mukhtarov, and B. Andonov
Geophysical Institute, Bulgarian Academy of Sciences, Sofia, Bulgaria
Received: 14 October 2008 – Revised: 4 January 2009 – Accepted: 16 January 2009 – Published: 12 February 2009
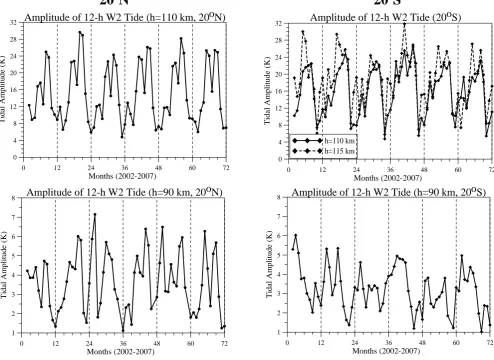
Abstract. The present paper is focused on the global spa-tial (altitude and latitude) structure, seasonal and interannual variability of the migrating semidiurnal tide derived from the SABER/TIMED temperature measurements for 6 years (January 2002–December 2007). The tidal results are ob-tained by a new analysis method where the tides (migrating and nonmigrating) and the planetary waves (zonally travel-ling and stationary) are simultaneously extracted from the satellite data. The strongest migrating semidiurnal tide has been derived at tropical latitudes (±20–30◦) where it re-vealed significant amplification between May and August in the lower thermosphere of both hemispheres. On the aver-age, the semidiurnal temperature tide is stronger in the SH (32 K) than that in the NH (30 K) and the tidal amplitudes at 110 km height are nearly a factor of 5 larger than those at 90 km. The migrating semidiurnal tide in both hemispheres revealed remarkable seasonal behavior at the altitude where it maximizes,∼110 km in the NH and∼115 km in the SH, indicating repeatable each year maxima exactly in May–June and August. However, while the main maximum in the NH is that in August, in the SH it is that in May. The vertical wave-lengths indicated seasonal variability being larger in summer (∼38–50 km) than in winter (∼25–35 km). The seasonal be-havior of the semidiurnal tide in the middle latitudes (±40◦) is dominated by annual variability with a winter maximum in the upper mesosphere (90 km) of both hemispheres and summer one in the lower thermosphere (110 km). The NH summer maximum (June and August peaks) is much stronger than that in the SH (November and March peaks) having am-plitudes of∼23 K and∼13–15 K respectively. The vertical wavelengths at both hemispheres indicated slight seasonal changes and a mean vertical wavelength of∼35 km is ob-served during most of the year. The interannual variability of
Correspondence to: D. Pancheva
the semidiurnal tide in the midlatitude lower thermosphere is at least partly connected with the stratospheric QBO as this effect is stronger in the NH.
Keywords. Meteorology and atmospheric dynamics (Mid-dle atmosphere dynamics; Thermospheric dynamics; Waves and tides)
1 Introduction
Atmospheric solar tides profoundly affect the large-scale dy-namics of the mesosphere and lower thermosphere (MLT) where they attain large amplitudes and dominate the large-scale wind and temperature fields. Like other waves the tidal components grow in amplitude with increasing alti-tude since atmospheric density decreases and energy must be conserved. Migrating (or Sun-synchronous) solar tides are global-scale atmospheric waves which propagate westward with the apparent motion of the Sun and have periods that are harmonics of a solar day. Thus the migrating semidiur-nal tide is a westward propagating zosemidiur-nal wavenumber 2 (W2) perturbation. The migrating tides are forced predominantly in the troposphere and stratosphere and propagate vertically to the lower thermosphere. The absorption of solar radia-tion by a zonally uniform medium gives rise to migrating solar tides. Their presence in the atmosphere is due to the tropospheric water vapor (H2O) absorption of infrared
radi-ation (IR), stratospheric and lower mesospheric ozone (O3)
absorption of ultraviolet (UV) radiation, mesospheric molec-ular oxygen (O2)absorption in the Schumann-Runge bands
688 D. Pancheva et al.: Migrating semidiurnal tide in the SABER/TIMED temperatures 1981; Williams and Avery, 1996; Hagan, 1996; Forbes et al.,
1997; Hagan and Forbes, 2003). Another important source of nonmigrating tides is the nonlinear interaction between the migrating tides and the stationary planetary waves (SPWs) (Angelats i Coll and Forbes, 2002).
Both ground-based and satellite observations have re-vealed many important features of the semidiurnal tide. A major advantage of the ground-based methods is their ability to study in detail seasonal, intraseasonal and interannual vari-ability of the tides in the MLT at various geographic points (Bernard, 1981; Avery et al., 1989; Manson et al., 1990, 1999; Clark and Salah, 1991; Vincent et al., 1998; Jacobi et al., 1999; Pancheva et al., 2000, 2002), as well as their vertical structure including vertical wavelengths and direc-tion of propagadirec-tion (Mitchell et al., 2002; She et al., 2004; Yuan et al., 2008). A disadvantage of the ground-based meth-ods is their inability to distinguish between global and local signatures and to provide only coarse information on spa-tial (latitudinal and longitudinal) structures of the tides. The seasonal variation of the MLT semidiurnal tide observed by MF radars showed an autumn equinox maximum localized at height∼85–88 km (Manson et al., 2002; Riggin et al., 2003), while the meteor radar measurements not only documented this localized autumn maximum, but indicated also an ampli-fication of the tide again above∼93–95 km altitude (Manson et al., 2004). The meteor radar observations revealed also that the winter maximum of the semidiurnal tide is actually the main maximum in the MLT region (Mitchell et al., 2002; Manson et al., 2004; Pancheva and Mitchell, 2004). The win-ter maximum of the semidiurnal tide was documented by the lidar (Yuan et al., 2008) and satellite (Burrage et al., 1995) measurements as well. Observational studies of the semid-iurnal tide have revealed a very high degree of variability in tidal characteristics occurring over a range of time scales including short-term (several days), seasonal and long-term (including interannual and solar-cycle) changes. Long-term variations of the semidiurnal tide are thought to arise from changes in the strength and distribution of the tidal forcing, and changes in the propagation characteristics of the tide as it ascends through the middle atmosphere from its predomi-nantly troposphere/stratosphere sources towards the MLT re-gion (Vial, 1989).
The satellite observations from the HRDI (High Reso-lution Doppler Imager), WINDII (Wind Imaging Interfer-ometer) and MLS (Microwave Limb Sounder) instruments on board the UARS (Upper Atmosphere Research Satellite) satellite have provided a global scale picture of the semid-iurnal tide seen in the neutral wind and temperature fields of the mesosphere and lower thermosphere (Burrage et al., 1995; McLandress et al., 1994, 1996; Forbes and Wu, 2006). It is important to note that the satellite observations enable the researchers to separate the nonmigrating from migrating semidiurnal tides and to study their global structures. Both ground-based and satellite observations have revealed that the migrating semidiurnal tide in the MLT region indicates a
main maximum in the winter months when its amplitude in-creases with increasing the height and a secondary maximum in September when the maximum is localized near height of 85–88 km.
Modelling studies have also made some progress in repro-ducing both the observed latitude-height structure in a par-ticular season and the observed seasonal variability (Forbes, 1982; Vial, 1986; Portnyagin and Kajdalov, 1986; Forbes and Vial, 1989, Hagan et al., 1995, 1999, 2001; Hagan and Forbes, 2003). By combining observations from 23 ground-based radars from various locations Pancheva et al. (2002) were able to assemble the global pictures of the diurnal and semidiurnal tides and compared them with the GSWM-00 in order to investigate the model ability to simulate the solar tides in the mesopause region (90–95 km). It was found that the GSWM-00 provides a reasonable estimate of the tidal characteristics, however, the representation of the 24-h tide appears superior to that of the 12-h tide.
D. Pancheva et al.: Migrating semidiurnal tide in the SABER/TIMED temperatures 689 2 Observations and method for data analysis
2.1 SABER temperature data
The TIMED satellite was launched on 7 December 2001 and the SABER instrument began making observations in Jan-uary 2002. It measures CO2infrared limb radiance from
ap-proximately 20 km to 120 km altitude and the kinetic temper-ature profiles are retrieved over these heights using a full non-LTE inversion (Mertens et al., 2001, 2004). The retrieval er-rors, in addition to those associated with instrumental noise, are estimated by Mertens et al. (2001) and they have been found in the range between 1.4% at 80 km and 22.5% at 110 km. In this study, however, the fidelity with which the temperature variations can be determined is primarily impor-tant. In this connection, apparent variations introduced into the SABER temperatures by unmodeled variability in the as-sumed atomic oxygen densities is of prime concern and for this reason the results at the upper altitude of 110–120 km should be accepted with caution (Forbes et al., 2006).
The SABER views the atmosphere 90◦to the satellite ve-locity vector in a 625 km and 73◦ inclination orbit so that latitude coverage on a given day extends from about 53◦ in one hemisphere to 83◦ in the other. About every 60 days, the latitude ranges flip as the spacecraft yaws to keep the in-strument on the anti-sun side of the spacecraft. In this way high latitude data are available only in 60-day segments, with no information for the 60 days preceding or following. This is the reason not to generate results poleward of 50◦. The TIMED orbit precesses to cover 12 h of local time in each 60-day yaw period, as ascending and descending data together give almost 24 h of local time sampling. Our results are de-rived from the version 1.07 of the SABER data, which were downloaded from the web site: http://saber.gats-inc.com/. It is worth noting that the latest version 1.07 is substantially improved particularly for the results in the upper mesosphere and lower thermosphere region (Garcia-Comas et al., 2008). The algorithms for both day and night data use monthly and diurnally averaged CO2 profiles from the distributions with
latitude derived by the Whole Atmosphere Community Cli-mate Model (WACCM) (Garcia et al., 2007). We use temper-ature data from January 2002 to December 2007, almost full 6 years, in order to study the temporal variability and global spatial structure of the migrating semidiurnal tide exhibited by the monthly mean tidal amplitudes and phases. The data were averaged into 5 km altitude and 10◦latitude bins and each bin was independently fit. We work in UT and for each altitude (from 20 to 120 km at each 5 km) and latitude (from 50◦S to 50◦N at each 10◦)the data were arranged in a matrix with 24 columns (this is the longitude with a step of 15◦)and the number of rows is equal to the length of the considered period of time (January 2002–December 2007) in hours.
2.2 Method for extracting waves from the Saber tem-peratures
The data analysis method for calculating the monthly mean tidal characteristics has been described in detail in the com-plimentary paper of a migrating diurnal tide (Mukhtarov et al., 2009), therefore here it will be only briefly summarized. This method is composed by two steps: first, the daily char-acteristics of the investigated waves calculated for the entire 6-year period of time (2002–2007) are derived, and second, the monthly mean wave characteristics are calculated by geo-metrical averaging of the daily wave parameters for each cal-endar month. The seasonal behavior of the wave character-istics during the entire 6-year period of time is estimated by the geometrical averaging of the monthly mean wave charac-teristics for each month of the year.
In order to extract the waves from the SABER data (i.e. to determine their amplitudes and phases) at a given lati-tude and altilati-tude, a linear two-dimensional (time-longilati-tude) least-squares fitting is applied to a 60-day time segment of data (because it takes SABER 60 days to sample 24 h in lo-cal time by combining ascending and descending data to-gether). Then this segment is moved through the time se-ries with steps of 1 day in order to derive daily values of the wave amplitudes and phases. The decomposition includes: (i) diurnal and semidiurnal tides with zonal wavenumbers up to 4, (ii) zonally travelling planetary waves with zonal wavenumbers up to 3 (including zonally symmetric waves as well), and (iii) the first three modes of the SPWs, i.e. SPWs with zonal wavenumbers 1, 2 and 3. The well-known zon-ally travelling normal planetary wave modes with periods near 5, 10 and 16 days are included in the fitting procedure. The∼24-day wave is also regularly observed in the strato-sphere and mesostrato-sphere particularly in the winter (Pancheva and Mitchell, 2004; Pancheva et al., 2008, 2009b), hence this planetary wave period is included in the fitting procedure as well. It is worth noting that the quasi-2-day wave is excluded from the fitting procedure because of its burst-like behavior with time scales near or less than a month and because of using a rather long time window, a 60-day one, for extract-ing the waves. All waves are extracted simultaneously in order to avoid a possible distortion of the weaker waves by the stronger ones and some aliasing between the tides and the SPWs. Over 60 days the temperature variations can be due to seasonal or intraseasonal time scales. A possible effect of the semiannual oscillation is expressed by including also a linear term in the temperature decomposition.
690 D. Pancheva et al.: Migrating semidiurnal tide in the SABER/TIMED temperatures
0.0 1.5 3.0 4.5 6.0 7.5 9.0 0 5 10 15 20 25 30
h=110 km
h=90 km
12-h W2 Tide
h=70 km
Figure 1
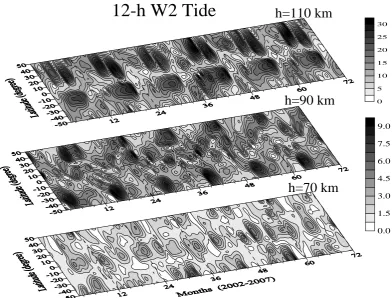
Fig. 1. Latitude-time cross sections of the semidiurnal tidal amplitudes (in Kelvin) at three altitudes: 110 km (upper plot), 90 km (middle
plot) and 70 km (bottom plot); the scale (in Kelvin) for the 110 km level is different from that for 70 km and 90 km.
pattern and variance as those of the true SABER measure-ments (Kong et al., 1998). Then the 2-D Lomb-Scargle peri-odogram has been performed on the resulting noise datasets. The reference noise spectrum for each zonal wavenumber is calculated as an average spectrum. The results from this analysis indicated that only because of data sampling pat-tern and the planetary wave variability in the winter time all noise spectra revealed a cluster of peaks near 24 h with am-plitudes on the average between 0.55 and 0.95 K. Therefore, all tidal waves extracted from a given 60-day time window with amplitudes larger than 1 K are accepted as statistically significant.
3 Results
The climatological features of the migrating semidiurnal temperatures are investigated by the distribution of the monthly mean tidal amplitudes and phases in the time and space (latitude and altitude). The result of data analysis cov-ers with monthly mean tidal amplitudes and phases the in-terval between February 2002 and December 2007. Figure 1 shows the latitude (50◦N–50◦S) – time cross sections of the tidal amplitudes for three altitudes: 70, 90 and 110 km. We note that below 70 km height the migrating 12-h tide is usu-ally very weak. The scale (in Kelvin) of the plot for 110 km
height is different from that used for 70 and 90 km indicat-ing a very rapid growth of the tidal amplitude with increasindicat-ing the height in the lower thermosphere. The results from Fig. 1 can be summarized as follows: (i) at 70 km level the semid-iurnal tide maximizes mainly at the equator reaching ampli-tude of 4–4.5 K; there is also some amplification near middle latitudes as the equatorial and midlatitude maxima are sepa-rated by almost absent of the semidiurnal tide at±20◦; (ii) at 90 km altitude the semidiurnal tide maximizes toward middle latitudes,±(30–40◦), reaching amplitude of 9 K; the tempo-ral variability is dominated by annual oscillation with a win-ter maximum; and (iii) in the lower thermosphere (110 km) the semidiurnal tide maximizes near tropics,±(20–30◦), and in both hemispheres it reaches very large amplitude,∼30 K, between May and September; in the Northern Hemisphere (NH) there is a bifurcation of this maximum into two maxima respectively in May–June centered at∼30◦N and in August– September centered at∼20◦N.
[image:4.595.99.492.63.361.2]D. Pancheva et al.: Migrating semidiurnal tide in the SABER/TIMED temperatures 691
12 24 36 48 60 72 70
80 90 100 110 120
Height (k
m)
0 4 9 13 17 22 26
12 24 36 48 60 72
Months (2002-2007)
70 80 90 100 110 120
He
ight
(km)
-180 -120 -60 0 60 120 180
12-h W2 Tide (40N) 12-h W2 Tide (40S)
12 24 36 48 60 72 70
80 90 100 110 120
Height (k
m)
0 4 9 13 17 22 26
12 24 36 48 60 72
Months (2002-2007)
70 80 90 100 110 120
Hei
g
ht
(km
)
-180 -120 -60 0 60 120 180
[image:5.595.47.550.64.229.2]Figure 2
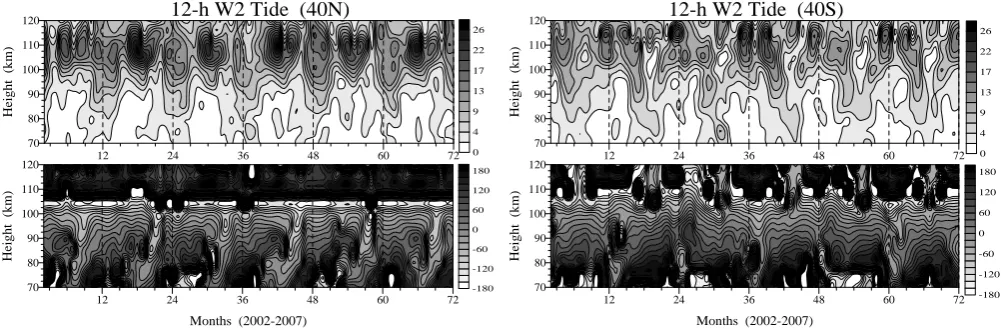
Fig. 2. Altitude-time cross sections of the tidal amplitudes in Kelvin (upper row of plots) and phases in degrees (bottom row of plots)
observed at 40◦N (left column of plots) and 40◦S (right column of plots).
3.1 Altitude tidal structure
3.1.1 Middle latitudes (40◦N and 40◦S)
Figure 2 shows the altitude-time cross sections of the tidal amplitudes (upper row of plots) and phases (bottom row of plots) observed at 40◦N (left column of plots) and 40◦S (right column of plots) in the altitude range between 70 and 120 km (it has been already mentioned that usually the semidiurnal tidal amplitudes below 70 km height are too small to be meaningful along with their phases). In order to facilitate the comparison between the tidal characteristics in both hemispheres the scales are the same. The tidal ampli-tudes are similar in both hemispheres with a slight superior-ity of those from the NH. The tidal amplitude increases with increasing the height and it reaches the largest values near 110 km in the NH and near 115 km in the Southern Hemi-sphere (SH). At the mesospheric levels the semidiurnal tide amplifies in the winter, while in the lower thermosphere the main maximum is in summer and the secondary one – in win-ter (see for details the next figure). For altitudes between 70 and 90 km besides the winter maximum an autumn (Septem-ber in the NH and March in the SH) tidal amplification is evi-dent as well. The phase distribution indicates that the semid-iurnal tide is vertically upward propagating wave. Some sea-sonal variability of the vertical phase gradient (wavelength) can be distinguished from the phase plot as it is slightly larger (the wavelength is shorter) in winter than in summer. On the average, the vertical wavelength of the semidiurnal tide at both hemispheres is∼35 km as the difference between the summer and winter wavelength is not more than 5 km.
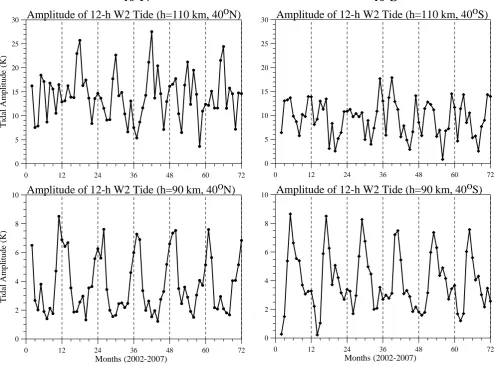
Figure 3 presents the monthly mean amplitudes of the semidiurnal tide at heights: 110 km (upper row of plots) and 90 km (bottom row) for 40◦N (left column of plots) and 40◦S (right column). The temporal variability of the tidal amplitude at 90 km height is dominated by annual
oscilla-tion with winter maximum reaching 8–9 K and summer min-imum of∼1–2 K in both hemispheres. While in the SH the winter maximum at 90 km height is always in May that in the NH is more frequently in January–February. Whereas in the SH there is a signature for reducing the amplitude of the annual oscillation from 2002 to 2007, such effect is al-most absent in the NH. The tidal amplitudes at 110 km reveal different seasonal variability in both hemispheres. The semi-annual oscillation with solstice maxima dominates the tidal amplitudes in the NH; the main maximum is observed in the summer reaching∼25–28 K and a secondary one in the win-ter with amplitudes of∼15–17 K. It is worth noting that the summer maximum is always in June and there is clear 2-year amplification of the June maximum in 2003, 2005 and 2007. A superposition of annual and semiannual variabilities with maxima in summer and autumn months and minimum in the winter dominates the behavior of the tidal amplitudes in the SH. The maxima are observed predominantly in November and March reaching amplitudes of∼15–17 K. A slight 2-year effect on the summer tidal amplitudes at 110 km height could be distinguished in the SH as some amplification is seen in 2002/2003, 2004/2005 and 2006/2007.
692 D. Pancheva et al.: Migrating semidiurnal tide in the SABER/TIMED temperatures
40
oN 40
oS
0 12 24 36 48 60 72
0 5 10 15 20 25 30
Ti
d
al
A
m
pl
it
u
d
e (
K
)
Amplitude of 12-h W2 Tide (h=110 km, 40oN)
0 12 24 36 48 60 72
0 5 10 15 20 25
30
Amplitude of 12-h W2 Tide (h=110 km, 40oS)
0 12 24 36 48 60 72 0 12 24 36 48 60 72
Months (2002-2007)
0 2 4 6 8
10
Amplitude of 12-h W2 Tide (h=90 km, 40oS)
Months (2002-2007)
0 2 4 6 8 10
Ti
d
al
A
m
pl
it
u
d
e (
K
)
Amplitude of 12-h W2 Tide (h=90 km, 40oN)
Figure 3
Fig. 3. Temporal distribution of the monthly mean tidal amplitudes at heights: 110 km (upper row of plots) and 90 km (bottom row of plots)
for 40◦N (left column of plots) and 40◦S (right column).
of 23 K and a secondary winter one of 14–15 K and aver-age equinoctial minima of 6–10 K. The averaver-age summer and autumn maxima in the SH are significantly smaller than the summer maximum in the NH reaching values of∼13–15 K; the winter minimum is also weaker than the equinoctial min-ima in the NH having amplitudes of 2–5 K. The tidal phases at altitude of 110 km indicate that while in the NH the sum-mer phases are larger than the winter ones (average sumsum-mer phase is 180◦ or it is 06:00 LT and average winter phase is 120◦, i.e. 04:00 LT) in the SH the opposite tendency is ob-served; the average summer and autumn phases are∼180◦, i.e. 06:00 LT, the winter ones are∼270◦–300◦, i.e. between 09:00 LT and 10:00 LT.
3.1.2 Tropical latitudes (20◦N and 20◦S and equator)
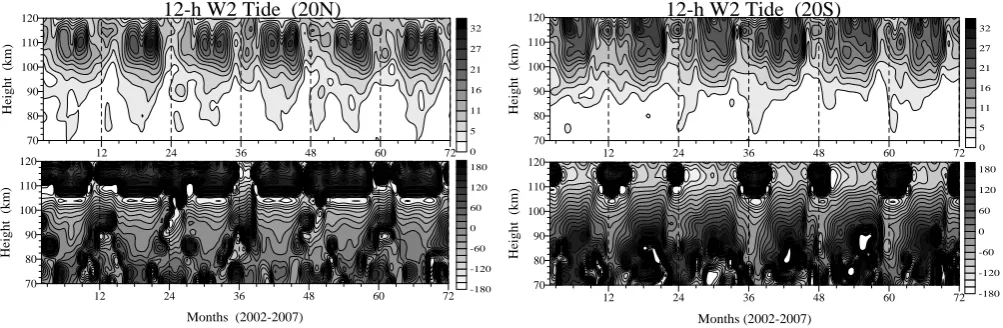
Figure 5 shows the altitude-time cross sections of the tidal amplitudes (upper row of plots) and phases (bottom row of
[image:6.595.51.552.76.442.2]D. Pancheva et al.: Migrating semidiurnal tide in the SABER/TIMED temperatures 693
40
oN 40
oS
1 2 3 4 5 6 7 8 9 10 11 12
Months 0 4 8 12 16 20 24 Ti d a l A m pl it ud e ( K ) -180 -120 -60 0 60 120 180 Tida l P h a se ( d e g ree )
12-h W2 Tide (h=110 km, 40oN)
1 2 3 4 5 6 7 8 9 10 11 12
Months 0 4 8 12 16 20 24 Ti d a l A m pl it ud e ( K ) -180 -120 -60 0 60 120 180 Tida l P h a se ( d e g ree )
12-h W2 Tide (h=110 km, 40oS)
1 2 3 4 5 6 7 8 9 10 11 12
Months 0 1 2 3 4 5 6 7 8 Tida l A m p lit ud e ( K ) -180 -120 -60 0 60 120 180 T id a l P h as e (d eg ree )
12-h W2 Tide (h=90 km, 40oN)
1 2 3 4 5 6 7 8 9 10 11 12
Months 0 1 2 3 4 5 6 7 8 Tida l A m p lit ud e ( K ) -180 -120 -60 0 60 120 180 T id a l P h as e (d eg ree )
12-h W2 Tide (h=90 km, 40oS)
Figure 4
Fig. 4. Average (2002–2007) seasonal behavior of the tidal amplitudes (solid line with dots for 40◦N and with diamonds for 40◦S) and
phases (crests for 40◦N and empty crests for 40◦S) at altitudes: 110 km (upper row of plots) and 90 km (bottom row of plots); the results for
the NH are shown in the left column of plots and for the SH – right column of plots.
Figure 6 presents the monthly mean amplitudes of the semidiurnal tide at heights: 110 km (upper row of plots) and 90 km (bottom row of plots) for 20◦N (left column of plots) and 20◦S (right column). The temporal variability of the tidal amplitudes at both heights is dominated by a superpo-sition of annual and semiannual variabilities. Whereas the annual behavior is predominant at the upper level the semi-annual one is at the lower height. The NH tide reveals re-markable seasonal behavior at 110 km height with repeatable each year maxima in May–June and August–September. It is worth noting that at height of 115 km where the migrat-ing semidiurnal tide in the SH reaches maximum it also re-veals remarkable seasonal behavior with repeatable each year maxima in May and August. The monthly mean amplitudes of the semidiurnal tide at height of 115 km in the SH are shown on the right upper plot of Fig. 6 with dash line. How-ever, while the main maximum in the NH is that in August– September, in the SH is that in May.
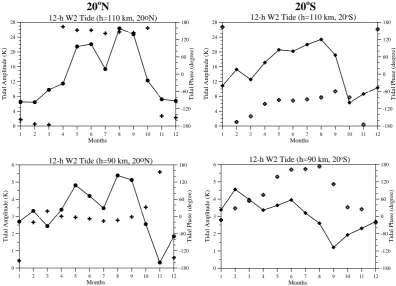
Figure 7 displays the average (2002–2007) seasonal be-havior of the tidal amplitudes (solid line with dots for 20◦N and with diamonds for 20◦S) and phases (crests for 20◦N and empty crests for 20◦S) at altitudes: 110 km (upper row of plots) and 90 km (bottom row of plots). As before the results for the NH are shown in the left column of plots and for the SH – right column of plots. The seasonal courses of the tidal amplitude at both levels indicate high degree of similarity but the tidal amplitudes have very different magnitudes. On the average the tidal amplitudes at 110 km height are nearly a factor of 5 larger than those at 90 km. The tidal phases at both heights in the NH have similar seasonal courses as the phases between May and September are smaller than those between November and March; at 110 km height they are respectively
[image:7.595.50.551.63.424.2]694 D. Pancheva et al.: Migrating semidiurnal tide in the SABER/TIMED temperatures
12 24 36 48 60 72 70
80 90 100 110 120
He
ight (km)
0 5 11 16 21 27 32
12 24 36 48 60 72
Months (2002-2007)
70 80 90 100 110 120
He
ight (km)
-180 -120 -60 0 60 120 180
12-h W2 Tide (20N)
12 24 36 48 60 72 70
80 90 100 110 120
Height
(km)
0 5 11 16 21 27 32
12 24 36 48 60 72
Months (2002-2007)
70 80 90 100 110 120
Height
(km)
-180 -120 -60 0 60 120 180
12-h W2 Tide (20S)
Figure 5
Fig. 5. Altitude-time cross sections of the tidal amplitudes (upper row of plots) and phases (bottom row of plots) observed at 20◦N (left
column of plots) and 20◦S (right column of plots).
than those of November–March; at 110 km height they are re-spectively: ∼−90◦(09:00 LT) and∼−180◦(06:00 LT) and at 90 km, respectively∼150◦(05:00 LT) and 30◦(01:00 LT). Figure 8 shows the altitude-time cross sections of the am-plitude in Kelvin (upper plot) and phase in degrees (bot-tom plot) of the semidiurnal temperature tide over the equa-tor. This is the region where the migrating semidiurnal tide reaches the smallest amplitudes in the lower thermosphere comparing with those at 20◦(30 K) and 40◦(26 K). Over the equator the tide amplifies significantly above 105 km height and its amplitude reaches 21 K. Near altitude of 80 km the semidiurnal tide is present almost the entire year but its sea-sonal variability does not indicate a regular behavior. It appears that the observed semidiurnal tide undergoes some decay between∼80 km and∼105 km, however a slight in-crease of the tide is observed between 95 and 100 km. Below 80 km height there is a weak amplification of the tide during the boreal winter months. The altitude phase structure (bot-tom plot) reveals vertically upward propagating semidiurnal tide during the entire year only above 95–100 km height. In most cases when the semidiurnal tide has statistically signif-icant amplitudes is also vertically upward propagating wave above 75–80 km height but not in the boreal winter.
The above results clearly indicated that the strongest mi-grating semidiurnal tide is observed in the tropical lower thermosphere where the largest monthly mean tidal ampli-tude during the considered period of time reaches 32 K. The phase plots of Fig. 5 revealed quite well evident seasonal de-pendence of the vertical wavelength. Therefore it is worth studying this topic more closely. Figure 9 presents the aver-age (2002–2007) tidal phases for the altitude range between 90 and 115 km marked by different colors (black for 90 km; purple for 95 km, blue for 100 km, red for 105 km, magenta for 110 km and green for 115 km) for 20◦N (left plot) and 20◦S (right plot). In order to facilitate the comparison the scales at both plots are the same. In general, the vertical
phase gradients in the NH are larger than those in the SH, i.e. the tidal vertical wavelengths in the NH are shorter than those in the SH. Additionally, the vertical phase gradients are larger in winter than in summer at both hemispheres defining in this way shorter vertical wavelengths in the winter than in the summer. The detailed analysis reveals that while in the NH the summer and winter vertical wavelengths are re-spectively∼38–40 km and 25–28 km, those for the SH are
∼43–47 km and∼30–33 km. The vertical wavelengths in the equinoxes are usually between those in the summer and win-ter. We note however that the vertical wavelengths in Febru-ary at 20◦N and in October at 20◦S are longer than those observed in summer reaching∼50–53 km.
3.2 Altitude-latitude tidal structure
[image:8.595.47.549.64.228.2]D. Pancheva et al.: Migrating semidiurnal tide in the SABER/TIMED temperatures 695
20
oN 20
oS
0 12 24 36 48 60 72
Months (2002-2007)
0 4 8 12 16 20 24 28 32
Ti
d
al
Am
p
li
tu
d
e (
K
)
Amplitude of 12-h W2 Tide (h=110 km, 20oN)
0 12 24 36 48 60 72
Months (2002-2007)
0 4 8 12 16 20 24 28 32
Ti
d
al
A
m
pl
it
u
d
e (
K
)
h=110 km h=115 km
Amplitude of 12-h W2 Tide (20oS)
0 12 24 36 48 60 72
Months (2002-2007)
1 2 3 4 5 6 7 8
Ti
d
al
Am
p
li
tu
d
e (
K
)
Amplitude of 12-h W2 Tide (h=90 km, 20oN)
0 12 24 36 48 60 72
Months (2002-2007)
1 2 3 4 5 6 7 8
Ti
d
al
Am
p
li
tu
d
e (
K
)
[image:9.595.52.547.72.432.2]Amplitude of 12-h W2 Tide (h=90 km, 20oS)
Figure 6
Fig. 6. Temporal distribution of the monthly mean tidal amplitudes at heights: 110 km (upper row of plots) and 90 km (bottom row) for
20◦N (left column of plots) and 20◦S (right column of plots) shown by solid lines; the monthly mean tidal amplitudes at 115 km height at
20◦S are displayed by dash line in the upper right plot.
of 115 km, (ii) equatorial (0–10◦N) maximum of∼16 K lo-cated at 115 km height, and (iii) winter maximum (∼14 K) located at latitude of 40◦N and centered between 100 and 110 km altitudes. Similarly to the June solstice the phase dis-tribution in December (bottom right plot) shows a downward tilting of phase lines as one progresses from the summer to winter hemisphere. Above 75 km height in the winter hemi-sphere a vertical wavelength of∼35 km can be seen at 40◦N from the phase plot.
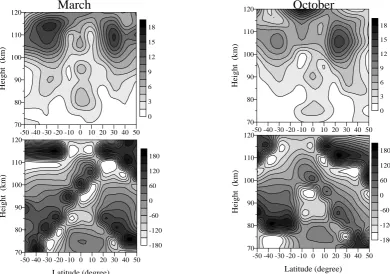
The left column of plots in Fig. 10b shows the average for the considered 6 years altitude-latitude cross-sections of the tidal amplitudes (upper plot) and phases (bottom plot) for March, while the right column of plots – the same but for October. In general, a symmetric nature of the lower thermo-spheric tidal amplitudes is visible in both months. The March amplitude maxima (∼16–17 K) are located at latitudes near
±30◦ and altitudes of∼115 km in the SH and∼110 km in the NH. The phase distribution in March (bottom left plot)
reveals a downward tilting of phase lines as one progresses from the NH to the SH. Above 75 km height in the NH a ver-tical wavelength of order 35 km can be seen in the middle latitudes. The October amplitude maxima in the lower ther-mosphere are located at: (i)±(20–30)◦and at 105 km height and (ii) over the equator with an amplitude rapidly growing with the height above 110 km altitude. The tropical October amplitudes are weaker than those in March; they are∼15 K and∼10–11 K in the NH and SH hemispheres respectively. At mesosphere levels (70–95 km) two weak equatorial max-ima can be seen in both equinoctial months. The phase dis-tribution in October (bottom right plot) reveals a downward tilting of phase lines as one progresses from the SH to the NH. Above 80 km height in the SH a vertical wavelength of order 35 km can be seen in the middle latitudes.
696
D. Pancheva et al.: Migrating semidiurnal tide in the SABER/TIMED temperatures
20
oN 20
oS
1 2 3 4 5 6 7 8 9 10 11 12
Months 0 4 8 12 16 20 24 28 Ti d a l A m p lit ud e ( K ) -180 -120 -60 0 60 120 180 Ti d a l P h a se ( d e g ree )
12-h W2 Tide (h=110 km, 20oN)
1 2 3 4 5 6 7 8 9 10 11 12
Months 0 4 8 12 16 20 24 28 Ti d a l A m p lit ud e ( K ) -180 -120 -60 0 60 120 180 Ti d a l P h a se ( d e g ree )
12-h W2 Tide (h=110 km, 20oS)
1 2 3 4 5 6 7 8 9 10 11 12
Months 0 1 2 3 4 5 6 Ti d al A m pl it u d e ( K ) -180 -120 -60 0 60 120 180 Ti d al P h a se ( d eg ree )
12-h W2 Tide (h=90 km, 20oN)
1 2 3 4 5 6 7 8 9 10 11 12
Months 0 1 2 3 4 5 6 Tida l A m p lit ud e ( K ) -180 -120 -60 0 60 120 180 T id a l P h as e (d eg ree )
[image:10.595.98.495.63.349.2]12-h W2 Tide (h=90 km, 20oS)
Figure 7
Fig. 7. Average (2002–2007) seasonal behavior of the tidal amplitudes (solid line with dots for 20◦N and with diamonds for 20◦S) and
phases (crests for 20◦N and empty crests for 20◦S) at altitudes: 110 km (upper row of plots) and 90 km (bottom row); the results for the NH
are shown in the left column of plots and for the SH – right column of plots.
altitudes. The vertical wavelength of the SABER temper-ature tide revealed seasonal dependence (larger in summer than in winter) but on the average it ranges between 25– 30 km and 45–47 km and does not exceed 55 km particu-larly in February and October. This means that the contri-bution of the first symmetric (2,2) and antisymmetric (2,3) modes, whose vertical wavelengths are larger than 75–80 km (Forbes, 1995), is small or limited only to a given altitude range. The symmetric (2,4) and antisymmetric (2,5) modes seem to have a main effect during June solstice (left plot of Fig. 10a), while in December (right plot of Fig. 10a) the contribution of the symmetric (2,6) mode is evident as well. During equinoxes the migrating semidiurnal tide most prob-ably is composed mainly by symmetric (2,4) and (2,6) modes (Fig. 10b).
3.3 Interannual variability of the tidal amplitude
It has been found that the amplitude of the 40◦N semidiur-nal tide in the summer lower thermosphere (110 km height) is modulated by the 2-year variation (see upper left plot in Fig. 3). The 2-year effect has been particularly visible on the June maximum amplifying it during 2003, 2005 and 2007. This feature could be due to modulation by the quasi-biennial oscillation (QBO) of the stratosphere zonal mean flow as
the tide propagates from the tropospheric and stratospheric sources to the lower thermosphere. Hagan et al. (1992) re-ported that the QBO of stratospheric ozone does not affect the semidiurnal tidal forcing. In this modeling study how-ever the QBO signature in the upward propagating 12-h tide during January has been largely evident in the neutral wind at high mesospheric latitudes.
Recently Huang et al. (2006, 2008) have examined the QBO in the stratosphere-mesosphere SABER/TIMED zonal mean temperature and ozone and its effect on the meso-spheric temperature diurnal tide. The authors calculated the QBO variability of the zonal mean temperature by assum-ing that the period of QBO is 24 or 26 months. Then, by a least squares fitting procedure performed on the data from January 2002 to December 2003, in the case for 24-month QBO period, or from January 2002 to February 2004, in the case for 26-month QBO period, the authors defined the mean amplitude and phase of the QBO and reconstructed the QBO temperature variability.
D. Pancheva et al.: Migrating semidiurnal tide in the SABER/TIMED temperatures 697
12-h W2 Tide (equator)
12 24 36 48 60 72
70 80 90 100 110 120
Hei
ght (km)
0 4 7 11 14 18 21
12 24 36 48 60 72
Months (2002-2007)
7080 90 100 110 120
Height (km)
-180 -120 -60 0 60 120 180
[image:11.595.98.495.63.327.2]Figure 8
Fig. 8. Altitude-time cross sections of the tidal amplitude (upper plot) and phase (bottom plot) of the semidiurnal tide over the equator.
20
oN
20
oS
1 2 3 4 5 6 7 8 9 10 11 12
Months -300
-240 -180 -120 -60 0 60 120 180 240
Ti
d
al
P
h
a
se (
d
eg
ree
)
h=90 km h=95 km h=100 km h=105 km h=110 km h=115 km
Phase of 12-h W2 Tide (20N)
1 2 3 4 5 6 7 8 9 10 11 12
Months -300
-240 -180 -120 -60 0 60 120 180 240
Ti
d
al
P
h
a
se (
d
eg
ree
)
h=90 km h=95 km h=100 km h=105 km h=110 km h=115 km
Phase of 12-h W2 Tide (20S)
Figure 9
Fig. 9. Average (2002–2007) monthly tidal phases for the altitude range between 90 and 115 km marked by different colors (black for 90 km;
purple for 95 km, blue for 100 km, red for 105 km, magenta for 110 km and green for 115 km) for 20◦N (left plot) and 20◦S (right plot).
of QBO is 28 months. We spectrally analyzed also the data only for the considered in this study interval, i.e. January 2002–December 2007, and obtained the same result. Then by performing the fitting technique on the monthly mean time series of the zonal mean temperature for the entire time in-terval (2002–2007) we derive the average (for the studied 6 years) amplitude and phase of the QBO which are used for generating the QBO variability of the zonal mean temper-ature. The analogous procedure is done with the monthly
[image:11.595.50.548.373.553.2]698 D. Pancheva et al.: Migrating semidiurnal tide in the SABER/TIMED temperatures
June
-50 -40 -30 -20 -10 0 10 20 30 40 50 70
80 90 100 110 120
Height (km)
0 5 9 14 18 23 27
-50 -40 -30 -20 -10 0 10 20 30 40 50
Latitude (degree) 70
80 90 100 110 120
Height (km)
-180 -150 -120 -90 -60 -30 0 30 60 90 120 150 180
December
-50 -40 -30 -20 -10 0 10 20 30 40 50 70
80 90 100 110 120
Height (km)
0 5 9 14 18 23 27
-50 -40 -30 -20 -10 0 10 20 30 40 50
Latitude (degree) 70
80 90 100 110 120
Height (km)
-180 -120 -60 0 60 120 180
[image:12.595.102.494.62.343.2]Figure 10a
Fig. 10a. Average (2002–2007) altitude-latitude cross-sections of the tidal amplitudes (upper row of plots) and phases (bottom row of plots)
for June (left column of plots) and December (right column of plots).
March
-50 -40 -30 -20 -10 0 10 20 30 40 50 70
80 90 100 110 120
Height (km)
0 3 6 9 12 15 18
-50 -40 -30 -20 -10 0 10 20 30 40 50
Latitude (degree) 70
80 90 100 110 120
Height (km)
-180 -120 -60 0 60 120 180
October
-50 -40 -30 -20 -10 0 10 20 30 40 50 70
80 90 100 110 120
Height
(km)
0 3 6 9 12 15 18
October
-50 -40 -30 -20 -10 0 10 20 30 40 50
Latitude (degree) 70
80 90 100 110 120
Height (k
m)
-180 -120 -60 0 60 120 180
Figure 10b
[image:12.595.101.492.393.667.2]D. Pancheva et al.: Migrating semidiurnal tide in the SABER/TIMED temperatures 699 mesospheric (∼70 km) and stratospheric (∼20 and∼40 km)
maxima are weaker than that in the lower thermosphere. In general, lower thermospheric QBO maximum is almost out of phase with those in the lower mesosphere (∼70 km) and the lower stratosphere (∼20 km).
The upper plot of Fig. 11 displays the QBO modulation of the semidiurnal tidal amplitude at 40◦N. The mean QBO variability of the tidal amplitude reaches peak of∼2 K. The strongest effect is observed in the lower thermosphere, cen-tered at 110 km height, where the semidiurnal tide itself max-imizes. The positive tidal modulations coincide with the pos-itive phase of the lower thermospheric temperature QBO. We note also that the QBO modulation of the semidiurnal tidal amplitude at 50◦N is even stronger than that at 40◦N having average amplitude of∼2.5 K (not shown result). This anal-ysis indicates that the interannual variability of the semidi-urnal tide observed in the NH lower thermosphere at mid-latitudes is at least partly generated by the QBO. It is worth noting that in contrast to the modeling study of Hagan et al. (1992) where the QBO signature has been evident in the January 12-h tide the SABER result revealed QBO oscilla-tion well seen in the June semidiurnal tide.
The same analysis has been done on the semidiurnal tidal amplitudes at 40◦S. The mean QBO variability of the tidal amplitude reaches peak only of∼1–1.2 K (not shown result), i.e. two times smaller than that at 40◦N. The strongest ef-fect is again found in the lower thermosphere, centered at
∼110 km height, however a secondary amplification, near 95 km height, is also seen during the austral summers of 2002/2003, 2004/2005 and 2006/2007.
4 Discussion and summary
In this paper we have presented the global spatial (altitude and latitude) structure and temporal variability, particularly seasonal behavior, of the migrating semidiurnal tide seen in full 6 years (January 2002–December 2007) observations of the kinetic temperature measured by the SABER instrument on the TIMED satellite. This topic is worthy of special atten-tion because tides in the upper MLT are the most profound and persistent feature of the large scale dynamics there. The tidal results have been obtained by a new analysis method where the tides (migrating and nonmigrating) and the plan-etary waves (zonally travelling, zonally symmetric and sta-tionary) are simultaneously extracted from the satellite data. The detailed description of this method has been presented in the complimentary study of the migrating diurnal tide re-ported by Mukhtarov et al. (2009) and here it was only briefly summarized. The method for defining the reference noise level for the tidal waves has been briefly mentioned as well.
The obtained consistent picture for the spatial tidal struc-ture and the repeating seasonal variability during all con-sidered six years is a clear recommendation for the validity of this new method not only to derive successfully
plane-0 12 24 36 48 60
20 30 40 50 60 70 80 90 100 110 120
Height (km)
-2.0 -1.6 -1.2 -0.8 -0.4 0.0 0.4 0.8 1.2 1.6 2.0
QBO Variability of 12-h Tidal Amplitude (40N)
0 12 24 36 48 60
Months (2002-2007)
20 30 40 50 60 70 80 90 100 110 120
Height (km)
-3.5 -2.5 -1.5 -0.5 0.5 1.5 2.5 3.5
QBO Variability of Zonal Mean Temperature (40N)
Figure 11
Fig. 11. Semidiurnal tidal amplitude (upper plot) and zonal mean
temperature (bottom plot) variations for QBO period of 28 months plotted versus height and months for period of time between Jan-uary 2002 and December 2007.
[image:13.595.310.543.63.283.2]700 D. Pancheva et al.: Migrating semidiurnal tide in the SABER/TIMED temperatures hemispheres. The result of this study however revealed two
times stronger QBO variability of the tidal amplitude in the midlatitude NH (with an amplitude of∼2–2.5 K) than that in the SH (with an amplitude of∼1–1.2 K).
Recently on the basis of Na lidar observations over full di-urnal cycles from May 2002 to April 2006 Yuan et al. (2008) investigated the seasonal variations of the semidiurnal tidal characteristics over Fort Collins, Colorado (41◦N, 105◦W) in the altitude range between 80 and 100 km. The compar-ison with the results from this study for middle latitudes, 40◦N, reveals the follows: (i) the largest tidal amplitudes de-rived from the lidar and SABER temperatures have average magnitudes of 12 and∼13 K (see upper right plot of Fig. 10a) respectively observed in winter (December); (ii) in summer, particularly in July, the lidar semidiurnal tide is the weakest, while the SABER tide in summer shows a secondary am-plification reaching amplitudes of ∼10–11 K at h=100 km in June–July (see the upper left plot of Fig. 2); the weak-est SABER semidiurnal tide is found in April, with a mean amplitude of∼6 K and in October with a mean amplitude of∼4.5 K at 100 km height, and (iii) the vertical wavelength found by the lidar is∼50 km in most of the months with the exception of the summer months when it is longer; in June however the tidal phase was almost independent of height in-dicating that the semidiurnal tide is evanescent or with very large vertical wavelength. The SABER tidal wavelengths at 40◦N however are different from the lidar ones; they indicate slight seasonal variability and on the average their magni-tudes are clustered near∼35 km. This significant difference between the lidar semidiurnal tide observed over Fort Collins and the SABER tide at 40◦N defines a different contribution of the Hough modes; while for the lidar semidiurnal tide the Hough modes with very long vertical wavelengths (2,2) and (2,3) are dominant in summer the SABER tide is composed by modes with significantly shorter wavelength as (2,4) and (2,5) modes.
The main results from the detailed documentation of the global spatial structure (altitude between 70 and 120 km and latitude between 50◦N and 50◦S) and temporal vari-ability of the migrating semidiurnal tide derived from the SABER/TIMED temperatures can be summarized as fol-lows:
– The seasonal behavior of the vertically upward propa-gating semidiurnal tide in the middle latitudes (±40◦) is dominated by strong annual oscillation with a win-ter maximum in the upper mesosphere (90 km) of both hemispheres. The winter maximum in the SH (in May) is larger than that in the NH (January–February) reach-ing average amplitudes respectively 8 K and 7 K. For al-titudes between 70 and 90 km besides the winter maxi-mum an autumn (September in the NH and March in the SH) tidal amplification is evident as well. The Septem-ber maximum detected at northern middle latitudes is well documented by radar studies (Manson et al., 1999,
2002; Riggin et al., 2003). Above 90 km the tide grows very rapidly with increasing the height and changes it seasonal behavior. At 110 km height the semidiurnal tide is stronger in summer than in the winter. In the lower thermosphere the NH summer maximum (June and August peaks) is much stronger than that in the SH (November and March peaks) having values respec-tively ∼23 K and ∼13–15 K. The seasonal variability of the tidal phase in the middle latitudes indicated that while in the NH the semidiurnal phase appears earlier in winter than in summer the opposite tendency is ob-served in the SH. The vertical phase gradient at both hemispheres indicated slight seasonal changes, there-fore a mean vertical wavelength of∼35 km is observed during most of the year.
– The strongest migrating semidiurnal tide has been de-rived at tropical latitudes (±20–30◦). It indicated sig-nificant amplification between May and August in the lower thermosphere of both hemispheres. On the aver-age, the semidiurnal temperature tide is stronger in the SH (32 K) than that in the NH (30 K) and the tidal am-plitudes at 110 km height are nearly a factor of 5 larger than those at 90 km. The migrating semidiurnal tide in both hemispheres revealed remarkable seasonal behav-ior at the altitude where it maximizes. In the NH at 110 km height the tidal amplitude indicated repeatable each year maxima exactly in May–June and August– September (upper left plot of Fig. 6). The same remark-able seasonal behavior has been found for the semidiur-nal tide in the SH at 115 km height where the maxima are observed in May and August (upper right plot of Fig. 6). However, while the main maximum in the NH is that in August–September, in the SH is that in May. The seasonal variability of the tidal phase in the tropical lat-itudes indicated similar variability at both hemispheres: the phase appears earlier in summer than in winter. The vertical phase gradients are larger in winter than in sum-mer and this determines the larger vertical wavelengths in summer (∼38–50 km) than in winter (∼25–35 km). – The weakest semidiurnal tide in the lower thermosphere
is observed over the equator. However, in the lower mesosphere (∼70–80 km) it usually has the largest am-plitudes (see the bottom plot of Fig. 1) but its sea-sonal variability did not indicate a regular behavior. The equatorial semidiurnal tide amplifies significantly above 105 km height and its temporal variability is dominated by a main maximum in boreal summer months and a secondary one in winter months. The altitude phase structure (bottom plot of Fig. 8) revealed vertically up-ward propagating semidiurnal tide during the entire year only above∼95–100 km height.
D. Pancheva et al.: Migrating semidiurnal tide in the SABER/TIMED temperatures 701 altitudes and seasons different tidal modes shape its
lat-itude structure. The symmetric (2,4) and antisymmetric (2,5) modes seem to have a main effect in June (left plot of Fig. 10a), while in December (right plot of Fig. 10a) the contribution of the symmetric (2,6) mode is evident as well. During equinoxes the migrating semidiurnal tide seems to consist mainly of symmetric (2,4) and (2,6) modes (Fig. 10b).
– The migrating semidiurnal tide at middle latitudes of the NH revealed some interannual variability observed in the lower thermosphere. At least part of it is connected with the effect of QBO and the mean (for the studied 6 years) amplitude of the QBO tidal modulation is∼2– 2.5 K. Similar effect has been found in the SH as well but the amplitude of QBO tidal modulation is two times smaller than that in the NH.
The presented detailed study of the climatological global tidal structure and temporal variability of the migrating semidiurnal temperature tide in the latitude range of±50◦ and altitudes between 70 km and 120 km could provide im-portant constraints for numerical models.
Acknowledgements. We are grateful to the SABER team for the
access to the data on http://saber.gats-inc.com and to the NOAA Climate Prediction Center for the access to the QBO index on http://www.cpc.ncep.noaa.gov/. One of the authors, DP, is thankful to F. Huang, A. Smith and R. Lieberman for the useful discussions. We thank the anonymous reviewers for their insightful comments on the original manuscript.
Topical Editor C. Jacobi thanks two anonymous referees for their help in evaluating this paper.
References
Angelats i Coll, M. and Forbes, J. M.: Nonlinear interactions in the upper atmosphere: The s=1 and s=3 nonmigrating semidiurnal tides, J. Geophys. Res., 107, A8, doi:10.1029/2001JA900179, 2002.
Avery, S. K., Vincent, R. A., Phillips, A., Manson, A. H., and Fraser, G. J.: High-latitude tidal behavior in the mesosphere and lower thermosphere, J. Atmos. Terr. Phys., 51, 595–608, 1989. Bernard R.: Variability of the semi-diurnal tide in the upper
meso-sphere, J. Atmos. Terr. Phys., 43, 663–674, 1981.
Burrage, M. D., Wu, D. L., Skinner, W. R., Ortland, D. A., and Hays, P. B.: Latitude and seasonal dependence of the semidiurnal tide observed by the high-resolution Doppler imager, J. Geophys. Res., 100(D6), 11313–11321, 1995.
Chapman, S. and Lindzen, R. S.: Atmospheric Tides: Thermal and Gravitational, 200 pp., Gordon and Breach, New York, 1970. Clark, R. R. and Salah, J. E.: Propagation of the solar semidiurnal
tide in the mesosphere and lower thermosphere at midlatitudes, J. Geophys. Res., 96, 1129–1133, 1991.
Forbes, J. M. and Garret, H. B.: Theoretical studies of atmospheric tides, Rev. Geophys., 17, 1951–1981, 1979.
Forbes, J. M.: Atmospheric tides, 2, The solar and lunar semidiurnal components, J. Geophys. Res., 87, 5241–5252, 1982.
Forbes, J. M. and Vial, F.: Monthly simulations of the solar semid-iurnal tide in the mesosphere and lower thermosphere, J. Atmos. Terr. Phys., 51, 649–661, 1989.
Forbes, J. M.: Tidal and planetary waves, in: The Upper Meso-sphere and Lower ThermoMeso-sphere: A Review of Experiment and Theory, Geophys. Monogr. Ser., vol. 8, pp. 67–87, AGU, Wash-ington, D.C., 1995.
Forbes, J. M., Hagan, M. E., Zhang, X., and Hamilton, K.: Up-per atmosphere tidal oscillations due to latent heat release in the tropical troposphere, Ann. Geophys., 15, 1165–1175, 1997, http://www.ann-geophys.net/15/1165/1997/.
Forbes, J. M. and Wu, D.: Solar tides as revealed by measurements of mesosphere temperature by the MLS experiment on UARS, J. Atmos. Sci., 63, 1776–1797, 2006.
Forbes, J. M., Russell, J., Miyahara, S., Zhang, X., Palo, S., Mlynczak, M., Mertens, C. J., and Hagan, M. E.: Troposphere-thermosphere tidal coupling as measure by the SABER instru-ment on TIMED during July-September 2002, J. Geophys. Res., 111, A10S06, doi:10.1029/2005JA011492, 2006.
Forbes, J. M., Zhang, X., Palo, S., Russell, J., Mertens,
C. J., and Mlynczak, M.: Tidal variability in the
iono-spheric dynamo region, J. Geophys. Res., 113, A02310, doi:10.1029/2007JA012737, 2008.
Garcia, R. R., Marsh, D. R., Kinnison, D. E., Boville, B. A., and Sassi, F.: Simulations of secular trends in the mid-dle atmosphere, 1950–2003, J. Geophys. Res., 112, D09301, doi:10.1029/2006JD007485, 2007.
Garcia-Comas, M., Lopez-Puertas, M., Marshall, B. T., et al.: Er-rors in Sounding of the Atmosphere using Broadband Emis-sion Radiometry (SABER) kinetic temperature caused by non-local-thermodynamic-equilibrium model parameters, J. Geo-phys. Res., 113, D24106, doi:10.1029/2008JD010105, 2008. Groves, G. V.: Hough components of water vapor heating, J. Atmos.
Terr. Phys., 44, 281–290, 1982a.
Groves, G. V.: Hough components of ozone heating, J. Atmos. Terr. Phys., 44, 111–121, 1982b.
Hagan, M., Vial, F., and Forbes, J.: Variability in the upper propa-gating semidiurnal tide due to effects of QBO in the lower atmo-sphere, J. Atmos. Terr. Phys., 54, 1465–1474, 1992.
Hagan, M., Forbes, J., and Vial, F.: On modeling migrating solar tides, Geophys. Res. Lett., 22, 893–896, 1995.
Hagan, M. E.: Comparative effects of migrating solar sources on tidal signatures in the middle and upper atmosphere, J. Geophys. Res., 101(D16), 21213–21222, 1996.
Hagan, M. E., Burrage, M. D., Forbes, J. M., Hackney, J., Randel, W. J., and Zhang, X.: GSWM-98: Results for mi-grating solar tides, J. Geophys. Res., 104(A4), 6813–6827, doi:10.1029/1998JA900125, 1999.
Hagan, M. E., Roble, R. G., and Hackney, J.: Modeling thermo-spheric tides, J. Geophys. Res., 106, 12739–12752, 2001. Hagan, M. E. and Forbes, J. M.: Migrating and nonmigrating
semidiurnal tides in the upper atmosphere excited by tropo-spheric latent heat brelease, J. Geophys. Res., 108(A2), 1062, doi:10.1029/2002JA009466, 2003.
Hamilton, K.: Latent heat release as a possible forcing mechanism for atmospheric tides, Mon. Weather Rev., 109, 3–17, 1981. Huang, F. T., Mayr, H. G., Reber, C. A., Russell, J. M., Mlynczak,
702 D. Pancheva et al.: Migrating semidiurnal tide in the SABER/TIMED temperatures
and SAO) oscillations based on measurements from SABER (TIMED) and MLS (UARS), Ann. Geophys., 24, 2131–2149, 2006, http://www.ann-geophys.net/24/2131/2006/.
Huang, F. T., Mayr, H. G., Reber, C. A., Russell, J. M., Mlynczak, M., and Mengel, J. G.: Ozone quasi-biennial os-cillation (QBO), semiannual osos-cillations (SAO), and correla-tions with temperature in the mesosphere, lower thermosphere, and stratosphere, based on measurements from SABER on TIMED and MLS on UARS, J. Geophys. Res., 113, A01316, doi:10.1029/2007JA012634, 2008.
Jacobi, Ch., Portnyagin, Yu., Solovjova, T., Hoffmann, P., Singer, W., Fahrutdinova, A., Ishmuratov, R., Beard, G., Mitchell, N., Muller, G., Schminder, R., K¨urschner D., Manson, A., and Meek,
C.: Climatology of the semidiurnal tide at 52◦N–56◦N from
ground-based radar wind measurements 1985–1995, J. Atmos. Sol.-Terr. Phys., 61, 975–991, 1999.
Kong, A. K. H., Charles, P. A., and Kuulkers, E.: Long-term X-ray variability in GX 354-0, New Astronomy, 3(5), 301–307, 1998. Manson, A. H., Meek, C. E., Schminder, R., K¨urschner, D., Clark,
R. R., M¨uller, H. G., Vincent, R. A., Phillips, A., Fraser, G. J., Singer, W., and Kazimirovsky, E. S.: Tidal winds from the MLT global radar network during the first LTCS campaign September 1987, J. Atmos. Terr. Phys. 52, 175–183, 1990.
Manson, A. H., Meek, C. E., Hagan, M., Hall, C., Hocking, W., MacDougall, J., Franke, S., Riggin, D., Fritts, D., Vincent, R., and Burrage, M.: Seasonal variations of the semi-diurnal tides in
the MLT: multi-year MF radar observations from 2 to 70◦N, and
the GSWM tidal model, J. Atmos. Sol.-Terr. Phys. 61, 809–828, 1999.
Manson, A. H., Meek, C., Hagan, M., Koshyk, J., Franke, S., Fritts, D., Hall, C., Hocking, W., Igarashi, K., MacDougall, J., Riggin, D., and Vincent, R.: Seasonal variations of the semi-diurnal and diurnal tides in the MLT: multi-year MF radar observations from
2–70◦N, modelled tides (GSWM, CMAM), Ann. Geophys., 20,
661–677, 2002, http://www.ann-geophys.net/20/661/2002/. Manson, A. H., Meek, C. E., Hall, C.M., Nozawa, S., Mitchell, N.J.,
Pancheva, D., Singer, W., and Hoffmann, P.: Mesopause dynam-ics from the scandinavian triangle ofradars within the PSMOS-DATAR Project, Ann. Geophys., 22, 367–386, 2004,
http://www.ann-geophys.net/22/367/2004/.
McLandress, C., Rochon, C. Y., Shepherd, G. G., Solheim, B. H., Thuillier, G., and Vial, F.: The meridional wind component of the thermospheric tides observed by WINDII on UARS, Geophys. Res. Lett., 21, 2417–2420, 1994.
McLandress, C., Shepherd, G. G., and Solheim, B. H.: Satellite ob-servations of thermospheric tides: Results from the Wind Imag-ing Interferometer on UARS, J. Geophys. Res., 101(D2), 4093– 4114, doi:10.1029/95JD03359, 1996.
Mertens, C. J., Mlynczak, M., Lopez-Puertas, M., et al.: Retrieval of mesospheric and lower thermospheric kinetic temperature from
measurements of CO2 15µm earth limb emission under
non-LTE conditions, Geophys. Res. Lett., 28, 1391–1394, 2001. Mertens, C. J., Schmidlin, F. J., Goldberg, R. A., et al.:
SABER observations of mesospheric temperature and compar-isons with falling sphere measurements taken during the 2002 summer MaCWINE campaign, Geophys. Res. Lett., 31, J03105, doi:10.1029/2003GL018605, 2004.
Mitchell, N. J., Pancheva, D., Middleton, H., and Hagan, M.: Mean winds and tides in the Arctic mesosphere/lower thermosphere
re-gion and comparison with the GSWM, J. Geophys. Res., 106, A1, doi:10.1029/2001JA900127, 2002.
Mukhtarov, P., Pancheva, D., and Andonov, B.: Global structure and seasonal and interannual variability of the migrating diurnal tide seen in the SABER/TIMED temperatures between 20 and 120 km, J. Geophys. Res., 114, in press, 2009.
Pancheva, D., Mukhtarov, P., Mitchell, N. J., Beard, A. G., and Muller, H. G.: A comparative study of winds and tidal variability in the mesosphere/lower-thermosphere region over Bulgaria and the UK, Ann. Geophys., 18, 1304–1315, 2000,
http://www.ann-geophys.net/18/1304/2000/.
Pancheva, D., Mitchell, N. J., Hagan, M. E., et al.: Global-scale tidal structure in the mesosphere & lower thermosphere dur-ing the PSMOS campaign summer-99 and comparison with the Global Scale Wave Model, J. Atmos. Sol.-Terr. Phys., 64, 1011– 1035, 2002.
Pancheva, D. V. and Mitchell, N. J.: Planetary waves and variabil-ity of the semidiurnal tide in the mesosphere and lower
thermo-sphere over Esrange (68◦N, 21◦E) during winter, J. Geophys.
Res., 109, A08307, doi:10.1029/2004JA010433, 2004.
Pancheva, D., Mukhtarov, P., Mitchell, N. J., Merzlyakov, E., Smith, A.K., Andonov, B., Singer, W., Hocking, W., Meek, C., Manson, A., and Murayama, Y.: Planetary waves in cou-pling the stratosphere and mesosphere during the major strato-spheric warming in 2003/2004, J. Geophys. Res., 113, D12105, doi:10.1029/2007JD009011, 2008.
Pancheva, D., Mukhtarov, P., Andonov, B., Mitchell, N. J., and Forbes, J. M.: Planetary waves observed by TIMED/SABER in coupling the stratosphere-mesosphere-lower thermosphere dur-ing the winter of 2003/2004: Part 1, Comparison with the UKMO temperature results, J. Atmos. Sol.-Terr. Phys., 71, 61–74, 2009a. Pancheva, D., Mukhtarov, P., Andonov, B., Mitchell, N. J., and Forbes, J. M.: Planetary waves observed by TIMED/SABER in coupling the stratosphere-mesosphere-lower thermosphere dur-ing the winter of 2003/2004: Part 2, Altitude and latitude plane-tary wave structure, J. Atmos. Sol.-Terr. Phys., 71, 75–87, 2009b. Portnyagin Yu. I. and Kajdalov, O. V.: Tides in the 80–100 km
height region, J. Atmos. Terr. Phys., 48, 1159–1173, 1986. Riggin, D. M., Meyer, C. K., Fritts, D. C., Jarvis, M. J., Murayama,
Y., Singer, W., Vincent, R. A., and Murphy, D. J.: MF radar observations of seasonal variability of semidiurnal motions in the mesosphere at high northern and southern latitudes, J. Atmos. Sol.-Terr. Phys., 65, 483–493, 2003.
Russell III, J. M., Mlynczak, M. G., Gordley, L. L, Tansock, J., and Esplin, R.: An overview of the SABER experiment and pre-liminary calibration results, Proceedings of the SPIE, 44th An-nual Meeting, Denver, Colorado, 18–23 July, vol. 3756, 277– 288. 1999.
She, C. Y., Li, T., Collins, R. L., et al.: Tidal perturbations and variability in the mesopause region over Fort Collins, CO (41 N, 105 W): Continuous multi-day temperature and wind lidar observations, Geophys, Res. Lett., 31, L2411, doi:10.1029/2004GL021165, 2004.
Vial, F.: Numerical simulations of atmospheric tides for solstice conditions. J. Geophys. Res., 91, 8955–8969, 1986.
D. Pancheva et al.: Migrating semidiurnal tide in the SABER/TIMED temperatures 703
Long-term MF radar observations of solar tides in the low-latitude mesosphere: Interannual variability and comparison with the GSWM, J. Geophys. Res., 103(D8), 8667–8684, doi:10.1029/98JD00482, 1998.
Williams, C. R. and Avery, S. K.: Diurnal nonmigrating tidal oscil-lations forced by deep convective clouds, J. Geophys. Res., 101, 4079–4091, 1996.
Zhang, X., Forbes, J. M., Hagan, M. E., Russell III, J. M., Palo, S. E., Mertens, C. J., and Mlynczak, M. G.: Monthly tidal temper-atures 20–120 km from TIMED/SABER, J. Geophys. Res., 111, A10S08, doi:10.1029/2005JA011504, 2006.
Yuan, T., Schmidt, H., She, C. Y., Krueger, D. A., and Reis-ing, S.: Seasonal variations of semidiurnal tidal perturbations in mesopause region temperature and zonal and meridional winds
above Fort Collins, Colorado (41◦N, 105◦W), J. Geophys. Res.,