R E S E A R C H
Open Access
Is all bullying the same?
Lihui Zhang
1*, Lars Osberg
2and Shelley Phipps
2Abstract
Background:We ask whether verbal abuse, threats of violence and physical assault among Canadian youth have the same determinants and whether these determinants are the same for boys and girls. If these are different, the catch-all term“bullying”may mis-specify analysis of what are really different types of behavior.
Methods:We analyze five cohorts of Canadian youth aged 12-15 from the National Longitudinal Survey of Children and Youth (NLSCY). There are 11475 observations in total. Pearson’s correlation coefficients and six different
multivariate strategies are used.
Results:There are many faces to bullying, in terms of its form and relative frequencies for boys versus girls. Although some characteristics of an adolescent are strong predictors of being subject to more than one type of bullying, some other characteristics are only correlated with specific types of bullying.
Conclusions:The many faces of bullying, and their correlation with different factors, imply different policy interventions may be needed to address each issue effectively.
Keywords:Bullying, Victim, Adolescent, Longitudinal
Background
“Bullying” is an issue that has received much attention from academics [1-5], the media [6-10], government and international agencies [11-13], due to its prevalence and sometimes-serious negative consequences, such as victim mental health or even suicide. This paper examines the individual characteristics associated with being the victim of bullying among 5488 boys and 5987 girls aged 12-15 sampled in Canada’s National Longitudinal Survey of Children and Youth (NLSCY). As research [14,15] has documented, child and adolescent victims of bullying often do not report their experiences to police, parents, or teachers–hence this paper uses self-reported survey evidence on the experience of bullying.
However, being the victim of“bullying”is a much more ambiguous event than, for example, being hit by a car. The term“bullying” is often vaguely defined and subject to interpretation by respondents, which may be especially problematic when making cross-cultural comparisons [16]. The most prominent definition of bullying was pro-posed by Olweus:“a student is being bullied or victimized when he or she is exposed, repeatedly and over time, to
negative actions on the part of one or more other students” [17]. This definition has been widely used in the scientific world. For example, Theriot et al state [18], that “the three key concepts that differentiate bullying (as defined by Olweus) from other forms of school violence and conflict are: (1) an intent to harm or upset another student, (2) the harmful behavior is done “repeatedly and over time”, and (3) the relation-ship between the bully (or bullies) and the victim(s) is characterized by an imbalance in power.”In the United Nations Children’s Fund (UNICEF) report cards on child well-being, bullying is seen as occurring when: “another student, or a group of students, say or do nasty and unpleasant things to him or her. It is also bullying when a student is teased repeatedly in a way he or she does not like or when he or she is deliberately left out of things. But it is not bullying when two stu-dents of about the same strength or power argue or fight. It is also not bullying when a student is teased in a friendly and playful way”[13]. Since intent, frequency and power imbalance are all difficult to define clearly and observe reliably, these definitions illustrate some of the complexities of research on bullying.
In this article, we address another level of complexity– the issue of whether all types of bullying behavior have the same determinants. Using the Canadian NLSCY, we ask * Correspondence:lihui.zhang@uregina.ca
1
Johnson-Shoyama Graduate School of Public Policy, University of Regina, 110–2 Research Drive, Regina SK S4S 0A2, Canada
Full list of author information is available at the end of the article
whether researchers could be missing something by using the catch-all term of bullying to analyze different types of behavior. The NLSCY distinguishes verbal abuse, threat of violence, and physical assault as three different types of self-reported bullying. We ask: are they all just different manifestations of the same underlying phenomenon or are different personal characteristics associated with being the victim of each type of behavior?
Methods
The data used in this research are the master-files of Cycles 3 to 8 of the National Longitudinal Survey of Children and Youth (NLSCY). The NLSCY, which started in 1994 and ended in 2008, is a longitudinal survey of factors that influence Canadian children’s social, emotional and behavioural developmenta conducted biennially by Statistics Canada and sponsored by Human Resources and Social Development Canada. The target population was civilian, non-institutionalized residents living in Canada’s ten provinces. Excluded were residents of the Yukon, Nunavut and the Northwest Territories, people living on Indian reserves, full-time members of the Canadian Armed Forces and inmates of institutions. In each of these six cycles, Canadian youth were given a booklet comprising a battery of questions on their victim-ization experience in the past 12 months. To ensure confidentiality, the youth completed these questionnaires in private (away from parents and interviewers) and returned the booklet in a sealed envelope to the Statistics Canada interviewer. The main analytical sample in this research is five longitudinal cohorts of Canadian youth, who were 12 or 13 years old in 1998, 2000, 2002, 2004, and 2006, respectively. Each cohort might be interviewed a second time two years later when they were 14 or 15 years old, thus leading to an unbalanced two-year panel. In total, there are 11475 observations, with 5488 boys and 5987 girls, including repeated observations and siblings. Besides the youth self-completed components, the Person Most Knowledgeable (PMK) about the child (i.e. the mother in over 90% of the cases) also completed questionnaires containing a large array of information on the background of the child and/or the family, much of which will be used as explanatory variables in the multivariate analysis below.
In each cycle, each 12-15 year-old youth answers ques-tions on three different types of victimization, verbal abuse, threat of violence, and physical assault at school or on a school bus.bThe wordings of the questions were:
Verbal Abuse
In the past 12 months, how many times did someone say something personal about you that made you feel extremely uncomfortable: While at school or on a school bus?
Threat of Violence
In the past 12 months, how many times did someone threaten to hurt you but did not actually hurt you: While at school or on a school bus? Physical Assault
In the past 12 months, how many times did someone physically attack or assault you: While at school or on a school bus?
The response categories were: 1) Never; 2) Once or twice; 3) 3 to 4 times; and 4) 5 times or more. One can think of the dependent variables as either categorical or as pseudo-continuous variables indicating the number of times a youth has been bullied. Specifically, to construct a pseudo-continuous estimate of frequency, we set the value of the dependent variable to 0 if the chosen answer is “Never”, 1.5 if “Once or twice”, 3.5 if “3 to 4 times”, and 5 if“5 times or more”.
Vulnerability to bullying can be plausibly argued to be determined along a number of dimensions. Our first set of independent variables refers to the personal character-istics of youth. For example, youth with disabilities may be“easy targets.”Or, children from visible minority groups may “stand out” as different and so also be potential targets. Also, children who are very small relative to their peers may seem vulnerable, so we include the youth’s height for age percentile constructed using the World Health Organization 2007 Reference. Finally, children who are overweight may be subject to bullying; thus, Body Mass Index (BMI) percentiles according to the guidelines of the Centre for Disease Control are included. To test the possibility that the “new kid” in a school may be subject to more bullying, we also use information provided in the NLSCY about whether the child changed school other than through natural grade progression and whether he/she changed residence in the past 2 years. Finally, child’s age is included to allow for the possibility that younger children experience more bullying.
We also include a set of family background variables to reflect the potential exposure of a child to socioeconomic disadvantage, which some past research suggests may increase vulnerability [19,20]. Family socioeconomic vari-ables include family structure, parental age at child’s birth, parental immigrant status, education level of the PMK, and family equivalent household income. Family equiva-lent income is income from all sources before taxes but after transfers, divided by the square root of household size to take account of within-household economies of scale (the“Luxembourg Income Study Scale”).
protective of the younger sibling at school. We therefore include indicators both of whether or not the child has siblings in the household and of whether or not there is an older sibling.
Contextual variables describe the environment in which the child lives, or changes in that environment. Regions of residence and area population size are included since violence rates may differ in large urban areas compared to rural areas. Ideally, we would include an indicator for each province, but the discrete nature of the dependent variables and the small population size of some provinces necessitate aggregation to regions. We also control for attendance at a private school or public Catholic school, relative to public school since the kind of school the child attends is likely to be an important aspect of his/her environment.
The final sets of explanatory variables, though answered by the PMK, are more subjective in nature, but regarded as important in the literature. First, we have the PMK’s assessment of whether the child hangs out with peers who get in trouble and the PMK’s assessment of the quality of the neighbourhood environment. Specifically, the latter is a dummy variable coded 1 if the PMK strongly agrees that there are adults in neighbourhood that young people can look up to. Parental supervision is measured by the extent to which the PMK says she knows the child’s close friends. To measure more subjective features of the home en-vironment, we include a measure of PMK depression and of family functioning. The NLSCY provides a depres-sion scale varying from 0 to 36, constructed from the PMK’s answers to a series of questions asking them how often they have felt or behaved this way during the past week, including, for example, “I did not feel like eating; my appetite was poor,” “I felt that I could not shake off the blues even with help from my friends,” “I had trouble keeping my mind on what I was doing,” or “I felt that everything I did was an effort”. Using a pooled sample of all families in the NLSCY 1998-2008, we consider a PMK to be depressed if his/her depression scale falls in the top 25th percentile. The NLSCY provides a family functioning score, ranging from 0 to 36, constructed from the PMK’s answers to a series of questions such as:“in times of crisis we can turn to one another for support,” “individuals within the family are accepted for what they are,” “we don’t get along well together”or“making decisions is hard for our family.” A higher score indicates greater family dysfunction. The score is standardized using a pooled sample of all families in the NLSCY 1998-2008.
Time spent by the child on computers is included to see if increased exposure to computer is connected to more exposure to bullying, possibly cyber-bullying. Unfortu-nately, time on computer is not available in cycles 3-4, i.e., 1998-2000, so a dummy variable is included to represent observations with missing values on computer time.
Finally, given recent media and policy attention to bullying, suggesting that bullying is a growing problem in Canada, all models include cohort dummies to test for changes in victimization for different cohorts, other things equal.
If being verbally abused, threatened with violence or having experienced violence are really just different aspects of the same underlying phenomenon, one would expect all three types of experiences to be highly corre-lated and to occur with somewhat similar frequency. To examine this, we start with descriptive statistics on the mean number of times bullied in the past 12 months and estimates of Pearson’s correlation coefficients [21,22] between different types of bullying. Both the means and the correlation coefficients are weighted using longitudinal sampling weights provided in the NLSCY.
We then estimate the multivariate model, as described by Eq. (1), using six different econometric techniques: i) ordinary least squares (OLS) regressions; ii) ordered probit regressions; iii) interval regressions; iv) random-effects regressions; v) random-random-effects interval regressions; and vi) Hausman-Taylor regressions [23,24]. Although researchers may agree on the general specification of Eq. (1), they may differ in their choice of econometric technique and we want to know if our conclusions regard-ing the significance of particular variables are robust to this choice.
In Eq. (1), yit indicates a youth’s experience of being
the victim of a particular type of bullying behaviour in the past 12 months, Xitis a set of time-varying individual
characteristics (e.g., family structure, family income, etc.), Witis a set of time-invariant individual characteristics (e.g.,
race, immigration status, etc.), αi is a random individual-specific effect, andϵitis an idiosyncratic error.
yit¼X0itβþW0itγþαiþ∈it;t¼1;2;3;i
¼1;2;…;N ð1Þ
Let M′it= [X′it, W′it]. As a starting point, OLS
regres-sions may be used to estimate this model when yit is
thought of as pseudo-continuous, that is, the number of times, where the assumption is that αi+ϵit is i.i.d. If yit
is instead seen as categorical, as represented by the four possible responses to the victimization questions, ordered probit regressions are the appropriate estimation technique. Alternatively, since each response can also be thought of as an interval, interval regressions can also be estimated, where yit then includes two variables, one of which
takes the lower bound value and the other takes the upper bound value of each interval. That is, for interval regressions, each regression has two dependent vari-ables, y1it and y2it. For example, if a youth was bullied 3
to 4 times, then y1it= 3 and y2it= 4. If 5 times or more,
Another candidate for estimating Eq. (1) is the random-effects model, which assumes that M′it is not correlated
withϵitorαi, thoughαi+ϵitis not i.i.d. This may be true
as with panel data repeated observations for the same individual across time are likely to be correlated. Both the conventional random-effects regressions and the random-effects interval regressions are estimated.
The assumption that M′it is uncorrelated with the
individual-specific effect, αi, may be too strong. That is, one or more regressors in M′it may be endogenous. If
individuals differ from each other in unobserved ways and such individual effects are correlated with some regressors but largely fixed over time, for example, personality types, then a fixed-effects model may be more appropriate. By differencing appropriately, the fixed-effects model can consistently estimate the coefficients for the time-varying regressors,β, though the coefficients for the time-invariant regressors,γ, cannot be identified as they are eliminated by differencing. This is unfortu-nate because in many occasions it is the time-invariant regressors (e.g. visible minority status), which are of interest to the researcher. The Hausman-Taylor model provides an alternative to fixed-effects regressions if a subset of M′itis uncorrelated withαi. Thus, Eq. (1) can
be rewritten as Eq. (2), where X′it= [X′1it, X′2it] and
W′it= [W′1it, W′2it]. X′1itand W′1it are assumed to be
exogenous, whereas X′2it and W′2it are endogenous,
i.e., correlated with αi. If this assumption holds, then, with appropriate random-effects transformation, data from other periods may be used as instruments to help obtain a consistent estimator forγ.
yit¼X01itβ1þX02itβ2þW01itγ1þW02itγ1þαiþ∈it; t¼1;2;3;i¼1;2;…;N
ð2Þ
These multivariate regressions are unweighted, as the statistical software used, STATA, does not allow prob-ability sampling weights for some of the estimations, for example, Hausman-Taylor regressions, random-effects regressions, and random-effects interval regressions.
Results and discussion
Table 1 reports the means and standard errors for the number of times a 12-15 year-old adolescent is bullied at school or on a school bus in the past 12 months. First, for both boys and girls, verbal abuse occurs more frequently than threat of violence, which in turn is more frequent than physical assault. But the relative frequency of types of bullying is not the same by gender–girls are more likely to be subject to verbal abuse, while boys are more likely to be subject to threat of violence and physical assault. These simple statistics suggest that using catch-all questions on bullying is likely to mask the different frequencies of types of bullying for different genders. The high prevalence of verbal abuse among both genders and its potential harm may be particularly relevant today given the expediency and anonymity allowed for by the readily available internet [25,26].
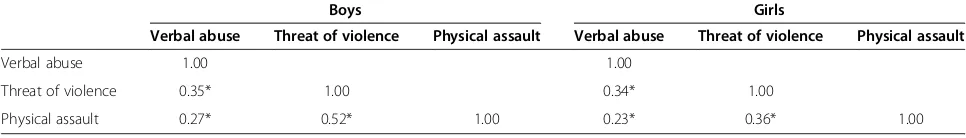
Table 2 shows the Pearson’s correlation coefficients across different types of bullying. All correlation coeffi-cients are highly statistically significant, suggesting that adolescents who are subject to one type of bullying are also at higher risk of another type of bullying. However, the correlations between verbal abuse and the other two types of bullying are smaller than the correlations between threat of violence and physical assault. Notably, the correl-ation between being the victim of physical assault and being the victim of verbal abuse is positive, but not par-ticularly high. This suggests that verbal and physical violence are unlikely to be different manifestations of Table 1 Number of times bullied at school or on a school bus in the past 12 months
Verbal abuse Threat of violence Physical assault
Boys Girls Boys Girls Boys Girls
Mean 1.12 1.23 0.74 0.34 0.28 0.10
Standard error 0.03 0.03 0.03 0.02 0.02 0.01
Number of observations 5488 5987 5488 5987 5488 5987
Data source: Cycles 3-8 of the NLSCY.
Table 2 Pearson’s correlation between types of bullying at school or on a school bus
Boys Girls
Verbal abuse Threat of violence Physical assault Verbal abuse Threat of violence Physical assault
Verbal abuse 1.00 1.00
Threat of violence 0.35* 1.00 0.34* 1.00
Physical assault 0.27* 0.52* 1.00 0.23* 0.36* 1.00
Data source: Cycles 3-8 of the NLSCY.
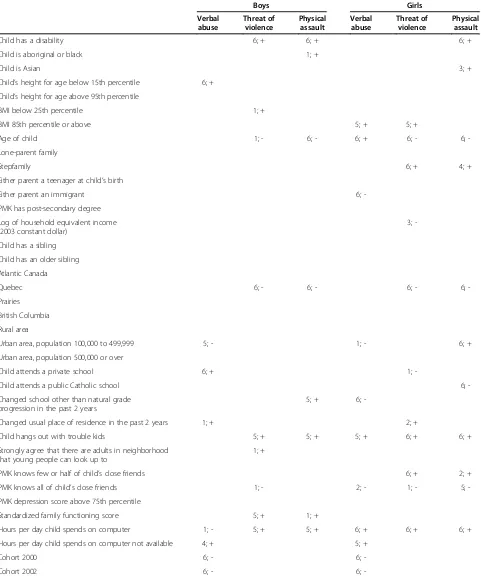
Table 3 Times a correlate significant at 5% level, bullied at school or on a school bus
Boys Girls
Verbal abuse
Threat of violence
Physical assault
Verbal abuse
Threat of violence
Physical assault
Child has a disability 6; + 6; + 6; +
Child is aboriginal or black 1; +
Child is Asian 3; +
Child’s height for age below 15th percentile 6; +
Child’s height for age above 95th percentile
BMI below 25th percentile 1; +
BMI 85th percentile or above 5; + 5; +
Age of child 1; - 6; - 6; + 6; - 6;
-Lone-parent family
Stepfamily 6; + 4; +
Either parent a teenager at child’s birth
Either parent an immigrant 6;
-PMK has post-secondary degree
Log of household equivalent income (2003 constant dollar)
3;
-Child has a sibling
Child has an older sibling
Atlantic Canada
Quebec 6; - 6; - 6; - 6;
-Prairies
British Columbia
Rural area
Urban area, population 100,000 to 499,999 5; - 1; - 6; +
Urban area, population 500,000 or over
Child attends a private school 6; + 1;
-Child attends a public Catholic school 6;
-Changed school other than natural grade progression in the past 2 years
5; + 6;
-Changed usual place of residence in the past 2 years 1; + 2; +
Child hangs out with trouble kids 5; + 5; + 5; + 6; + 6; +
Strongly agree that there are adults in neighborhood that young people can look up to
1; +
PMK knows few or half of child’s close friends 6; + 2; +
PMK knows all of child’s close friends 1; - 2; - 1; - 5;
-PMK depression score above 75th percentile
Standardized family functioning score 5; + 1; +
Hours per day child spends on computer 1; - 5; + 5; + 6; + 6; + 6; +
Hours per day child spends on computer not available 4; + 5; +
Cohort 2000 6; - 6;
-the same underlying phenomenon but more likely are different phenomena.
Table 3 summarizes the multivariate regression results on being bullied at school or on a school bus for three different types of bullying. As discussed above, six different econometric specifications were estimated, corresponding to different plausible researcher choices of statistical meth-odology. For succinctness, Table 3 counts the number of times a regressor is statistically significant at 5% level or better and the sign of the coefficient. In a few instances, one specification produces statistically significant results, but the others do not. More often, the data tell a qualita-tively consistent story across the different specifications, with specific variables being either statistically insignifi-cant in all specifications or statistically signifiinsignifi-cant in all, or almost all, specifications.
If the determinants of all different types of bullying are the same, then there is little lost by aggregating the three types of bullying identified in the NLSCY into a catch-all measure of “bullying”. In some instances, this appears to be a reasonable procedure – Table 3 indicates, for example, that sibling status, lone parent family, PMK depression and residence in Atlantic Canada, the Prairies or British Columbia have the same level of correlation (i.e. insignificance) with all three types of bullying in a school environment.
However, consistent with the significant correlation coefficients shown in Table 2, some other characteristics predict differing chances of victimization across different types, for example, disability, peer influence, residing in Quebec, and computer time for both boys and girls, and, overweight status, family structure, and parental supervision for girls. As well, some characteristics also appear to be connected to one type of bullying but not others. For example, boys whose height for age is below the 15th percentile are verbally abused at school but they do not appear more likely to be threatened or physically attacked. Boys who attend private schools are subject to verbal abuse, but not threat of violence or physical assault. Change of school is associated with more physical assault at school for boys and less verbal abuse at school for girls.
Although some characteristics of children are similarly correlated with being the victim of all three different types of bullying, this is not always the case. For example, whatever estimation technique is used Table 3 indicates that there is something about the Quebec school environ-ment that lessens the likelihood that a child will be the victim of physical assault or the threat of violence– but all six estimation techniques also concur that Quebec schools are not significantly different from those in other Canadian regions in the likelihood of a child experiencing verbal abuse. Evidently, one cannot necessarily assume that success in lessening some types of bullying will predict reductions in all other types of bullying behav-ior, which implies that different types of anti-bullying interventions may have different types of impacts.
Conclusions
This paper sets out to answer the following research question: are verbal abuse, threat of violence, and physical assault different manifestations of the same underlying phenomenon or are different personal characteristics associated with being the victim of each type of behavior? In addition to differentiating different types of bullying for both boys and girls, this research, using self-reported confidential data representative of 12-15 year-old Canadian youth, provides a useful complement to bullying victim-ization reported by police, parents, and teachers, who may only be partially aware of the bullying experiences by young people. The empirical analysis in this paper indicates that:
Bullying is not all the same. Rather, there are many faces to bullying, in terms of its form and relative frequencies for boys versus girls.
Though some characteristics and background of an adolescent are strong predictors of being subject to more than one type of bullying, some other characteristics and background are connected to specific types of bullying.
The lesson we therefore take is that information gath-ering and analysis on bullying should not be limited to catch-all aggregations of all types of bullying behavior.
Table 3 Times a correlate significant at 5% level, bullied at school or on a school bus(Continued)
Cohort 2004 6; - 6;
-Cohort 2006 6; - 6;
-Number of observations 5488 5987
Data source: Cycles 3-8 of the NLSCY.
This table summarizes the regression results from six different econometric techniques: i) OLS regressions; ii) ordered probit regressions; iii) interval regressions; iv) random-effects regressions; v) random-effects interval regressions; and vi) Hausman-Taylor regressions.
Numbers in each cell indicate the number of times a regressor is statistically significant at 5% level or lower across the six techniques, followed by the sign of the coefficients.
While there are some issues for which this may be appro-priate, it is in general desirable to be cognizant of the many faces of bullying, which not only are correlated with potentially different factors and amenable to different interventions, but also may very well have different conse-quences for the victims, thus, potentially different policy implications. Recognizing this complexity might be par-ticularly important for researchers and policy makers, as they attempt to undertand the dynamics and determinants of bullying through comparisons of bullying across space, time, demographic, socio-economic, and cultural groups. The catch-all term of bullying will provide misleading results, if what is included in bullying differs along the above-mentioned dimensions. Researchers tasked with revisiting the methodologies for large-scale international studies, such as the Health Behaviour in School-aged Chil-dren study, might wish to take this into consideration [27].
Endnotes
a
Though the NLSCY, spanning from 1994 to 2008, provides the potential for the examination of time trends, this is not the focus of this paper.
b
The working paper version of this article (available upon request from the corresponding author) included re-sults for bullying elsewhere (including at home). Professor Michal Molcho, the reviewer for this paper, commented that:“While bullying can occur in the home, incidents of verbal and physical abuse, as well as threats, coming from the carer (parent, for example), fall under child abuse rather than bullying. Child abuse has different, and more severe, consequences”. We concur with Professor Molcho’s concern, thus have removed these results from the paper.
Consent
Written informed consent was obtained from the patient’s guardian/parent/next of kin by Statistics Canada for the publication of this report and any accompanying images.
Abbreviations
BMI:Body mass index; NLSCY: National longitudinal survey of children and youth; OLS: Ordinary least squares; PMK: Person most knowledgeable; UNICEF: United nations children’s fund.
Competing interests
The authors declare that they have no competing interests.
Authors’contributions
LZ performed the statistical analysis. All authors conceived of the study, participated in the design of the study, and worked together to draft the manuscript. All authors read and approved the final manuscript.
Acknowledgements
We have benefited greatly from the comments received from participants at the following three conferences, the 46th Annual Conference of the Canadian Economics Association, the 87th Annual Conference of the Western Economic Association, and the 2012 Annual Conference of the Atlantic Economics Association, particularly Professor Derek Pyne, Professor Gregory Gilpin, and Professor Burc Kayahan who were discussants for an earlier version of this paper at these conferences. Many thanks to Angela
Daley, Carla Hale and Nikolina Vracar for excellent research assistance and the Office of Research Services of the University of Regina for funding. We appreciate Rahatjan Judge, Amanda Lu and Jesse McCrosky’s hard work on releasing output from Statistics Canada’s Saskatchewan Research Data Centre. Funding for Open Access is provided by the University of Regina Library Open Access Fund.
Author details
1Johnson-Shoyama Graduate School of Public Policy, University of Regina,
110–2 Research Drive, Regina SK S4S 0A2, Canada.2Department of Economics, Dalhousie University, 6214 University Avenue, Halifax, NS B3H 3J5, Canada.
Received: 15 November 2013 Accepted: 27 March 2014 Published: 9 June 2014
References
1. Due P, Holstein BE, Lynch J, Diderichsen F, Gabhain SN, Scheidt P, Currie C, the Health Behaviour in School-aged Children Bullying Analyses Working Group:
Bullying and symptoms among school-aged children: international comparative cross-sectional study in 28 countries.Eur J Public Health2005,
15(2):128–132.
2. Kaltiala-heino R, Rimpelã M, Rantanen P, Rimpelã A:Bullying at school - an indicator of adolescents at risk for mental disorders.J Adolesc2000,
23(6):661–674.
3. Nansel TR, Craig W, Overpeck MD, Saluja G, Rua WJ, the Health Behaviour in School-aged Children Bullying Analyses Working Group:Cross-national consistency in the relationship between bullying behaviors and psychological adjustment.Arch Pediatr Adolesc Med2004,158(8):730–736. 4. Pepler D, Jiang DP, Craig W, Connolly J:Developmental trajectories of
bullying and associated factors.Child Dev2008,79(2):325–338. 5. Rigby K:Consequences of bullying in schools.Can J Psychiatry2003,
48(9):583–590.
6. Dhillon S:Amanda Todd tragedy draws impassioned response. The Globe and Mail.2012. http://www.theglobeandmail.com/news/british-columbia/ amanda-todd-tragedy-draws-impassioned-response/article4612470/]. Accessed July 19, 2013.
7. Hunter J:Clark touts fledgling anti-bullying plan. The Globe and Mail.2012. http://www.theglobeandmail.com/news/british-columbia/clark-touts-fledgling-anti-bullying-plan/article4612479/]. Accessed July 19, 2013.
8. Weeks C:I was bullied in school while my classmates and teachers watched in silence. The Globe and Mail.2012. [http://www.theglobeandmail.com/ news/national/i-was-bullied-in-school-while-my-classmates-and-teachers-watched-in-silence/article4612426/], Accessed July 19, 2013.
9. CBC News:Rehtaeh Parsons’strip-search allegations prompt review: independent expert to examine Capital Health hospital policies.[http:// www.cbc.ca/news/canada/nova-scotia/story/2013/06/25/ns-rehtaeh-parsons-hospital-strip-search-review.html], Accessed July 19, 2013.
10. The Globe and Mail:Why did Rehtaeh Parsons, an alleged victim of a gang sexual assault, have to leave her high school?http://www.theglobeandmail. com/commentary/editorials/why-did-rehtaeh-parsons-an-alleged-victim-of-a-gang-sexual-assault-have-to-leave-her-high-school/article12569905/]. Accessed July 19, 2013.
11. CBC News:Feds pledge $250K to youth-led anti-bullying project.[http:// www.cbc.ca/news/canada/ottawa/story/2013/06/02/feds-ottawa-bullying-hubley.html]. Accessed July 27, 2013.
12. Craig WM, Peters RD, Konarski R:Bullying and Victimization Among Canadian School Children.Ottawa: Applied Research Branch, Strategic Policy, Human Resources Development Canada; 1998.
13. UNICEF Office of Research:Child well-being in rich countries: a comparative overview. Innocenti Report Card 11.Florence: UNICEF Office of Research; 2013. 14. Gannon M, Mihorean K:Criminal Victimization in Canada, 2004. Juristat.
Ottawa: Statistics Canada; 2004.
15. Totten M, Quigley P:Parental Knowledge of Child-Reported Bully-Victim and Sexual Harassment Problems in Seven Canadian Schools: Implications for Policy and Program Development.Ottawa: Canadian Public Health Association; 2005. 16. Smith PK, Cowie H, Olafsson RF, Liefooghe AP, Almeida A, Araki H, del Barrio
and sex differences, in a fourteen-country international comparison. Child Dev2002,73(4):1119–1133.
17. Olweus D:Bullying at School: What We Know and What We Can Do.Oxford: Blackwell Publishers; 1993.
18. Theriot MT, Dulmus CN, Sowers KM, Johnson TK:Factors relating to self-identification among bullying victims.Child Youth Serv Rev2005,27:979–994. 19. Levitt SD:The changing relationship between income and crime
victimization.Econ Pol Rev1999,5(3):87–98.
20. Wilson WJ:The Truly Disadvantaged: the Inner City, the Underclass, and Public Policy.Chicago: University of Chicago Press; 1987.
21. Pearson K:Mathematical contributions to the theory of evolution - III. Regression, heredity, and panmixia.Phil Trans Roy Soc Lond B Biol Sci, Series A1896,187:253–318.
22. Evans AN:Using Basic Statistics in the Behavioral and Social Sciences.
Thousand Oaks: SAGE; 2013.
23. Cameron AC, Trivedi PK:Microeconometrics Using Stata, Revised Edition.
College Station: Stata Press; 2010.
24. Cameron AC, Trivedi PK:Microeconometrics: Methods and Applications.New York: Cambridge University Press; 2005.
25. Bauman S:Cyberbullying: what does the research tell us?Theory Into Pract2013,52(4):249–256.
26. Skye Wingate V, Jessy A, Minney JA, Guadagno RE:Sticks and stones may break your bones, but words will always hurt you: A review of cyberbullying.Soc Influence2013,8(2–3):87–106.
27. Roberts C, Freeman J, Samdal O, Schnohr CW, de Looze ME, Nic Gabhainn S, Iannotti R, Rasmussen M, the International HBSC Study Group:The Health Behaviour in School-aged Children (HBSC) study: methodological developments and current tensions.International Journal of Public Health
2009,54:S140–S150. doi:10.1007/s00038-009-5405-9.
doi:10.1186/2049-3258-72-19
Cite this article as:Zhanget al.:Is all bullying the same?Archives of
Public Health201472:19.
Submit your next manuscript to BioMed Central and take full advantage of:
• Convenient online submission
• Thorough peer review
• No space constraints or color figure charges
• Immediate publication on acceptance
• Inclusion in PubMed, CAS, Scopus and Google Scholar
• Research which is freely available for redistribution