Effect of low-protein diet on kidney
function in diabetic nephropathy:
meta-analysis of randomised
controlled trials
Uru Nezu,1Hiroshi Kamiyama,2Yoshinobu Kondo,3Mio Sakuma,4 Takeshi Morimoto,4Shinichiro Ueda1
To cite:Nezu U,
Kamiyama H, Kondo Y,et al. Effect of low-protein diet on kidney function in diabetic nephropathy:
meta-analysis of randomised controlled trials.BMJ Open 2013;3:e002934.
doi:10.1136/bmjopen-2013-002934
▸ Prepublication history and additional material for this paper are available online. To view these files please visit the journal online (http://dx.doi.org/10.1136/ bmjopen-2013-002934). Received 25 March 2013 Accepted 25 April 2013
This final article is available for use under the terms of the Creative Commons Attribution Non-Commercial 2.0 Licence; see
http://bmjopen.bmj.com
For numbered affiliations see end of article.
Correspondence to
Dr Shinichiro Ueda; [email protected]
ABSTRACT
Objective:To evaluate the effect of low-protein diet on kidney function in patients with diabetic nephropathy.
Design:A systematic review and a meta-analysis of randomised controlled trials.
Data sources:MEDLINE, EMBASE, Cochrane Library, ClinicalTrials.gov, International Standard Randomised Controlled Trial Number (ISRCTN) Register and University Hospital Medical Information Network-Clinical Trials Registry (UMIN-CTR) from inception to 10 December 2012. Internet searches were also carried out with general search engines (Google and Google Scholar).
Study selection:Randomised controlled trials that compared low-protein diet versus control diet and assessed the effects on kidney function, proteinuria, glycaemic control or nutritional status.
Primary and secondary outcome measures and data synthesis:The primary outcome was a change in the glomerular filtration rate (GFR). The secondary outcomes were changes in proteinuria, post-treatment value of glycated haemoglobin A1C (HbA1c) and post-treatment value of serum albumin. The results were summarised as the mean difference for continuous outcomes and pooled by the random effects model. Subgroup analyses and sensitivity analyses were conducted regarding patient characteristics, intervention period, methodological quality and assessment of diet compliance. The assessment of diet compliance was performed based on the actual protein intake ratio (APIR) of the low-protein diet group to the control group. Results:We identified 13 randomised controlled trials enrolling 779 patients. A low-protein diet was associated with a significant improvement in GFR (5.82 ml/min/ 1.73 m2, 95% CI 2.30 to 9.33, I2=92%; n=624). This effect was consistent across the subgroups of type of diabetes, stages of nephropathy and intervention period. However, GFR was improved only when diet compliance was fair (8.92, 95% CI 2.75 to 15.09, I2=92% for APIR <0.9 and 0.03, 95% CI−1.49 to 1.56, I2=90% for APIR
≥0.9). Proteinuria and serum albumin were not differed between the groups. HbA1c was slightly but significantly decreased in the low-protein diet group (−0.26%, 95% CI
−0.35 to−0.18, I2=0%; n=536).
Conclusions:Low-protein diet was significantly associated with improvement of diabetic nephropathy. The adverse effects of low-protein diet were not apparent such as worsening of glycaemic control and malnutrition.
INTRODUCTION
Diabetic nephropathy is the leading cause of end-stage renal disease necessitating renal
replacement therapy1 2and is also associated
with increased risk of cardiovascular
ARTICLE SUMMARY
Article focus
▪ Our research question is whether low-protein diet treatment is beneficial or not in patients with diabetic nephropathy.
▪ Our hypothesis was that low-protein diet improves kidney function, but this effect is affected by patients’ actual compliance with diet treatment.
Key messages
▪ A low-protein diet significantly improved kidney function in patients with diabetic nephropathy. ▪ This effectiveness was observed only when
patients’ diet compliance was fair; however, the successful treatment may not need to be as stringent as the current clinical guidelines recommend.
Strengths and limitations of this study ▪ Unique and reasonable approach to minimise the
bias by interstudy difference in patients’ compli-ance with diet treatment.
▪ Quality of the evidence was not high when assessed by the Grading of Recommendations, Assessment, Development and Evaluation (GRADE) approach.
▪ A few missing data were imputed, generating a risk of heterogeneity.
Nezu U, Kamiyama H, Kondo Y,et al.BMJ Open2013;3:e002934. doi:10.1136/bmjopen-2013-002934 1
Open Access Research
on September 22, 2020 by guest. Protected by copyright.
http://bmjopen.bmj.com/
mortality.3It affects up to 40% of diabetic patients4and the medical cost for treatment piles up to US$16.8 billion in the USA and US$1.2 billion in the UK each year.5
The progression of diabetic nephropathy can be
slowed down by optimal glycaemic control1 6 7 and that
of blood pressure control by renin-angiotensin system
blockade.8 9 As for the diet therapy, a low-protein diet
(LPD) is recommended in clinical guidelines by the
American Diabetes Association.10 11 This is based on
animal studies and several small studies on humans. However, previously conducted randomised controlled trials (RCTs) have not consistently shown the benefits of LPD.
To elucidate this clinical question, several
meta-analyses have been published on this topic.12–14
However, some of them included pre–post study and
crossover trials which might have obscured the pure effect of intervention. In addition, RCTs of diet
treat-ment have always been facing the difficulty of achieving
sufficient compliance. In this view, we conducted a
meta-analysis considering the interstudy variance of diet compliance with an additional study involving a
consid-erable number of patients subsequently published.15
METHODS
We carried out meta-analysis in accordance with the Preferred Reporting Items for Systematic Reviews and
Meta-Analysis (PRISMA) Statement for systematic
reviews and meta-analyses.16
Search strategy
We searched RCTs via PubMed, EMBASE, Cochrane
Library, ClinicalTrials.gov, International Standard
Randomised Controlled Trial Number (ISRCTN)
Register and University Hospital Medical Information
Network-Clinical Trials Registry (UMIN-CTR) from
inception to 10 December 2012 to identify relevant cita-tions. Internet searches were also carried out with general search engines (such as Google and Google Scholar). Studies written in English evaluating the effect of LPD comparing with control diet among diabetic patients were identified using the search terms ‘protein restriction’OR‘low protein diet’AND‘diabetes’.
Study selection
We assessed all the identified studies for the criteria of this meta-analysis. Two independent investigators (UN
and HK) sorted out the potentially relevant studiesfirst
by title and abstract review, and finally judged the eligi-bility by full-text review. When discrepancies occurred, we discussed in a committee involving four investigators of our research group (UN, MS, TM and SU).
Inclusion criteria are as follows: published in full text, RCTs with a parallel design of LPD among patients with either type 1 diabetes mellitus (T1DM) or type 2 diabetes mellitus (T2DM) and any of the following outcomes are
available; glomerular filtration rate (GFR), creatine
clearance (CCr), proteinuria, albuminuria, glycated haemoglobin A1C (HbA1c) or serum albumin. RCTs of crossover design were excluded because of the possible carryover effect. As for the studies likely to have multiple reports, we selected the most recent publication after
assessing their independency focusing on the patients’
background, intervention details, outcome settings and the results.
Data extraction
We extracted data related to published year, number of patients and their characteristics (age, gender, duration of diabetes mellitus and stages of diabetes nephropathy), details of the prescribed diet, intervention period. Also, we extracted data for patients’compliance by integrating the data on actual protein intake (g/kg/day, g/day, mg/ mg or energy per cent) evaluated in each study, then cal-culated the LPD to control ratio of actual protein intake (APIR). We utilised these results to assess study quality and subsequent subgroup analyses.
As primary outcome data, we extracted the mean
change in GFR (ml/min/1.73 m2) or CCr (ml/min/
1.73 m2) from baseline to the end of the diet intervention. As the secondary outcome, we extracted the mean change
in proteinuria (g/24 h), albuminuria (mg/24 h,μg/min),
urine albumin to creatine ratio (Cre, mg/mmol), post-treatment value of HbA1c (%) and post-post-treatment value of serum albumin (g/dl). Different digit numbers of protein-uria (mg/24 h) and albuminprotein-uria (g/24 h) were converted tofit the above scales.
We unified the notation for nephropathy stage into
three ways; normoalbuminuria, microalbuminuria (incipi-ent nephropathy) and macroalbuminuria (overt nephro-pathy).The value of HbA1c (%) extracted from Japanese articles was converted from Japan Diabetes Society (JDS) to National Glycohemoglobin Standardization Program (NGSP) by an equation announced by JDS as NGSP (%)
=1.02 × JDS (%)+0.25%.17
Risk of bias assessment
Using the Cochrane Collaboration’s ‘risk of bias’ tool,18 we assessed the risk of bias of included studies. We assessed seven domains: (1) sequence generation, (2) allocation concealment, (3) blinding of participants and personnel, (4) blinding of outcome assessment, (5) incomplete outcome data, (6) selective outcome
report-ing and (7) other bias by patients’ diet compliance.
Since this study aimed to investigate the clinical effect of dietary intervention which encourages patients’ lifestyle
modification, we considered that patients’ diet
compli-ance was the most critical factor to generate risk of bias. Therefore, we categorised studies with APIR over 0.9 as ‘high risk’.
Next, we scored the risk level of each domain from 0 to 2; high risk=2, unclear risk=1 and low risk=0. As an exception, we gave a score of 3 to ‘high risk’ of ‘other
bias by diet compliance’ to lay more weight on this
2 Nezu U, Kamiyama H, Kondo Y,et al.BMJ Open2013;3:e002934. doi:10.1136/bmjopen-2013-002934
Low-protein diet in diabetic nephropathy: meta-analysis
on September 22, 2020 by guest. Protected by copyright.
http://bmjopen.bmj.com/
domain. Finally, we assessed the included studies’overall risk of bias by the total score of the seven domains.
Quantitative data synthesis
We summarised results as the mean difference of con-tinuous variables with 95% CIs and combined data by means of a random effects model with inverse variance weighting. GFR and CCr were used interchangeably, since it is commonly used as an estimate of GFR. Since proteinuria and albuminuria were measured in different measurements and scales, we used the standardised mean difference by dividing the mean value by the SD.
If SDs were missing, we obtained them by converting from alternative variance measures such as SEs, CIs and p values. When even such information was not available, we
imputed the value using a technique by Follmann et al19
and Abramset al.20This technique utilises the correlation
coefficient obtained from a study giving detailed
information.
We subsequently conducted subgroup analyses for the
main outcomes. Prespecified subgroups were based on
the patients’ baseline characteristics (body mass index
(BMI), type of diabetes and stages of diabetic nephropa-thy) and study methodology (intervention period, meas-urement index of proteinuria, overall assessment risk of bias and diet compliance assessed by APIR).
We used I2 statistics to assess statistical heterogeneity among studies. The possible publication bias was assessed by visual asymmetry of a funnel plot. We
referred to the Cochrane Handbook V.5.1.018 for
meth-odological guidance. We used Review Manager
(RevMan) for Windows Software V.5.1.7 (the Nordic Cochrane Centre, Copenhagen, Denmark).
Quality of evidence
We graded the quality of evidence for the primary outcome using the Grading of Recommendations,
Assessment, Development and Evaluation (GRADE)
approach21 22 using GRADEpro software V.3.6 (for
Windows; Jan Brozek, Andrew Oxman, Holger
Schünemann, 2008). The quality of the evidence for GFR was low (see online supplementary table A).
RESULTS Search results
As shown in figure 1, we initially obtained 912 records
through electrical database search. Eight hundred and sixty-four were excluded after evaluation of titles and abstracts. After removing 27 duplicates, we selected 21 full-text articles for detailed assessment for eligibility. Among these, we excluded eight studies: one study owing to lack
of comparison,23 two studies of non-randomisation
trial24 25and three studies of crossover design.26–28In add-ition, we excluded two studies which were likely to have multiple reports published by the same author group.29 30 We included the recent publication in analyses. Similarly,
two studies by Pijls et al were likely to have multiple
reports. However, we did not exclude the previous publica-tion, since only that provided the postintervention value of HbA1c, the secondary outcome in our meta-analysis. Finally, we included 13 RCTs reporting the effects of LPD in diabetic patients.15 31–42
Characteristics of included studies
The included studies evaluated the effects of LPD in 779 diabetic patients (209 T1DM and 555 T2DM) from
Japan,15 Mexico,31 France,32 Italy,33 Australia,34
Denmark,35 Netherlands,36 37 39 South Africa,38 Italy41
and the USA.40 42Study patients were middle-aged men
and women, mostly obese or overweight (table 1). Mean
duration of diabetes history was 18 years. T1DM
accounted for six studies and T2DM forfive studies. Two
studies included both T1DM and T2DM patients and
Figure 1 Flow diagram of the process for study selection.
Nezu U, Kamiyama H, Kondo Y,et al.BMJ Open2013;3:e002934. doi:10.1136/bmjopen-2013-002934 3
Low-protein diet in diabetic nephropathy: meta-analysis
on September 22, 2020 by guest. Protected by copyright.
http://bmjopen.bmj.com/
provided no separate information. The stage of diabetic nephropathy ranged from normoalbuminuria to macro-albuminuria. Eight studies provided distinct information generated from a single nephropathy stage; however, the
remaining five studies reported only the combined
results of two neighbour stages. Baseline GFR was
76 ml/min/1.73 m2and HbA1c was 8.3% in average. An
intervention period ranged from 3 to 60 months
(18 months in median). All trials clarified random
assignment and the methods were generally adequate
(see online supplementary figure A and table B).
However, allocation concealment was unclear in about half of the studies. With regards to blinding of
interven-tion, only one study31 applied single-blind method.
Although the outcome assessment was not blinded to the assessors in any of the studies, the risk of bias is con-sidered to be small since the outcome is objective. Attrition bias was seen in variety. We considered the pro-portion in the number of incomplete patients and the reasons for dropping out, in order to see whether these were different across the intervention groups. Although selective reporting was not concerned, other biases by
insufficient diet compliance were considered in four
studies as we describe later.
Diet prescription and compliance assessment
Table 2 shows the details of diet prescription and com-pliance assessment. The prescribed protein level was
0.6–0.8 g/kg/day in LPD and 1.0–1.6 g/kg/day in
control. Infive studies, patients in the control diet treat-ment group were instructed to continue their habitual diet instead of setting any numerical goal of protein intake.33 35–37 39
Diet compliance was assessed in all trials. Ten studies measured 24 h urine urea nitrogen (24 h UUN) and cal-culated daily protein intake (g/kg/day).15 31–33 35–40
They used Maroni’s formula, the gold standard of
protein intake estimation considering nitrogen loss from
a non-urine source.43 44One study by Ben et alreported
only the value of 24 UUN (g/day) without using this
formula.42 Nine studies conducted additional or
alterna-tive assessment, such as spot UUN to Cre (UUN/Cre),34
4 h UUN,41 food questionnaire, food record or recall
technique.15 31–33 37 39
APIR ranged from 0.44 to 1.07. When setting the cut-off value of APIR for sufficient compliance as 0.9, it was less than 0.9 in only nine studies (69.2%). Interestingly, all of the T1DM studies showed fair compli-ance (APIR <0.9).35 38–42 However, only two out of five
T2DM31 34 study achieved fair diet compliance.31 34
Two studies including both T1DM and T2DM patients showed values of 1.07 and 0.69, respectively.32 33
Effects of LPD on kidney function
Eleven trials of 624 patients provided the change in kidney function assessed either by GFR or CCr. GFR was
significantly increased by 5.82 ml/min/1.73 m2 after
LPD (95% CI 2.30 to 9.33 ml/min/1.73 m2; figure 2).
We found a significant heterogeneity across the studies
(I2=92%, p<0.00001); however, the funnel plot showed
no major asymmetricity (see online supplementary figure D).
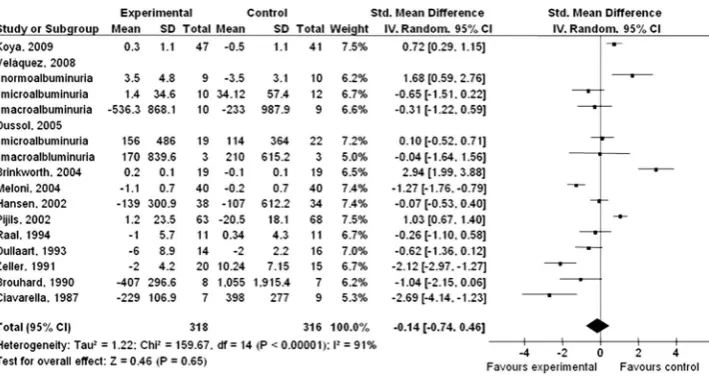
Effects of LPD on proteinuria
Twelve studies of 634 patients provided sufficient infor-mation regarding change in proteinuria.15 31–36 38–42
The standard mean difference showed no significant
change in proteinuria after LPD (−0.14, 95% CI −0.74
to 0.46; p=0.65;figure 3). Although we found
heterogen-eity across the studies (I2=91%, p<0.00001), the funnel plot showed no major asymmetricity (see online
supple-mentaryfigure E).
Effects of LPD on glycaemic control
Glycaemic control was assessed by the absolute value of HbA1c after diet treatment. In eleven studies which pro-vided sufficient information, HbA1c was slightly but
sig-nificantly decreased after LPD (−0.26%, 95% CI −0.35
to −0.18; see online supplementary figure B). Although
we found heterogeneity across the studies (I2=0%,
p<0.00001), the funnel plot showed no major
asymmetri-city (see online supplementaryfigure F).
Effects of LPD on nutritional status
Nutritional status was assessed by the absolute value of serum albumin after diet treatment. Only four studies of 179 patients provided sufficient information.32 33 38 39As a result, serum albumin was not changed after LPD (−0.18, 95% CI−0.53 to 0.17, p=0.32; see online
supple-mentaryfigure C). Heterogeneity between trials was
sig-nificant (I2=88%, p<0.00001), and the funnel plot
showed asymmetrical appearance (see online
supple-mentaryfigure G).
Subgroup and sensitivity analyses
Table 3 shows subgroup analysis according to clinical characteristics and study quality. There were significant differences in change in GFR between the subgroups based on nephropathy stage ( p=0.03) and diet
compli-ance ( p=0.006). Specifically, GFR was improved in the
subgroup of macroalbuminuria and subgroup of fair
diet compliance (APIR <0.9). There was no significant
difference between subgroups of BMI, type of diabetes, overall risk of bias and diet compliance. As for the change in proteinuria, there were significant differences between the subgroups of BMI ( p<0.0001), type of dia-betes ( p=0.002), nephropathy stage ( p=0.001) and measurement index of proteinuria ( p<0.00001). There
was no significant difference between the subgroups of
intervention period, overall risk of bias and diet compli-ance. The post-treatment value of HbA1c was not dif-fered across the subgroups. As for serum albumin, the sensitivity analysis excluding only one study by Dussol
et al, which showed poor diet compliance (APIR 1.02),
showed no significant change after LPD (−0.25, 95% CI
−0.64 to 0.15; p=0.22, I2=91%, data not shown in table).
4 Nezu U, Kamiyama H, Kondo Y,et al.BMJ Open2013;3:e002934. doi:10.1136/bmjopen-2013-002934
Low-protein diet in diabetic nephropathy: meta-analysis
on September 22, 2020 by guest. Protected by copyright.
http://bmjopen.bmj.com/
Table 1 Characteristics of included studies
Author (year) Subjects (n) Male (n) Age (years) BMI (kg/m2)
Type of diabetes
Duration of diabetes (years)
Nephropathy stage
GFR (ml/min/ 1.73 m2)
HbA1c (%)
Intervention period (months)
Koya (2009) 112 59 57 24.6 T2 – Macroalbuminuria 62 8.1 60
Velázquez (2008) 60 40 67 27.7 T2 17 Normoalbuminuria,
microalbuminuria or
macroalbuminuria
55 8.3 4
Dussol (2005) 47 83 52 – Mixed 15 Microalbuminuria
or
macroalbuminuria
38 8.1 24
Meloni (2004) 80 48 55 – Mixed 17 Macroalbuminuria 100 7.0 12
Brinkworth (2004) 38 39 62 33.5 T2 – Normoalbuminuria
or
microalbuminuria
– 6.4 3
Hansen (2002) 72 65 41 25.0 T1 28 Macroalbuminuria 62 9.8 48
Pijls (2002) 131 58 66 27.8 T2 7 Normoalbuminuria
or
microalbuminuria
86 7.7 28
Pijls (1999) 121 61 63 27.7 T2 7 Normoalbuminuria
or
microalbuminuria
82 7.7 12
Raal (1994) 22 36 30 24.9 T1 20 Macroalbuminuria 84 13.0 6
Dullaart (1993) 30 90 41 24.1 T1 23 Microalbuminuria 68 7.8 24
Zeller (1991) 35 60 34 – T1 22 Macroalbuminuria 126 7.9 35
Brouhard (1990) 15 9 33 – T1 19 Microalbuminuria
or
macroalbuminuria
47 7.3 12
Ciavarella (1987) 16 56 37 – T1 18 Macroalbuminuria 100 8.9 4.5
BMI, body mass index; GFR, glomerular filtration rate; HbA1c, haemoglobin A1C; T1, type 1; T2, type 2.
Nezu
U,
Kamiy
ama
H,
Kondo
Y
,
et
al
.
BMJ
Open
2013;
3
:e002934.
doi:10.1136/
bmjopen-20
13-002934
5
Lo
w-pr
otein
d
iet
in
d
iabetic
n
ephr
opa
thy:
meta-analy
sis
Table 2 Details of diet prescription and compliance assessment
Author (year)
LPD Control
Actual protein intake based on 24 h UUN*
Actual protein intake based on alternative methods*
Subjects
(n) Prescription*
Subjects
(n) Prescription*
LPD vs
control* APIR Method LPD vs control* APIR
Koya (2009) 56 0.8 56 1.2 1.0 vs 1.0 1.0 FR 0.9 vs 1.1 –
Velázquez (2008) 29 0.6–0.8 31 1.0–1.2 0.82 vs 1.2 0.68 RT (24 h) 56.0 vs 80.7 (g/day) –
Dussol (2005) 22 0.8 25 1.2 1.10 vs 1.03 1.07 FQ 68 vs 84 (g/day) –
Meloni (2004) 40 0.8 40 Free 0.86 vs 1.24 0.69 FQ 0.86 vs 1.24 –
Brinkworth (2004) 19 15% of energy from protein
19 30% of energy from protein
– – UUN/Cre 35.6 vs 42.9 (mg/mg) 0.8
Hansen (2002) 38 0.6 34 As usual 0.89 vs 1.02 0.87 – – –
Pijls (2002) 63 0.8 68 As usual 1.1 vs 1.14 0.96 – – –
Pijls (1999) 58 0.8 63 As usual 1.12 vs 1.15 0.97 FQ 0.93 vs 1.12 –
Raal (1994) 11 0.8 11 1.6 0.87 vs 2.0 0.44 FQ value not described –
Dullaart (1993) 14 0.6 16 As usual 0.79 vs 1.09 0.72 RT
(1 week)
Animal protein, 5 vs 10 (energy %)
Vegetable protein, 6 vs 6 (energy %)
–
Zeller (1991) 20 0.6 15 >1.0 0.72 vs 1.08 0.67 – – –
Brouhard (1990) 8 0.6 7 As usual – – 24 h UUN 5.8 vs 9.8 (g/day) 0.6
Ciavarella (1987) 7 0.71 9 1.44 – – 4 h UUN 0.8 vs 1.44 0.6
*Units: g/kg/day unless specified.
APIR, actual protein intake ratio of LPD to control; FQ, food questionnaire; FR, food record; LPD, low-protein diet; RT, recal technique; UUN, urine urea nitrogen; UUN/Cre, urine urea nitrogen to creatine ratio.
6
Nezu
U,
Kamiy
ama
H,
Kondo
Y
,
et
al
.
BMJ
Open
2013;
3
:e002934.
doi:10.1136/
bmjopen-20
13-002934
Lo
w-pr
otein
d
iet
in
d
iabetic
n
ep
hr
opa
thy:
meta-analy
sis
We conducted sensitivity analyses seeking a pure effect of LPD on diabetic nephropathy. First, we excluded a subgroup of normoalbuminuria patients in the study by Velázquez et al,31 since its separate data were provided. The overall improvement was consistent with regard to GFR (6.31, 95% CI 2.47 to 10.15; p<0.00001, I2=92%) as
well as HbA1c (−0.26, 95% CI −0.34 to −0.17;
p=0.00001, I2=0%). Subsequently, we excluded an
add-itional three studies that provided combined data of
nor-moalbuminuria and microalbuminuria patients.34 36 37
In this way, patients without diabetic nephropathy were completely eliminated. As a result, improvement of GFR was still significant (6.32, 95% CI 2.52 to 10.52; p=0.001, I2=93%) and proteinuria improved significantly (−0.62, 95% CI−1.15 to−0.09; p=0.02, I2=84%).
DISCUSSION
A statement of the principal findings
We found a protective effect of dietary intervention by LPD on the course of diabetic nephropathy by
improving GFR and proteinuria. In addition, LPD did not worsen either glycaemic control or nutritional status.
Strength and limitations of the study
Although we searched only English publications, the included numbers of studies and patients were larger than those of any of the previous meta-analyses. Another strength is that we took a unique but reasonable approach to minimise the bias by interstudy difference
in patients’ compliance to diet treatment. We proposed
APIR as the common index that enables the compliance level to be compared across studies. The subgroup ana-lysis based on APIR showed that LPD improved GFR only when intervention was sustainable, which is clinic-ally reasonable.
In addition, APIR was also utilised in the sensitivity analysis of serum albumin, in which three studies with fair diet compliance consistently showed no worsening of nutritional status. Since the number of included Figure 2 Effects of low-protein diet on glomerular filtration rate.
Figure 3 Effects of low-protein diet on proteinuria.
Nezu U, Kamiyama H, Kondo Y,et al.BMJ Open2013;3:e002934. doi:10.1136/bmjopen-2013-002934 7
Low-protein diet in diabetic nephropathy: meta-analysis
on September 22, 2020 by guest. Protected by copyright.
http://bmjopen.bmj.com/
Table 3 Subgroup analyses and sensitivity analyses for clinical characteristics and study quality
GFR Proteinuria
Subgroups
Number of comparisons
Mean difference
(95% CI) I2(%) p Value*
Number of comparisons
Mean difference
(95% CI) I2(%) p Value*
BMI
Overweight or obese (BMI≥25) 6 6.51 (0.29 to 12.73) 89 0.57 8 0.58 (−0.13 to 1.28) 87 <0.0001 Healthy weight (BMI <25) 3 0.82 (−11.12 to 12.76) 89 3 −0.01 (−0.91 to 0.90) 82
Unknown 4 9.50 (−1.66 to 20.67) 96 4 −1.64 (−2.27 to−1.01) 50
Type of diabetes
T1DM 6 6.73 (−1.45 to 14.91) 94 0.05 6 −1.02 (−1.79 to−0.25) 81 0.002
T2DM 5 8.63 (−0.24 to 17.50) 87 6 0.88 (0.11 to 1.64) 88
Mixed 2 0.19 (−0.43 to 0.80) 0 3 −0.48 (−1.57 to 0.61) 84
Nephropathy stage
Normoalbuminuria or mix of normoalbuminuria and microalbuminuria
2 1.81 (−1.91 to 5.53) 0 0.03 3 1.83 (0.63 to 3.03) 86 0.001
Microalbuminuria 2 2.96 (−18.41 to 24.32) 95 3 −0.33 (−0.84 to 0.18) 32 Mix of microalbuminuria and
macroalbuminuria
2 −2.18 (−8.94 to 4.58) 0 1 −1.04 (−2.15 to 0.06) –
Macroalbuminuria 7 9.05 (4.30 to 13.81) 95 8 −0.69 (−1.45 to 0.07) 89
Intervention period
Short (6–23 months)† 7 10.52 (3.69 to 17.35) 92 0.06 8 −0.18 (−1.27 to 0.91) 92 0.89 Long (≥24 months) 6 1.33 (−5.56 to 8.23) 92 7 −0.09 (−0.78 to 0.60) 90
Overall risk of bias
High (risk score 4–8) 5 3.01 (−5.92 to 11.94) 85 0.50 6 −0.16 (−1.04 to 0.71) 91 0.95 Low (risk score 1–3) 8 6.37 (2.58 to 10.16) 92 9 −0.12 (−0.96 to 0.71) 91
Diet compliance:
Fair (APIR <0.9) 9 8.92 (2.75 to 15.09) 94 0.006 10 −0.42 (−1.32 to 0.48) 91 0.1
Poor (APIR≥0.9) 4 0.03 (−1.49 to 1.56) 0 5 0.43 (−0.06 to 0.93) 76
Measurement index of proteinuria
Proteinuria (g/24 h) – – – – 4 −0.71 (−1.99 to 0.57) 94 <0.00001
Albuminuria (mg/24 h) – – – 7 0.26 (−0.33 to 0.85) 80
Albuminuria (μg/min) – – – 3 −1.30 (−2.39 to−0.22) 67
Albumin/Cre ratio (mg/mmol) – – – 1 2.94 (1.99 to 3.88) –
Sensitivity analysis Excluding a subgroup of normoalbuminuria with separate data
12 6.31 (2.47 to 10.15) 92 14 −0.26 (−0.88 to 0.36) 91
Excluding studies including normoalbuminuria
11 6.52 (2.52 to 10.52) 93 12 −0.62 (−1.15 to−0.09) 84
*p Value for subgroup difference.
†Short intervention period was 3–23 months for proteinuria.
APIR, actual protein intake ratio; BMI, body mass index; Cre ratio, creatine ratio; GFR, glomerular filtration rate; T1DM, type 1 diabetes mellitus; T2DM, type 2 diabetes mellitus.
8
Nezu
U,
Kamiy
ama
H,
Kondo
Y
,
et
al
.
BMJ
Open
2013;
3
:e002934.
doi:10.1136/
bmjopen-20
13-002934
Lo
w-pr
otein
d
iet
in
d
iabetic
n
ep
hr
opa
thy:
meta-analy
sis
studies was limited, the interpretation should be cau-tious. We need another large scale of RCTs to draw more accurate conclusions in terms of this issue on malnutrition.
This study has some more limitations. First, the quality of the evidence assessed for GFR was not high according to the GRADE approach. Two factors that lowered the grade were the inconsistency of the intervention and the indirectness of the outcome. Although the directions of the intervention were consistent across most studies, there was a small overlap in the CIs, and also the hetero-geneity was not negligible. This inconsistency may be partly explained by the difference in the study protocol. GFR was measured in different ways in the RCTs included in this meta-analysis, as is also the case in clin-ical practice. As for the indirectness of outcome, GFR is a candidate surrogate marker to predict kidney failure or initiation of dialysis. However, we should not oversim-plify that increasing GFR always represents a better
prog-nosis of the patients’ kidney function because
glomerular hyperfiltration may occur in early stages of
renal damage as postulated by Brenner et al.45 In
add-ition, the long-term clinical validity of GFR is not suffi -cient. We hope that more large-scale prospective studies or another meta-analysis will elucidate the effect of LPD on the change in GFR as well as on more long-term
clinical outcomes such as mortality, dialysis or
transplantation.
The second limitation was the overlaps of nephropathy stages in the subgroup analysis as shown intable 3. Since several studies enrolled patients in more than two stages of nephropathy without reporting the respective sepa-rated data, the subgroup analysis could not make clear subgroups without stage overlaps. Therefore, in order to seek a pure effect of LPD in diabetic nephropathy, we conducted sensitivity analyses by removing a subgroup comparison or the studies that included patients free from diabetic nephropathy. The analyses showed a
con-sistently significant improvement in GFR. Although
pro-teinuria was improved differently from the overall analysis, it is reasonable in two ways. First, it is logically impossible to reduce albuminuria in patients who have not suffered from albuminuria. Second, the relation is clinically compatible between reduction of proteinuria and improvement in kidney function.
The third limitation was that a part of the missing information for outcome was imputed, generating a risk of heterogeneity. We estimated unknown SDs by using
the correlation coefficient obtained from included
studies in this meta-analysis. However, the correlation
coefficient was drawn from a study or a subgroup of
macroalbuminuria.31 32Therefore, this estimation might
not have been proper substitutes for studies or sub-groups of patients with normoalbuminuria or microalbu-minuria. Sensitivity analysis excluding the study that enrolled patients with normoalbuminuria still includes microalbuminuric patients, and thus the interpretation should be cautious.
Comparison with other studies
There are three meta-analyses on this issue pooling the
data from RCTs. The meta-analysis by Pedrini et al14
reported the beneficial effects of LPD; however, they
combined RCTs and non-randomised crossover trials. In addition, they used a composite outcome of GFR or
albuminuria. The meta-analyses by Pan et al12 and
Robertson et al13 did not show significant effects on
kidney function. The different result is explainable by the difference in the pooled study number and popula-tion size. The meta-analysis by Robertsonet al especially have pooled the data from only seven RCTs, since they
focused on a study including T1DM patients.
Consistently, in our analysis, GFR in T1DM patients was improved but not statistically significantly.
Pan et al’s meta-analysis included two reports by Pijls
et al.37 However, the patient’s background in these two
reports was almost identical as shown in table 1. What
was different was the number of patients and the inter-vention period, which was large and longer in a recent publication. Our reviewers discussed in the committee and concluded that the previous publication might be the interim analysis of a longer project. Therefore,
although both these studies are listed in our
meta-analysis, their results are not used simultaneously in the same outcome analysis. We extracted data on GFR and albuminuria from the recent publication. Data on HbA1c was extracted from the previous publication since it was not reported in the recent one. We believe this strategy will not interfere with excluding the dupli-cate publication bias as warned in section 10.2.2.1. of the Cochrane Handbook for Systematic Reviews of Interventions V.5.1.0.18
Another difference between our study and Pan et al’s
meta-analysis is that we added two newly conducted RCTs by Koyaet al15 and Velázquez et al.31 However, the level of 24 h UUN was 1 in the study by Koyaet al, which was no less than that in the control group (APIR=1). In addition, the intervention period of the study by
Velázquezet al was only 4 months, which might be
insuf-ficient to detect the change in GFR as discussed by
Zeller et al.40 We need more large-scale RCTs of suffi
-cient length and sufficiently compliant for more
conclu-sive evidence regarding the effect of LPD on GFR.
Messages for clinicians
This meta-analysis showed that LPD improved the kidney function of patients with diabetic nephropathy
only when their diet compliance was fair. This finding
lets clinicians reaffirm the importance of long-term sus-tainability of dietary intervention. We think we are quite aware of the importance, but we have also been experi-encing the challenge presented by this task. However, this study result showed that the protein restriction need not be as stringent as we have been thinking. The cut-off value of APIR for fair compliance was 0.9 in this study, which was modest compared with the current clinical
Nezu U, Kamiyama H, Kondo Y,et al.BMJ Open2013;3:e002934. doi:10.1136/bmjopen-2013-002934 9
Low-protein diet in diabetic nephropathy: meta-analysis
on September 22, 2020 by guest. Protected by copyright.
http://bmjopen.bmj.com/
guideline.11 This finding casts a new light on our man-agement of diet treatment.
Conclusion and future research
A diet intervention by LPD has modest but significant
effects on the course of kidney prognosis in patients with diabetic nephropathy, especially when the
interven-tion is sustainable regarding patients’ compliance. This
result of meta-analysis questions whether LPD prevents or delays more important clinical outcomes such as kidney failure, initiation of dialysis and death. Further meta-analyses that focus on these outcomes are needed.
Author affiliations
1Department of Clinical Pharmacology & Therapeutics, University of the Ryukyus, Okinawa, Japan
2Department of Endocrinology & Metabolism, Yokohama City University Graduate School of Medicine, Kanagawa, Japan
3Department of Endocrinology & Metabolism, Chigasaki Municipal Hospital, Kanagawa, Japan
4Department of Internal Medicine, Hyogo College of Medicine, Hyogo, Japan Contributors UN had the idea for the study and designed the method of this meta-analysis including the inclusion and exclusion criteria, conducted data collection and extraction, wrote the first draft of the report and did the statistical analysis with guidance from MS and TM. UN and HK searched the articles and assessed their eligibility. When discrepancies occurred, the eligibility of the articles was discussed by the committee consisting of UN, MS, TM and SU. TM did the major revision and also made comments. All other authors commented on the draft and approved the final version of the manuscript. UN and SU are the guarantors.
Funding This research received no specific grant from any funding agency in the public, commercial or not-for-profit sectors.
Competing interests None.
Provenance and peer review Not commissioned; externally peer reviewed.
Data sharing statement No additional data are available.
REFERENCES
1. The Diabetes Control and Complications Trial Research Group. The effect of intensive treatment of diabetes on the development and progression of long-term complications in insulin-dependent diabetes mellitus.N Engl J Med1993;329:977–86.
2. Retnakaran R, Cull CA, Thorne KI,et al. Risk factors for renal dysfunction in type 2 diabetes: U.K. Prospective Diabetes Study 74. Diabetes2006;55:1832–9.
3. Valmadrid CT, Klein R, Moss SE,et al. The risk of cardiovascular disease mortality associated with microalbuminuria and gross proteinuria in persons with older-onset diabetes mellitus.Arch Inter Med2000;160:1093–100.
4. Ritz E, Orth SR. Nephropathy in patients with type 2 diabetes mellitus.N Engl J Med1999;341:1127–33.
5. Gordois A, Scuffham P, Shearer A,et al. The health care costs of diabetic nephropathy in the United States and the United Kingdom. J Diabetes Complications2004;18:18–26.
6. Group UPDSU. Intensive blood-glucose control with sulphonylureas or insulin compared with conventional treatment and risk of complications in patients with type 2 diabetes (UKPDS 33).Lancet 1998;352:837–53.
7. Intensive blood glucose control and vascular outcomes in patients with type 2 diabetes—NEJM. http://www.nejm.org/doi/full/10.1056/ NEJMoa0802987 (accessed 13 Dec 2012).
8. Effects of losartan on renal and cardiovascular outcomes in patients with type 2 diabetes and nephropathy—NEJM. http://www.nejm.org/ doi/full/10.1056/NEJMoa011161 (accessed 13 Dec 2012). 9. Lewis EJ, Hunsicker LG, Bain RP,et al. The effect of
angiotensin-converting-enzyme inhibition on diabetic nephropathy. The Collaborative Study Group.N Engl J Med1993;329:1456–62.
10. Molitch ME, DeFronzo RA, Franz MJ,et al. Diabetic nephropathy. Diabetes Care2003;26(Suppl 1):S94–8.
11. American Diabetes Association. Standards of medical care in diabetes—2013.Diabetes Care2012;36:S11–66.
12. Pan Y, Guo LL, Jin HM. Low-protein diet for diabetic nephropathy: a meta-analysis of randomized controlled trials.Am J Clin Nutr 2008;88:660–6.
13. Robertson L, Waugh N, Robertson A. Protein restriction for diabetic renal disease.Cochrane Database Syst Rev2007;4: CD002181.
14. Pedrini MT, Levey AS, Lau J,et al. The effect of dietary protein restriction on the progression of diabetic and nondiabetic renal diseases: a meta-analysis.Ann Intern Med1996;124:627–32. 15. Koya D, Haneda M, Inomata S,et al. Long-term effect of
modification of dietary protein intake on the progression of diabetic nephropathy: a randomised controlled trial.Diabetologia
2009;52:2037–45.
16. Moher D, Liberati A, Tetzlaff J,et al. Preferred reporting items for systematic reviews and meta-analyses: the PRISMA statement.BMJ 2009;339:b2535.
17. Seino Y, Nanjo K, Tajima N,et al. Report of the Committee on the Classification and Diagnostic Criteria of Diabetes Mellitus.Diabetol Int2010;1:2–20.
18. Cochrane Handbook for Systematic Reviews of Interventions. http:// handbook.cochrane.org/ (accessed 11 Dec 2012).
19. Follmann D, Elliott P, Suh I,et al. Variance imputation for overviews of clinical trials with continuous response.J Clin Epidemiol 1992;45:769–73.
20. Abrams KR, Gillies CL, Lambert PC. Meta-analysis of
heterogeneously reported trials assessing change from baseline. Stat Med2005;24:3823–44.
21. Balshem H, Helfand M, Schünemann HJ,et al. GRADE guidelines: 3. Rating the quality of evidence.J Clin Epidemiol2011;64:401–6. 22. Guyatt GH, Oxman AD, Vist G,et al. GRADE guidelines: 4. Rating
the quality of evidence—study limitations (risk of bias).J Clin Epidemiol2011;64:407–15.
23. Narita T, Koshimura J, Meguro H,et al. Determination of optimal protein contents for a protein restriction diet in type 2 diabetic patients with microalbuminuria.Tohoku J Exp Med2001;193:45–55. 24. Sugimoto T, Kikkawa R, Haneda M,et al. Effect of dietary protein
restriction on proteinuria in non-insulin-dependent diabetic patients with nephropathy.J Nutr Sci Vitaminol (Tokyo)1991;37(Suppl): S87–92.
25. Giordano M, Lucidi P, Ciarambino T,et al. Effects of dietary protein restriction on albumin and fibrinogen synthesis in macroalbuminuric type 2 diabetic patients.Diabetologia2008;51:21–8.
26. Percheron C, Colette C, Astre C,et al. Effects of moderate changes in protein intake on urinary albumin excretion in type I diabetic patients.Nutrition1995;11:345–9.
27. Walker JD, Bending JJ, Dodds RA,et al. Restriction of dietary protein and progression of renal failure in diabetic nephropathy. Lancet1989;2:1411–15.
28. Pedersen MM, Mogensen CE, Jørgensen FS,et al. Renal effects from limitation of high dietary protein in normoalbuminuric diabetic patients.Kidney Int Suppl1989;27:S115–21.
29. Hansen HP, Christensen PK, Tauber-Lassen E,et al. Low-protein diet and kidney function in insulin-dependent diabetic patients with diabetic nephropathy.Kidney Int1999;55:621–8.
30. Meloni C, Morosetti M, Suraci C,et al. Severe dietary protein restriction in overt diabetic nephropathy: benefits or risks?J Ren Nutr2002;12:96–101.
31. Velázquez López L, Sil Acosta MJ,et al. Effect of protein restriction diet on renal function and metabolic control in patients with type 2 diabetes: a randomized clinical trial.Nutr Hosp2008;23:141–7. 32. Dussol B, Iovanna C, Raccah D,et al. A randomized trial of
low-protein diet in type 1 and in type 2 diabetes mellitus patients with incipient and overt nephropathy.J Ren Nutr2005;15: 398–406.
33. Meloni C, Tatangelo P, Cipriani S,et al. Adequate protein dietary restriction in diabetic and nondiabetic patients with chronic renal failure.J Ren Nutr2004;14:208–13.
34. Brinkworth GD, Noakes M, Parker B,et al. Long-term effects of advice to consume a high-protein, low-fat diet, rather than a conventional weight-loss diet, in obese adults with type 2 diabetes: one-year follow-up of a randomised trial.Diabetologia
2004;47:1677–86.
35. Hansen HP, Tauber-Lassen E, Jensen BR,et al. Effect of dietary protein restriction on prognosis in patients with diabetic nephropathy. Kidney Int2002;62:220–8.
36. Pijls LTJ, De Vries H, Van Eijk JTM,et al. Protein restriction, glomerular filtration rate and albuminuria in patients with type 2
10 Nezu U, Kamiyama H, Kondo Y,et al.BMJ Open2013;3:e002934. doi:10.1136/bmjopen-2013-002934
Low-protein diet in diabetic nephropathy: meta-analysis
on September 22, 2020 by guest. Protected by copyright.
http://bmjopen.bmj.com/
diabetes mellitus: a randomized trial.Eur J Clin Nutr 2002;56:1200–7.
37. Pijls LT, De Vries H, Donker AJ,et al. The effect of protein restriction on albuminuria in patients with type 2 diabetes mellitus: a
randomized trial.Nephrol Dial Transplant1999;14:1445–53. 38. Raal FJ, Kalk WJ, Lawson M,et al. Effect of moderate dietary
protein restriction on the progression of overt diabetic nephropathy: a 6-mo prospective study.Am J Clin Nutr1994;60:579–85. 39. Dullaart RP, Beusekamp BJ, Meijer S,et al. Long-term effects of
protein-restricted diet on albuminuria and renal function in IDDM patients without clinical nephropathy and hypertension.Diabetes Care1993;16:483–92.
40. Zeller K, Whittaker E, Sullivan L,et al. Effect of restricting dietary protein on the progression of renal failure in patients with
insulin-dependent diabetes mellitus.N Engl J Med1991;324: 78–84.
41. Ciavarella A, Di Mizio G, Stefoni S,et al. Reduced albuminuria after dietary protein restriction in insulin-dependent diabetic patients with clinical nephropathy.Diabetes Care1987;10:407–13.
42. Brouhard BH, Lagrone L. Effect of dietary protein restriction on functional renal reserve in diabetic nephropathy.Am J Med1990;89:427–31. 43. Maroni BJ, Steinman TI, Mitch WE. A method for estimating nitrogen
intake of patients with chronic renal failure.Kidney Int 1985;27:58–65.
44. Bingham SA. Urine nitrogen as a biomarker for the validation of dietary protein intake.J Nutr2003;133(Suppl):921S–4S. 45. Brenner BM, Lawler EV, Mackenzie HS. The hyperfiltration theory:
a paradigm shift in nephrology.Kidney Int1996;49:1774–7.
Nezu U, Kamiyama H, Kondo Y,et al.BMJ Open2013;3:e002934. doi:10.1136/bmjopen-2013-002934 11
Low-protein diet in diabetic nephropathy: meta-analysis
on September 22, 2020 by guest. Protected by copyright.
http://bmjopen.bmj.com/