G Strojniški vestnik (44) št. 3-4, str. 129-136, 1998 Tiskano v Sloveniji. Vse pravice pridržane. UDK 532:621.643/ 644:681.3.06:519.68 Strokovni članek
© Journal o f Mechanical Engineering (44) No. 3-4, pp 129-136, 1998 Printed in Slovenia. All rights reserved.
SV-0039-2480(98)2-R6 UDC 532:621.643/.644:681.3.06:519.68
v Speciality paper
Programsko orodje za pretočno tlačno analizo razmer v cevnih mrežah
A Software Tool for Pressure-Flow Analysis of Conditions in Pipe Networks
DARKO GORIČANEC - ANDREJ JAKL - JURIJ KROPE - VIKTOR KRAJNC
V prispevku je opisano programsko orodje, ki omogoča določitev pretočno-tlačnih razmer in vodenje tehničnih informacij hidravlične cevne mreže. Računalniško aplikacijo povezuje v celoto objektno zasnovana lupina, ki lahko prevzame vlogo vmesnika med sedanjimi informacijskimi sistemi znotraj podjetja, geografskimi informacijskimi sistemi (GlS-i) in orodji za računalniško načrtovanje (RN-CAD) ter numeričnimi moduli za tehnične izračune. Podatki o cevni mreži se vnašajo preko uporabniško
prijaznih vmesnikov, ki so integrirani v CAD okolje AutoCAD-a za M S Windows.
Ključne besede: mehanika fluidov, mreže cevovodne, sistemi informacijski, CAD
A software tool designed to determine pressure-flow conditions and to manage the engineering data o f a hydraulic pipe networks is presented. The computer application is connected into one unit by an object-oriented shell acting as an interface between the existing information systems within the company, geographic information systems (GIS) and CAD tools on the one hand and the numerical modules fo r engineering computations on the other hand. The data about the pipe network are entered via user-friendly interfaces integrated into the AutoCAD environment fo r M S Windows.
Key words: fluid mechanics, pipe networks, information systems, CAD
0 UVOD
V še ne tako daljni preteklosti so cevna omrežja načrtovali in gradili predvsem na podlagi bolj ali manj natančnih ocen, saj so tovrstni prenosni sistemi po navadi precej razsežni in jih brez uporabe digitalnih računalnikov zelo težko obvladujemo.
Zaradi napredovanja tehnike nasploh je vedno bolj izražena tudi potreba po integralnem zbiranju in obdelovanju informacij ter interdiscipli narnem delu. Za uspešno in produktivno delo na interdisciplinarnem področju pa je nujno potrebno tudi informacijsko povezovanje strok med seboj na vseh ravneh, kjer se med seboj srečujejo, prepletajo in dopolnjujejo. Tako je nastala potreba po gradnji informacijskih sistemov, ki morajo biti zasnovani kar se da splošno, obenem pa morajo ponuditi ustrezno izhodišče tudi za specializirane zahteve stroke. Trenutna usmeritev v svetu zato narekuje medsebojno integracijo tako informacijskih sistemov kakor tudi specializiranih programskih orodij.
V prispevku predstavljam o programsko orodje za analizo pretočno tlačnih razmer v cevnih mrežah, ki smo ga razvili z upoštevanjem omenjenih svetovnih usmeritev. Predstavljeno programsko orodje omogoča vodenje in pregled geografskega, tehničnega in obratovalnega stanja ter vzdrževanja cevnega om režja in deluje v grafičnem okolju AutoCAD-a 12 za MS Windows.
0 INTRODUCTION
Since pipe networks are quite large and can not be managed without computers, they have been designed predominately on the basis o f more or less accurate estimations.
The intensive advancement of engineering science has called for integrated data collection and processing, and for interdisciplinary work. Also suc cessful and productive work in interdisciplinary do mains demands informational connectivity between various fields of engineering at all levels of intersec tion and complementation. As a result, the need has been felt for information systems of a universal de sign, yet offering an adequate base for the specific demands of individual fields of knowledge. Conse quently, the current trend worldwide is towards the integration of information systems and software tools.
In this paper we present a software tool for pressure-flow analyses in pipe networks which has been developed in accordance with the recent trends of the profession worldwide. Our software tool en sures the management of the pipe network and of fers information about the geographic, engineering and operating conditions as well as the maintenance of pipe networks. It works in the graphic environ ment of AutoCAD 12 for MS Windows.
1 TEHNIČNI INFORMACIJSKI SISTEM
Razvoj teh n ik e je tesno povezan s spoznavanjem naravnih zakonitosti, saj se v praksi večina procesov odvija v skladu z njimi. Za uspešno reševanje tehničnih problemov moramo najprej imeti celovit pregled problema in vseh njegovih gradnikov.
1 ENGINEERING INFORMATION SYSTEM
V ta namen je treba problem skupaj z gradniki in z njihovimi lastnostmi ustrezno opisati in definirati. Trenutno so v svetu aktualni geografski informacijski sistemi (GIS), ki omogočajo opis elementov skupaj z dejansko lego v prostoru ter njihovimi prostorskimi soodvisnostmi (topološkimi odnosi). Podoben učinek lahko dosežemo tudi z računalniško konstruiranimi orodji, vendar brez dejanskih topoloških razmer, kar omejuje informacijsko izmenjavo med strokami (npr. med geodetsko in strojno stroko). Bistvo GIS-ov je geokodiranje, kar pomeni, da so podatki opremljeni s koordinatami v resničnem prostoru (kar seveda ni potrebno, vendar običajno gre za resnični prostor) in se lahko uporabijo kot osnova pri opisu prostora in pri prostorskih analizah. G lS-i m nogokrat ne zagotovijo m ožnosti ustrezne nadgradnje za reševanje problem ov s posebnim i tehničnim i zahtevami, so pa s svojimi strukturami primerni kot podatkovna osnova pri interdisciplinarnem delu. Utrezno zgrajeni tehnični informacijski sistemi, ki pomenijo nadgraditev GIS-ov s primernimi tehniško o rien tiran im i program skim i kom ponentam i, omogočijo upravljalcem cevnih omrežij naslednje: - načrtovanje in gradnjo sistemov,
- vodenje in optimizacijo obratovanja,
- vzdrževanje naprav,
- izdelavo dokumentacije omrežja in naprav - digitalni kataster,
- priključevanje in evidenco odjemalcev.
Tehnični inform acijski sistem hrani in obdeluje informacije o tehničnih podatkih in stanju naprav, potrebnih za obratovanje (lega, premer, dolžina, material, leto vgradnje, vrsta armature, način povezave itn). S tem je omogočeno podajanje informacij o vzdrževanju, popravilih, zamenjavah, izdelavi statistike naprav in investicijsko načrtovanje. Sistem na načrtih pomeni le tiste informacije, ki opredeljujejo namen uporabe karte; za planerje, za kataster ali za obratovanje. Na načrtih so poleg osnovnih podatkov in prikaza izvedenega cevnega omrežja predstavljeni tudi rezultati hidravličnih izračunov. Vgrajena numerična modula za analizo pretočno-tlačnih razm er v vročevodni oziroma nizkotlačni plinski cevni mreži omogočata naslednje določitve:
- smeri pretokov v posameznih odsekih cevne mreže,
- masni in prostominski pretok ter hitrost tekočine v odsekih cevne mreže,
- padec tlaka v odsekih,
- tlak v v o zliščih ,
- pretočno-tlačno analizo plinske cevne mreže z eno ali več merilnimi reducirnimi postajami oz. pretočno-tlačno analizo vročevodnega cevnega omrežja z vgrajenimi črpalkami,
- pretočno-tlačno analizo stanja pri delno odprtih lokalnih elementih (ventilih),
- pretočno-tlačno analizo drevesnih, zankastih in kombiniranih cevnih mrež.
problem and its components. For this purpose we need an adequate description and definition of the -problem and its components. At present, geographic information systems are widely used because they ensure the description o f the elements together with their real position in space and their topological re lations. The same can be attained with CAD tools, but without the topological relations, which reduces the exchange of information between different fields of knowledge (i.e. geodesy and mechanical engineer ing). The essential feature of GISs is geocoding, which means that the data are equipped with coordi nates in real space (we usually deal with real space, although not necessarily), and as such they can be used as a basis to describe space in space analyses. Quite often GISs do not provide an adequate super structure for solving problems with special engineer ing requirements, but due to their structures they cer tainly are a suitable basis for data in interdiscipli nary work. Well designed technical information sys tem, which means upgrading of GIS with suitable designed technical-oriented software components, does to pipe network managers ensure:
- planning and building of systems, - control and optimisation of operation, - maintenance of equipment,
- documentation of the network and equipment - digital inventory,
- connection and evidence of consumers.
Our engineering information system stores and processes information about the engineering data and the condition of devices and pipes needed for operation (position, diameter, length, material used, date of installation, type of armature, etc.). In this way it is possible to provide data for the maintenance, repair, replacements, statistics of devices and invest ment planning. The system generates maps which contain only the information dictated by the purpose for which they were made: for planners, inventory or operation. Apart from the basic data and the graphic presentation of the pipe network configura tion, the map also includes the results of hydraulic analyses. The incorporated numerical modules for pressure-flow analyses in hot-water pipe networks and low-pressure gas pipe networks respectively, are used to determine:
- the direction of flows in pipe network sections, - volume and mass flow, and fluid flow rate in pipe
network sections,
- pressure drops in sections, - nodal pressures,
- pressure-flow analyses o f the gas pipe network with one or more measuring and pressure reduc tion stations (MRP) and pressure-flow analyses of the hot water pipe network with incorporated pumps, respectively,
P rogram sko orodje deluje v okolju AutoCAD-a za MS Windows na osebnih združljivih računalnikih, omogoča pa tudi povezavo z GIS sistemi (z GlS-i, ki temeljijo na Arc/Info podatkovni osnovi tako na grafičnem kakor atributnem nivoju, s preostalimi trenutno le na atributnem nivoju), s poslovno-inform acijskim i sistemi in z drugimi znanimi atributnimi bazami tehničnih podatkov, ki so shranjene v enem izmed najpogostejših formatov (dBASE, Paradox, MS Access, FoxPro, Excel, ASCII...) oz. dosegljivi prek SQL strežnikov (Oracle, Interbase ...).
Sistem je v celoti načrtovan in zgrajen objektno usmerjeno v Client/Server arhitekturi. Numerični moduli za določitev pretočno-tlačnih razmer v cevnih mrežah uporabljajo matematične iterativne metode, prilagojene za delo z redkimi matrikami (Sparse Matrix). Vse komponente so odprte navzven tudi za uporabniške prilagoditve in nadgradnje (programiranje).
V programsko orodje je mogoče vključiti num erične m odule, ki om ogočajo obravnavo naslednjih sistemov:
- vodovodni sistemi in sistemi za gašenje požarov, - srednjetlačni in visokotlačni plinski sistemi, - sistemi za prenos nafte,
- sistemi za prenos pregrete in nasičene pare, - sistemi za prenos komprimiranega zraka, - kanalizacijski sistemi,
- dvofazni sistemi,
- transport vseh drugih tekočin v cevnih sistemih, - prehodnostno analizo,
- vključevanje optimizacijskih metod za optimalno načrtovanje in dograjevanje sistemov.
2 NUMERIČNA METODA ZA DOLOČITEV PRETOČNO TLAČNIH RAZMER V CEVNIH
MREŽAH
2.1 Padec tlaka v ceveh
Padec tlaka pri pretoku nestisljive tekočine od vozlišča i do vozlišča j je funkcija linijskih in lokalnih energijskih izgub in ga določimo z Darcy- Weisbachovo enačbo:
/ = 1,2,3,..,N
Za dolo čitev padca tla k a n e stisljiv ih kapljevin obstajajo še druge enačbe: H azen- Williamsonova, Manningova in Gauckler-Manning- Stricklerjeva enačba. Enačba (1) se lahko uporablja tudi za določitev padca tlaka v nizkotlačnih plinskih cevnih mrežah, ker je naj večji dovoljeni padec tlaka od merilno reducirne postaje (MRP) do porabnika 3000 Pa. Stisljivost plinav tem območju padca tlaka je zanemarljivo majhna.
Our software tool runs in the AutoCAD en vironment for MS Windows on PC compatible com puters. In addition, it enables communication with GISs (those based on the Arc/Info database on the graphic as well as the attribute level, and for now only at the attribute level with all other systems), business information systems and all other major at tribute based engineering data bases stored in one of the most current formats (dBASE, Paradox, MS Ac cess, FoxPro, Excel, ASCII, etc.) or accessible via SQL servers (Oracle, Interbase, etc.).
The entire system is object-oriented, de signed and built in the Client/Server architecture. The numerical modules for pressure-flow analyses in hy draulic pipe networks are based on mathematical it erative methods adapted for work with Sparse Ma trices. All components are open for customisation and upgrading (programming).
Numerical modules for the treatment of the following systems can be incorporated into the soft ware tool:
- water supply systems and fire extinguishing sys tems (hoses),
- medium- and high-pressure gas systems, - crude oil pipelines,
- systems for overheated and saturated steam trans port,
- system for compressed air transport, - sewage systems,
- two-phase systems,
- the transport of all other fluids in pipe systems, - the analysis of transients,
- incorporation of optimisation methods for opti mum design and extension of systems.
2 NUMERICAL METHOD FOR DETERMINATION OF THE PRESSURE-FLOW
CONDITIONS IN PIPE NETWORKS
2.1 Pressure drops in pipes
The pressure drop of the incompressible fluid flow from node i to node j is a function o f line and local energy losses defined by the Darcy-Weisbach equation:
j =
1,2,3, ..,N
2.2 Karakteristična krivulja črpalk
Pretočno tlačno karakteristiko črpalke h-qv
določimo z meritvami ali povzamemo iz kataloga proizvajalca črpalk. Matematični zapis ima obliko polinoma:
2.2 The characteristic pump curve
The pressure-flow characteristic of the pump
h-qv is either determined by measurements or taken from the producer’s catalogue. The mathe-matical expression has the form of a polynomial:
(2).
h = A + B- q l
2.3 Numerična metoda LTM 2.3 The numerical LTM method
D oločitev pretočno-tlačnih razm er pri pretoku fluidov kakršni so: nizkotlačni, srednjetlačni in visokotlačni plin, pregreta para, nasičena para, kapljevine in dvofazni tok je mogoča z uporabo različnih numeričnih metod [ 1 ] in [2]. Za vročevodne in nizkotlačne plinske cevne mreže je najprimernejša linearna num erična m etoda (LTM ), s katero nelinearno D arcy-W eisbachovo enačbo (1) lineariziramo po tlaku na naslednji način:
t f v , = I P i
Pri tem je:
Pressure-flow conditions of fluids, such as low-pressure, medium-pressure and high-pressure gas, overheated steam, saturated steam, liquids and two-phase flows can be determined using various nu merical methods [1] and [2], The numerical linear theory method (LTM) is the best method for hot- water and low-pressure gas pipe networks. It is used to linearize the non-linear Darcy-Weisbach equation (1) via pressure in the following way:
1
i
IA
+1iK
P i - P i
Here:( 3 ) .
/ = 1 , 2 , 3 , . . , N 7 = 1 , 2
Reševanje sistema lineariziranih nelinearnih enačb (3) poteka im plicitno, tako da v prvem iteracijskem koraku začetne tlake v vozliščih predpostavimo in jih nato z vsako naslednjo rešitvijo popravljamo, dokler ne zadostimo izbrani relativni natančnosti.
Osnovno načelo algoritma LTM je implicitno reševanje nelinearnega matričnega računa, kjer lahko ugotovimo, da se v matriki število polnih elementov (od nič različnih elementov) v primerjavi s praznimi elem enti, z velikostjo cevne m reže odstotno zmanjšuje (pravimo, daje matrika redka).
■ 3 , . . , N £ = 1 , 2 , 3 , . . , M
The system of linearized nonlinear equations (3) runs implicitly by assuming the initial node pres sures in the first step of iteration and by correcting them in every subsequent solution until the chosen relative accuracy is reached.
The essential principle of the LTM algorithm is the implicit solution of the nonlinear matrix cal culation which shows that the number of full ele ments in the matrix (elements other than zero) de creases by percentage with the size of the pipe net work in comparison with the void elements (the matrix is sparse).
3 PROGRAMSKO ORODJE
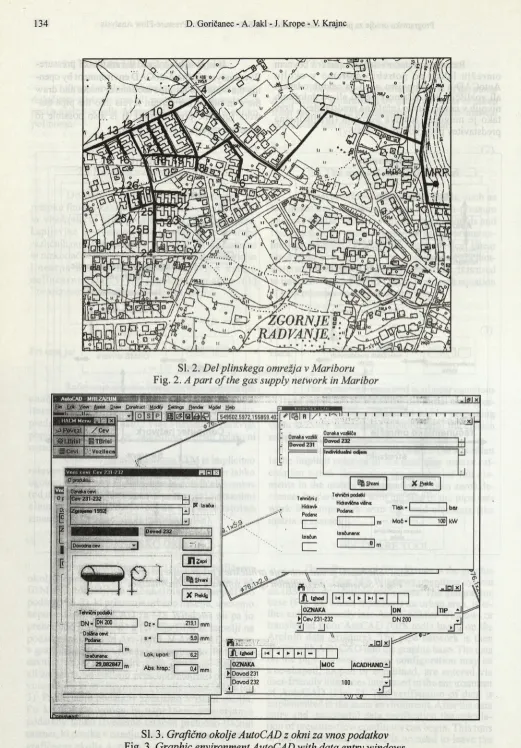
Programsko orodje (sl. 1 ) deluje v grafičnem okolju operacijskega sistem a MS Windows na IBM-PC združljivih računalnikih. G eografsko podlago (sl. 2), ki prikazuje urbano naselje, vnesemo neposredno v AutoCAD za MS Windows ali pa jo prenesemo iz ArcCAD-a (orodja GIS, ki temelji na podatkovni strukturi Arc-Info). V AutoCAD-u nato v grafično podlago vrišemo cevno mrežo. Podatki o cevni mreži, kije lahko drevesna, drevesno - zankasta ali zankasta, se vnašajo prek uporabniško prijaznih vmesnikov, ki so integrirani v okolje AutoCAD-a (sl. 3). Preverjanje podatkov izvajamo v istem okolju. Po končanem vnosu in uspešnem preverjanju podatkov lahko izvedemo izračun pretočno-tlačnih razmer, ki poteka v ozadju, tako da ni treba zapuščati grafičnega okolja AutoCAD-a.
3 SOFTWARE TOOL
Rezultate pretočno-tlačnih razmer v cevnem om režju lahko po potrebi odbiram o v okolju AutoCAD-a z odpiranjem oken na cevnih odsekih ali vozliščih in izrišemo v celoti ali po določenih nivojih v cevno mrežo (grafična predstavitev). Prav tako je mogoča izdelava poročila (preglednična predstavitev podatkov ali rezultatov).
It is possible to read the results of pressure- flow analyses in the AutoCAD environment by open ing the windows for pipe sections or nodes and draw them in full or per certain levels into the pipe net work (graphic presentation). It is also possible to generate reports in tabular form.
Sl. 1. Shematski prikaz notranje arhitekture programskega orodja
Sl. 2. Del plinskega omrežja v Mariboru
Fig. 2. A part o f the gas supply network in Maribor
SI. 3. Grafično okolje AutoCAD z okni za vnos podatkov
4 SKLEP
Programsko orodje za določitev pretočno tlačnih razmer v vročevodnih oziroma nizkotlačnih plinskih cevnih mrežah [4] in [5], kar je bil naš izhodiščni cilj, je plod sodelovanja strokovnjakov različnih tehničnih strok in je v celoti izdelano v objektni tehnologiji programiranja [3] v 16-bitni (za MS Windows 3.1 dalje) in v 32-bitni različici (za MS Windows 95 in NT).
Ker je cena GIS-ov in njihovega uvajanja zelo visoka, smo s tovrstnimi programskimi orodji zagotovili povezavo preko baz podatkov (sl. 1). Za izvajanje našega programskega orodja zadostuje že grafično okolje AutoCAD-a 12 za MS Windows.
4 CONCLUSION
The presented software tool for determin ing pressure-flow conditions in hot water or low-pres sure gas pipe networks [4] and [5] is the result be tween cooperation of experts in various branches of engineering. It was made entirely with the object- oriented programming technology [3] in the 16-bit (for MS Windows 3.1 and onwards) and 32-bit ver sion (for MS Windows 95 and NT).
Since GIS software and their introduction are very expensive, we assured connectivity (Fig. 1) with them via databases. In addition, the graphic en vironment AutoCAD 12 for MS Windows suffices for the implementation of our software tool.
5 POMEN OZNAČB
5 NOTATION
konstante A, B constants
premer cevi d m pipe diameter
hidravlična višina h m hydraulic height
koeficient Darcy-Weisbachov enačbe K coefficient of Darcy-Weisbach’s equation
dolžina cevi / m pipe length
številnost vozlišč N the number of nodes številnost iteraci] M the number of iterations
tlak P Pa pressure
prostominski pretok <7v m3/s volume flow
koeficient trenja X coefficient of friction
gostota P kg/m3 density
6 LITERATURA 6 REFERENCES
[1] Krope J., Goričanec D.: Analysis o f Pipe Networks Including Pumps, Energy and Buildings, Lausanne 17,1991, pp. 141-145.
[2] Goričanec D., Krope J.: Hydraulics Analysis o f Overhead Steam Transport. Proceedings o f the Sixth Asian Con gress o f Fluid Mechanics, Singapore, May 22-26 1995, pp. 1352-1355.
[3] Jaki A., Krašna M., Goričanec D.: Izkušnje z objektnimi jeziki pri razvoju tehniških aplikacij. OTS’96 Objektna tehnologija v Sloveniji, Zbornik strokovnega srečanja, Maribor, 19. - 20. junij 1996, str. 182-189.
[4] Goričanec D., Krope J., Jaki A., Krajnc V , Lavrenčič J.: Računalniška aplikacija za računanje pretočno-tlačnih razmer v vročevodnih transmisijskih sistemih, Zbornik prvega mednarodnega kongresa SITHOK-1, Maribor, 14. do 15. maj 1996, str. 153-158.
[5] Goričanec D., Krope J., Pristovnik A., Jaki A., Krajnc V , Mirt S., Grapulin B.: Uporaba CAD sistema za računanje razmer v plinskih transmisijskih sistemih, Zbornik prvega mednarodnega kongresa SITHOK-1, Maribor, 14. - 15. maj 1996, str. 129-134.
Naslovi avtorjev: doc. dr. Darko Goričanec, dipl. inž. prof. dr. Jurij Krope, dipl. inž. Fakulteta za kemijo in kemijsko tehnologijo
Univerze v Mariboru Smetanova 17 2000 Maribor
Andrej Jaki
mag. Viktor Krajnc, dipl. inž. Fakulteta za elektrotehniko, računalništvo in informatiko Univerze v Mariboru Smetanova 17 2000 Maribor
Authors’ Addresses: Doc. Dr. Darko Goričanec, Dipl. Ing. Prof. Dr. Jurij Krope, Dipl. Ing. Faculty o f Chemistry and Chemical Technology
University o f Maribor Smetanova 17
2000 Maribor, Slovenia
Andrej Jaki
Mag. Viktor Krajnc, Dipl. Ing. Faculty o f Electrical Engineering, Computer Science and Information Technology
University o f Maribor Smetanova 17
2000 Maribor, Slovenia
Prejeto: