Research Article
Introduction
S
esame (Sesamum indicum L.) belongs to familyPedaliaceae, is an annual plant. Genetic diversity of crops has a fundamental role for sustainable development of crop varieties. Improvement in crop varieties is only possible when information on genetic diversity is available. It helps to monitor the germplasm and can also predict possible genetic gains. It is also essential for selection of parents that can be used in plant breeding programs. Genetic diversity is determined by using various methods
such as morphological, biochemical and molecular markers (Sharma et al., 2014). Agro-morphological traits have been a primary tool to estimate genetic diversity among genotypes. Several studies based on morphological markers had found a high genetic diversity in sesame populations (Bedigian and Harlan, 1986; Bisht et al., 1998; Arriel et al., 2007). Pham et al. (2011) studied genetic diversity of 17 varieties of sesame from different sources including El Salvador, Tanzania, Kenya, India, Cambodia and Vietnam and reported that varieties from Cambodia and Vietnam were high yielding and could be used as parents for Abstract | The experiment comprised 98 local sesame genotypes including a standard cultivar (TS-3), was conducted during the Kharif seasons of 2011 and 2012 in the research fields of Oilseeds Research Program, Crop Sciences Institute, National Agricultural Research Center, Islamabad, Pakistan. Data were recorded on days to flower initiation, days to flower completion, reproductive period, days to maturity, pod filling period, plant height (cm), number of branches per plant, number of pods per plant, seed yield (kg/ha). Seed yield ranged from 352 to 878 kg/ha with a mean value of 521 kg/ha. A total of forty genotypes produced more seed yield than standard cultivar (517 kg/ha) with a range of 524 to 878 kg/ha. Maximum variation was showed by pods per plant, seed yield, branches per plant, pod filling period and plant height. Dendrogram based on Euclidean distance coefficient, using 9 quantitative traits, grouped 98 sesame genotypes in to 6 lin-eages and 29 clusters. Cluster 25 had the maximum number of genotypes i.e. 18 followed by Cluster 23 (14 genotypes), 19 (12 genotypes) and 9 (9 genotypes). There was a wide range of genetic diversity in this set of sesame germplasm which could be utilized for crop improvement. It is further recommended that for making improvement in sesame crop, identified superior sesame lines viz. SG-115, SG-103, SG-78, SG-79, SG-31, SG-117, SG-108, SG-41 and SG-1 could be used in breeding program and further by making selections in segregating generations. This will help to increase sesame crop yield in the country.
Mubashir Ahmad Khan*, Nazakat Nawaz, Muhammad Arshad, Muhammad Ayub Khan, Tahira, Doulat Baig, Ihsan Ullah Khan and Shamim ul Sibtain Shah
National Agricultural Research Centre, Islamabad, Pakistan.
Received | August 23, 2017; Accepted | November 27, 2018; Published | January 15, 2019
*Correspondence | Mubashir Ahmad Khan, National Agricultural Research Centre, Islamabad, Pakistan; Email: mak1584@hotmail.com
Citation | Khan, M.A., N. Nawaz, M. Arshad, M.A. Khan, Tahira, D. Baig, I.U. Khan and S.S. Shah. 2019. Study of genetic diversity in Pakistani germplasm of sesame (Sesamum indicum L.). Pakistan Journal of Agricultural Research, 32(1): 115-123.
DOI | http://dx.doi.org/10.17582/journal.pjar/2019/32.1.115.123
Keywords | Sesamum indicum, Sesame, Germplasm, Genetic diversity, Cluster analysis, Dendrogram, Pakistan
developing promising genotypes.
Akbar et al. (2011) grouped 105 sesame indigenous entries of Pakistan into seven clusters based on 16 characters. They further reported that entries were mainly placed to different clusters due to their morphological differences and not associated with the geographical distribution. Bandila et al. (2011) collected 60 accessions from different parts of the India and determined the level of diversity in relation to geographical origins and morphological characteristics. They reported that genetic divergence was not related to geographical differentiation as shown by the distribution pattern of genotypes in different clusters. Begum et al. (2011) evaluated 50 genotypes of sesame for genetic diversity and grouped them into five clusters. Cluster IV had maximum genotypes i.e. 14 and Cluster III had minimum genotypes i.e. 4. They reported that Clusters I and II showed highest inter-cluster distances which should be preferred for selecting parents for hybridization resulting in producing new recombination with acceptable characters whereas for earliness selections could be made from cluster III. Parsaeian et al. (2011) grouped 24 genotypes of sesame into 5 clusters and identified 2 clusters having genotypes with sufficient variation and desirable characters which would be suitable for variety development through hybridization.
Menzir (2012) studied 64 accessions of sesame and grouped them into nine clusters showing that sufficient diversity was present in the accessions. Perera and Pushpakumara (2014) evaluated 43 accessions of sesame for quantitative characteristics and grouped them in to five clusters. Baraki et al. (2015) tested thirteen sesame genotypes and grouped them in to four clusters on basis of their seed yield. Tripathy et al. (2016) assessed genetic diversity in 12 sesame genotypes based on 14 agro-economic traits including seed yield and differentiated the tested genotypes into six genotypic groups.
National average of sesame crop in the country is very low 405 kg/ha (GoP, 2015-16) which has to be increased by development of high yielding cultivars. This can be achieved by evaluating available sesame germplasm and accessing genetic diversity. This will help to identify superior sesame lines with target traits and can be utilized in breeding program for the improvement of sesame crop. So the present
study was planned to access the genetic diversity of available Pakistani sesame germplasm and to identify promising parents with target traits which could be used in breeding program for the improvement of crop.
Materials and Methods
Available 98 local sesame genotypes including a check TS-3 (a standard cultivar for Punjab Province and Federal Area Islamabad) were used in the trial. These genotypes had wide variations for days to flower initiation, days to flower completion, reproductive period, days to maturity, pod filling period, plant height, number of branches per plant, number of pods per plant and seed yield. The experiment was conducted during the Kharif seasons of 2011 and 2012 in the research fields of Oilseeds Research Program, Crop Sciences Institute, National Agricultural Research Center, Islamabad, Pakistan. The climate data of Islamabad is presented in Table 1 showing mean daily minimum temperature, mean daily maximum temperature and mean total rainfall for 12 months over a period of 30 years. January is the coldest month and June is the hottest month whereas maximum rainfall is received in the months of August and July. Each accession was sown in a row of 5m length 45cm apart with a plant to plant distance of 10cm. The lines with target traits such as early in flowering and maturity, longer reproductive and pod filling period, more height, more number of branches and pods and high yield would be selected. Data recorded on traits was subjected to MS-Excel software to calculate mean, minimum and maximum values, variance, standard deviation (SD), standard error (SE) and coefficient of variation (CV%) for each trait. Box and Whisker Plots were constructed by using Statistix Version 8.1 software. Performed cluster analysis, developed by Sneath and Sokal (1973), using Statistica Version 6 software to construct dendrogram.
Results and Discussion
days) with a range of 76 to 80 days. Reproductive period had mean value of 31 days with minimum and maximum values of 28 and 36 days respectively. Thirty-three genotypes had longer reproductive period than standard cultivar (31) ranging from 32 to 36 days. Days to maturity ranged from 107 to 114 days with a mean value of 111 days. Standard cultivar matured in 114 days and 92 entries were earlier and took 107-113 days to mature. Remaining entries took same days to mature as that of standard cultivar. Mean value for pod filling period was 30 days having a range of 21 to 37 days. Eleven entries were better than standard cultivar (33 days) with pod filling period range of 34 to 37 days.
Table 1: Mean daily minimum temperature, mean daily maximum temperature and mean total rainfall for 12 months over a period of 30 years of Islamabad.
Month Mean Daily
Minimum Tem-perature (oC)
Mean Daily Maximum Tem-perature (oC)
Mean To-tal Railfall (mm)
January 3.2 17.9 56.2
February 6.0 19.8 83.7
March 10.7 24.5 92.0
April 15.8 30.5 63.5
May 20.7 36.0 35.4
June 23.8 38.4 75.4
July 24.4 35.3 311.1
August 23.8 33.7 337.5
September 21.1 33.7 109.2
October 14.5 30.9 31.7
November 8.3 25.9 14.5
December 4.3 20.2 36.4
Source: World Meterological Orginzation (https://worldweather. wmo.int/en/city.html?cityId=223).
Maximum and minimum values for plant height were 162 and 115 cm respectively with mean of 143 cm. Twenty-one accessions were dwarf than standard cultivar (137 cm) with a range of 115 to 136 cm. Number of branches ranged from 2.7 to 8.4 and having mean value of 5.1. Standard cultivar possessed 4.4 branches per plant and seventy-four genotypes were better with a range of 4.5 to 8.4 branches per plant. Mean value of number of pods per plant was 79 having a range of 37 to 136 pods per plant. Twenty-two entries were better than standard cultivar (92 pods) showing a range of 93 to 136 pods per plant. Seed yield ranged from 352 to 878 kg/ha with a mean value of 521 kg/ha. A total of forty genotypes
produced more seed yield than standard cultivar (517 kg/ha) with a range of 524 to 878 kg/ha. All the accessions which performed better than the standard cultivar (TS-3) would have better combination of genes. Furthermore, the better combination of genes in these cultivars helped in better response to environment hence, resulting in better performance compared to standard cultivar.
Maximum variation was showed by pods per plant, seed yield, branches per plant, pod filling period and plant height with coefficient of variation (CV) values of 25.96, 23.86, 18.90, 9.00, and 5.51%, respectively accompanied with high values of variance and standard deviation indicating existence of diversity in the accessions for
these traits (Table 2). Remaining traits showed less
amount of variation as had low values of CV (1.05-4.96%). Number of researchers found wide range of genetic diversity in sesame crop and some of them are
Akbar et al. (2011), Bandila et al. (2011), Begum et al. (2011), Pham et al. (2011), Menzir (2012), Perera and Pushpakumara (2014) and Baraki et al. (2015).
Figure 1: Box and whisker plot for days to flower initiation.
Figure 2: Box and whisker plot for days to flower completion.
shown in Box and Whisker Plots (Figure 1, 2, 3, 4, 5, 6, 7, 8 and 9). Lines within boxes indicate median value, box limits indicate interquartile range (i.e., 50% of values lie within the box), whiskers indicate highest and lowest, excluding outliers (*, 1.5-3 × box length distance away from edge of box) or extremes (O, >3 × box length). These plots also showed the presence of wide range of genetic diversity in this set of sesame germplasm.
Figure 3: Box and whisker plot for reproductive period.
Figure 4: Box and whisker plot for days to maturity.
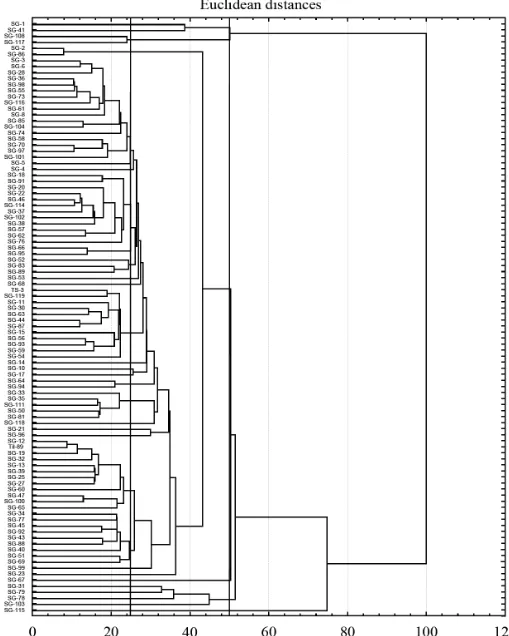
Dendrogram was constructed by performing cluster analysis and it revealed the minimum clusters distances and the degree of morphological relationships between the pairs of genotypes within each cluster group. Dendrogram based on Euclidean distance coefficient, using 9 quantitative traits, grouped 98 sesame genotypes in to 6 lineages and 29 clusters (Figure 10). The number and names of genotypes grouped in an individual cluster are given in Table 3. Table 4 presents the mean values of each character in cluster. The first lineage is consisted of one cluster accumulating only 1 genotype. Accession was characterized by tall plant
height, less pods per plant, more branches, high seed yield, late flowering and maturity. Second lineage is consisted of four Clusters (2, 3, 4 and 5) each having single genotype. These clusters have accessions with taller plants, more pods and branches per plant, high seed yield, late flowering and maturity. Third lineage is consisted of one Cluster (6) having single genotype. This cluster has genotype with tall plants, less pods and branches per plant, low seed yield, late flowering and maturity.
Figure 5: Box and whisker plot for pod filling period.
Figure 6: Box and whisker plot for plant height (cm).
Table 2: Performance of 98 sesame germplasm genotypes for 9 characters.
Statistics DFI DFC RP DM PFP PH BR PP SY
Mean 50 81 31 111 30 143 5.1 79 521
Min 46 76 28 107 21 115 2.7 37 352
Max 58 88 36 114 37 162 8.4 136 878
Variance 4.12 6.82 2.33 1.36 7.51 61.91 0.93 418.18 15436.3
SD 2.03 2.61 1.53 1.17 2.74 7.87 0.96 20.45 124.24
SE 0.20 0.26 0.15 0.12 0.28 0.79 0.10 2.07 12.55
CV% 4.05 3.23 4.96 1.05 9.00 5.51 18.90 25.96 23.86
TS-3 (C) 50 81 31 114 33 137 4.4 92 517
Entries better than TS-3 33 50 33 92 11 21 74 22 40
Range of better entries 46-49 76-80 32-36 107-113 34-37 115-136 4.5-8.4 93-136 524-878
DFI: Days to Flower Initiation; DFC: Days to Flower Completion; RP: Reproductive Period; DM: Days to Maturity; PFP: Pod Filling Period; PH: Plant Height (cm); BR: Number of Branches per plant; PP: Number of pods per plant and SY: Seed yield (kg/ha).
Table 3: Sesame germplasm genotypes in different clusters.
Lineage Cluster Number of Genotypes Names of Genotypes
I Cluster-1 1 SG-115
II Cluster-2 1 SG-103
Cluster-3 1 SG-78
Cluster-4 1 SG-79
Cluster-5 1 SG-31
III Cluster-6 1 SG-67
IV Cluster-7 1 SG-23
Cluster-8 1 SG-99
Cluster-9 9 SG-69, SG-51, SG-40, SG-88, SG-43, SG-92, SG-45, SG-77, SG-34 Cluster-10 12 SG-65, SG-100, SG-47, SG-60, SG-27, SG-25, SG-39, SG-13, SG-32,
SG-19, Til-89, SG-12
Cluster-11 1 SG-96
Cluster-12 1 SG-21
Cluster-13 1 SG-118
Cluster-14 5 SG-81, SG-50, SG-111, SG-35, SG-33
Cluster-15 2 SG-94, SG-64
Cluster-16 1 SG-17
Cluster-17 1 SG-10
Cluster-18 1 SG-14
Cluster-19 12 SG-54, SG-59, SG-93, SG-56, SG-15, SG-87, SG-44, SG-63, SG-30, SG-11, SG-119, TS-3
Cluster-20 1 SG-68
Cluster-21 1 SG-53
Cluster-22 3 SG-89, SG-83, SG-52
Cluster-23 14 SG-95, SG-66, SG-76, SG-62, SG-57, SG-38, SG-102, SG-37, SG-114, SG-46, SG-22, SG-20, SG-91, SG-18
Cluster-24 1 SG-4
Cluster-25 18 SG-5, SG-101, SG-97, SG-70, SG-58, SG-74, SG-104, SG-85, SG-8, SG-61, SG-116, SG-73, SG-55, SG-98, SG-36, SG-28, SG-6, SG-3
Cluster-26 2 SG-86, SG-2
V Cluster-27 2 SG-117, SG-108
VI Cluster-28 1 SG-41
Figure 8: Box and whisker plot for number of pods per plant. Figure 9: Box and whisker plot for seed yield (kg/ha).
Table 4: Cluster means for 9 characters of 98 genotypes of sesame germplasm.
Characters DFI DFC RP DM PFP PH BR PP SY
Cluster-1 55 86 31 112 26 136 5.5 38 806
Cluster-2 50 81 32 113 32 149 4.7 74 714
Cluster-3 52 87 36 113 26 138 4.4 61 744
Cluster-4 50 83 33 112 29 147 6.4 86 746
Cluster-5 49 79 30 112 33 149 5.4 75 767
Cluster-6 58 88 31 109 21 115 3.5 37 397
Cluster-7 49 79 31 111 32 136 4.7 87 660
Cluster-8 51 81 30 112 31 132 4.0 53 643
Cluster-9 50 81 31 112 31 146 4.5 62 625
Cluster-10 51 81 30 112 31 144 4.8 75 575
Cluster-11 54 85 32 109 24 152 8.4 118 369
Cluster-12 50 81 31 111 30 138 7.0 133 371
Cluster-13 52 83 32 112 29 122 3.2 60 354
Cluster-14 50 81 32 111 30 145 5.4 79 357
Cluster-15 49 79 30 110 32 130 3.4 48 542
Cluster-16 51 80 29 110 30 148 6.0 106 446
Cluster-17 50 80 30 112 32 143 5.9 123 440
Cluster-18 53 84 31 111 27 162 5.7 87 460
Cluster-19 50 80 30 111 31 146 4.9 76 512
Cluster-20 49 79 31 111 32 145 6.3 109 389
Cluster-21 48 78 31 111 33 157 5.5 68 424
Cluster-22 49 81 32 111 29 149 4.7 56 444
Cluster-23 50 82 31 111 29 141 5.0 83 408
Cluster-24 51 82 32 111 29 142 5.9 112 492
Cluster-25 49 80 31 111 31 140 5.2 80 467
Cluster-26 48 79 31 111 33 147 6.7 102 687
Cluster-27 49 79 30 112 33 142 5.7 95 860
Cluster-28 51 80 29 112 32 151 7.0 136 856
Cluster-29 46 77 32 113 36 135 6.4 133 878
Figure 10: Dendrogram on the basis of 9 characters of 98 genotypes of sesame germplasm.
Fourth lineage is consisted of twenty Clusters namely 7 (1 genotype), 8 (1 genotype), 9 (9 genotypes), 10 (12 genotypes), 11 (1 genotype), 12 (1 genotype), 13 (1 genotype), 14 (5 genotypes), 15 (2 genotypes), 16
have genotypes with tall to very tall plants, more pods and branches per plant, low to medium seed yield, late flowering and maturity. Fifth lineage consisted of single cluster 27 having 2 genotypes which were characterized by very tall plants, more pods and branches per plant, high seed yield, late flowering and maturity. Sixth lineage consisted of two clusters (28 and 29) each having single genotypes and characterized by very tall plants, more pods and branches per plant, high seed yield, late flowering and maturity. High yielding sesame varieties could be developed by the utilization of best performing genotypes of Clusters 1, 2, 3, 4 and 5 (SG-115, SG-103, SG-78, SG-79 and SG-31) in hybridization program by crossing with genotypes of Clusters 27, 28 and 29 (117, 108, SG-41 and SG-1) and further selection in segregating generations. These lines which were selected because these had target traits such as early in flowering and maturity, longer reproductive and pod filling period, more height, more number of branches and pods and high yield. These identified superior sesame lines performed better than rest of the available germplasm in the prevalent climatic conditions of Islamabad. This showed that these genotypes had better combination of favourable genes in them as compared to the remaining lines which might had combination of poor and less performing genes. Therefore, these lines with desirable combination of genes could be included in the breeding program for development of high yielding cultivars for increase in yield of sesame crop in the country.
Pham et al. (2011) reported that high yielding sesame varieties could be used as parents for developing promising genotypes. Akbar et al. (2011) grouped 105 sesame indigenous entries of Pakistan into 7 clusters. Begum et al. (2011) grouped 50 genotypes of sesame into 5 clusters and reported that Clusters I and II should be preferred for selecting parents for hybridization resulting in producing new recombination with acceptable characters whereas for earliness selections could be made from cluster III. Parsaeian et al. (2011) grouped 24 genotypes of sesame into 5 clusters and identified 2 clusters having genotypes with sufficient variation and desirable characters which would be suitable for variety development through hybridization. Menzir (2012) grouped 64 accessions of sesame into 9 clusters showing that sufficient diversity was present in the accessions. Perera and Pushpakumara (2014) grouped 43 accessions of sesame in to 5 clusters. Baraki et al.
(2015) grouped 13 sesame genotypes in to 4 clusters on basis of their seed yield. Tripathy et al. (2016) assessed genetic diversity in 12 sesame genotypes based on 14 agro-economic traits including seed yield and differentiated the tested genotypes into six genotypic groups.
There was a wide range of genetic diversity in this set of sesame germplasm which could be utilized for crop improvement. It is further recommended that for making improvement in sesame crop, identified superior sesame lines viz. SG-115, SG-103, SG-78, SG-79, SG-31, SG-117, SG-108, SG-41 and SG-1 could be used in breeding program and further by making selections in segregating generations. This will help to increase sesame crop yield in the country.
Author’s Contribution
Mubashir Ahmad Khan conceived the idea, overall management of the article and results and discussion; Nazakat Nawaz wrote abstract, introduction and references; Muhammad Arshad methodology; Muhammad Ayub Khan technical input at every step; Tahira did analysis; Doulat Baig data collection and data entry; Ihsan Ullah Khan did analysis and conclusion; Shamim ul Sibtain Shah data collection.
References
Akbar, F., M.A. Rabbani, Z.K. Shinwari and S.J. Khan. 2011. Genetic divergence in sesame (Sesamum indicum L.) landraces based on qualitative and quantitative traits. Pak. J. Bot. 43(6): 2737-2744.
Arriel, N.H.C., A.O.D. Mauro, E.F. Arrie, S.H.U. Trevisoli, M.M. Costa, I.M. Barbaro and F.R.S. Muniz. 2007. Genetic divergence in sesame based on morphological and agronomic traits. Crop Breeding Appl. Biotechnol. 7: 253-261. https://doi.org/10.12702/1984-7033. v07n03a04
Bandila, S., A. Ghanta, S. Natrajan and S. Subramoniam. 2011. Determination of genetic variation in Indian sesame (Sesamum indicum) genotypes for agro-morphological traits. J. Res. Agric. Sci. 7(2): 88-99.
Baraki, F., Y. Tsehaye and F. Abay. 2015. Grain yield based cluster analysis and correlation of agronomic traits of sesame (Sesamum indicum
11-17.
Bedigian, D. and J.R. Harlan. 1986. Evidence for cultivation of sesame in the ancient world. Econ. Bot. 40(2): 137-154. https://doi.org/10.1007/ BF02859136
Begum, S., M.A. Islam, A. Husna, T.B. Hafiz and M. Ratna. 2011. Genetic diversity analysis in sesame (S. Indicum L.). SAARC J. Agric. 9 (2): 65-71.
Bisht, I.S., R.K. Mahajan, T.R. Loknathan and R.C. Agrawal. 1998. Diversity in Indian sesame collection and stratification of germplasm accessions in different diversity groups. Genet. Resour. Crop Evol. 45(4): 325-335. https://doi. org/10.1023/A:1008652420477
GoP, 2015-16. Agricultural Statistics of Pakistan, Ministry of National Food Security and Research, Economic Wing, Islamabad – Pakistan.
Menzir, A. 2012. Phenotypic variability, divergence analysis and heritability of characters in sesame (Sesamum indicum L.) genotypes. Nat. Sci. 10(10): 117-126.
Parsaeian, M., A. Mirlohi and G. Saeidi. 2011. Study of genetic variation in sesame (Sesamum indicum L.) using agro-morphological traits and ISSR markers. Russ. J. Genet. 47(3): 314-321.
https://doi.org/10.1134/S1022795411030136 Pham, T.D., M. Geleta, T.M. Bui, T.C. Bui, A.
Merker and A.S. Carlsson. 2011. Comparative analysis of genetic diversity of sesame (Sesamum indicum L.) from Vietnam and Cambodia using agro-morphological and molecular markers. Hereditas 148: 28–35. https://doi.org/10.1111/ j.1601-5223.2010.02196.x
Perera, U.I.P. and R.W. Pushpakumara. 2014. Multivariate analysis of some sesame (Sesamum indicum L.) accessions based on quantitative characteristics. J. Agric. Search. 1(4): 201-205. Sharma, E., T.I. Shah and F. Khan. 2014. A review
enlightening genetic divergence in Sesamum indicum based on morphological and molecular studies. Int. J. Agric. Crop Sci. (Available online: www.ijagcs.com IJACS/2014/7-1/1-9)
Sneath, P.H.A. and R.P. Sokal. 1973. Numerical taxonomy: The principles and practice of numerical classification. San Francisco W.H. Freeman. p. 573.