https://doi.org/10.5194/gmd-11-3537-2018 © Author(s) 2018. This work is distributed under the Creative Commons Attribution 4.0 License.
A global scavenging and circulation ocean model of thorium-230
and protactinium-231 with improved particle dynamics
(NEMO–ProThorP 0.1)
Marco van Hulten1,2, Jean-Claude Dutay1, and Matthieu Roy-Barman1
1Laboratoire des Sciences du Climat et de l’Environnement, IPSL, CEA–Orme des Merisiers, 91191 Gif-sur-Yvette, France 2Geophysical Institute, University of Bergen, Bergen, Norway
Correspondence:Marco van Hulten ([email protected]) Received: 1 November 2017 – Discussion started: 8 December 2017
Revised: 16 August 2018 – Accepted: 20 August 2018 – Published: 31 August 2018
Abstract.In this paper we set forth a 3-D ocean model of the radioactive trace isotopes230Th and231Pa. The interest arises from the fact that these isotopes are extensively used for in-vestigating particle transport in the ocean and reconstructing past ocean circulation. The tracers are reversibly scavenged by biogenic and lithogenic particles.
Our simulations of 230Th and 231Pa are based on the NEMO–PISCES ocean biogeochemistry general circulation model, which includes biogenic particles, namely small and big particulate organic carbon, calcium carbonate and bio-genic silica. Small and big lithobio-genic particles from dust de-position are included in our model as well. Their distributions generally compare well with the small and big lithogenic par-ticle concentrations from recent observations from the GEO-TRACES programme, except for boundary nepheloid layers for which, as of today, there are no non-trivial prognostic models available on a global scale. Our simulations repro-duce230Th and231Pa dissolved concentrations: they compare well with recent GEOTRACES observations in many parts of the ocean. Particulate230Th and231Pa concentrations are sig-nificantly improved compared to previous studies, but they are still too low because of missing particles from nepheloid layers. Our simulation reproduces the main characteristics of the231Pa/230Th ratio observed in the sediments and supports a moderate affinity of231Pa to biogenic silica as suggested by recent observations relative to230Th.
Future model development may further improve under-standing, especially when this will include a more com-plete representation of all particles, including different size classes, manganese hydroxides and nepheloid layers. This
can be done based on our model as its source code is readily available.
1 Introduction
Oceanic circulation and the carbon cycle play a major role in the regulation of the past and present climate. Heat and carbon dioxide in the atmosphere tend to equilibrate with the ocean surface and are transported down into the deep ocean through the Meridional Overturning Circulation (MOC). Biogeochemical cycling also generates organic carbon that transfers into the deep ocean through particle sinking. Be-cause of this, the strength of the MOC and particle removal participate actively in the regulation of the climate on the Earth.
iso-tope ratio143Nd/144Nd (Piotrowski et al., 2005). These prox-ies are affected by dynamical and biogeochemical processes. Including these proxies in a climate model is a way to better understand the climatic signal they register.
We will focus on230Th and231Pa because these isotopes are well documented by the international GEOTRACES pro-gramme, and they are particularly suitable to study the trans-fer of particulate matter since the isotopes’ source in the ocean is perfectly known: radioactive decay of uranium iso-topes. Others have modelled 143Nd and 144Nd (Arsouze et al., 2008, 2009; Ayache et al., 2016),13C (Tagliabue et al., 2009), and 14C (Mouchet, 2013). The ratio between 230Th and231Pa is used as a proxy for past ocean conditions, but this signal is potentially affected by both circulation and bio-geochemical changes. Therefore, a correct understanding of the scavenging and underlying particle dynamics is essential in order to better simulate these tracers (Dutay et al., 2015).
Protactinium-231 and thorium-230 are produced in the ocean by theαdecay of uranium-235 and uranium-234, re-spectively. Because the activity of uranium is approximately uniform in the ocean,231Pa and230Th are produced at a rel-atively constant rate (βPa=2.33×10⁻³dpm m−3yr−1 and βTh=2.52×10⁻²dpm m−3yr−1; dpm: disintegrations per minute) (Henderson and Anderson, 2003). They are both scavenged rapidly by the many particles that reside in the ocean and settle towards the sea floor.231Pa is less sensitive to particle scavenging than 230Th, which is reflected in the longer residence time of231Pa (80–200 yr) compared to that of 230Th (20–40 yr) (Yu et al., 1996). 231Pa and 230Th are radioactive, decaying to radium isotopes and having a half-life of 32.76 and 75.40 kyr, respectively. Each combination of particle–radionuclide adsorption has a different reactiv-ity. Other factors may affect the adsorption of radionuclides onto particles. For example, smaller particles have larger sur-face area to volume ratios, which results in an increase in the number of these radionuclides adsorbed per particle. Ad-ditionally, while the adsorption rate is expected to increase with particle concentration, the adsorption rate may be partly limited by the coagulation of non-filtered particles (or col-loids) to filtered particles (Honeyman et al., 1988; Honeyman and Santschi, 1988). The vertical distributions of natural ra-dionuclides, such as230Th and231Pa, are hence sensitive to the distribution and mixture of particles. As a consequence of the different particle reactivities of 230Th and231Pa, the dissolved concentration ratio231Pa/230Th deviates from the production activity ratio of 0.093 (Anderson et al., 1983; An-derson, 2003; Rutgers van der Loeff et al., 2016).
As both particle dynamics and circulation of the ocean affect 230Th and 231Pa, numerical biogeochemical general circulation models are used to study the relative contribu-tion of these mechanisms. The isotopes have been simulated in models of intermediate complexity, for instance by Hen-derson et al. (1999) (LSG-OGCM), Marchal et al. (2000) (EMIC 2.5D), Heinze et al. (2006, 2018) (HAMOCC) and Luo et al. (2010). More complex ocean general
circula-tion models have also been used to simulate these tracers, namely by Dutay et al. (2009) (NEMO–PISCES), Siddall et al. (2007), Rempfer et al. (2017) (Bern3D), and Gu and Liu (2017) (CESM). Dutay et al. (2009) demonstrated that the particle concentration simulated by the PISCES model in the deep ocean was too low by a factor of 2 in the mesopelagic zone to 50 in the deepest ocean. This led to overestimated radionuclide concentrations in the deep ocean. Therefore, it is crucial to improve the representation of the particles (Du-tay et al., 2009). Rempfer et al. (2017) showed that taking into account additional sinks at the sea floor and at the ocean margins yields an improved agreement with observations, es-pecially for the dissolved phases of230Th and231Pa. Partic-ulate ratios improved to a lesser extent; the authors have not presented an evaluation of their simulated particulate concen-trations. Gu and Liu (2017) had similar goals as this study.
In this study, we try to improve on previous studies that simulate the distribution of230Th and 231Pa. Our approach is to improve the mechanistic description of the particle and radionuclide cycling, as well as on the side of system de-sign and reusability of the model. We evaluate how well the model fits with observations, but tuning is not one of our main goals. Just like Dutay et al. (2009), we use the NEMO– OPA (Nucleus for European Modelling of the Ocean – Océan PAralelisé) ocean general circulation model (Madec and the NEMO team, 2016) and the PISCES biogeochemical model (Aumont et al., 2015). Aumont et al. (2017) showed that dis-solution rates of particulate organic carbon (POC) in PISCES were overestimated, and they improved on this by introduc-ing a spectrum of different labilities. This improved the simu-lation of both small and big POC significantly, so we use this same model for our simulations. There are several improve-ments since Dutay et al. (2009); namely, the new model
– includes lithogenic particles from dust deposition; – has improved the biogeochemistry, affecting the
bio-genic particle distributions (Aumont et al., 2015; Au-mont et al., 2017);
– includes three different phases per nuclide (dissolved, and adsorbed onto big (and small) particles), whereas Dutay et al. (2009) include only a single compart-ment (total concentration) for each nuclide from which they calculated the respective phases based on chemical equilibrium;
– is more precise and explicit on the mathematical formal-ism;
– is written in Fortran 95 instead of Fortran 77, making the extension of its use to other modern Fortran models easier; and
The main objective of this paper is to improve on the simula-tion of230Th and231Pa (the dissolved phase and two partic-ulate size classes of particles for both nuclides) based on an improved modelling of small and big particles.
New observations are available from the GEOTRACES programme. Especially the North Atlantic GA03 transects will be used for model validation because on this transect not only dissolved230Th and231Pa have been measured (Hayes et al., 2015a), but also their adsorbed forms (Hayes et al., 2015b) and biogenic and lithogenic particle concentrations in two size classes (Lam et al., 2015).
2 Model description
In order to simulate the biogenic particle dynamics and their interaction with the230Th and231Pa trace isotopes, we use the biogeochemical circulation model NEMO–PISCES (Madec, 2008; Aumont et al., 2015). This model has been employed for many other studies concerning trace metals, as well as large-scale ocean biogeochemistry (e.g. Gehlen et al., 2007; Arsouze et al., 2009; Dutay et al., 2009; Tagliabue et al., 2010; van Hulten et al., 2013, 2014; van Hulten et al., 2017b). We force PISCES by a climatological year of circu-lation fields (including turbulent diffusion) that was obtained from the dynamical component of NEMO. Table 1 gives an overview of this and other components of the model and their relevant properties.
All model fields are defined on the ORCA2 discrete co-ordinate system, an irregular grid covering the whole world ocean with a nominal resolution of 2◦×2◦, with an increased resolution in the meridional direction near the Equator and Antarctica and in both horizontal directions in the Mediter-ranean, Red, Black and Caspian seas. On the Northern Hemi-sphere, it has two coordinate singularities, one in Canada and the other in Russia, such that both singularities fall out-side the computational domain. The vertical resolution of the ORCA2 grid is 10 m in the upper 100 m, increasing down-wards to 500 m such that there are 30 layers in total and the ocean has a maximum depth of 5000 m (Madec and Imbard, 1996; Murray, 1996). The time step of the model is 6 h for the dynamics and the radionuclides and 1.5 h for the biogeo-chemistry (PISCES) and the lithogenic particles. When nec-essary, sub-time stepping is done for all sinking components in the model.
2.1 Circulation
The circulation was obtained by forcing NEMO in the ORCA2 configuration with climatological air–sea bound-ary conditions consisting of heat, freshwater and momentum fluxes that were derived from bulk formulae. They are func-tions of wind, sea surface temperature, air temperature, air humidity and evaporation minus precipitation. For the trop-ics, daily wind stress was used, which was based on
Euro-pean Remote Sensing (ERS) satellite data, and for the po-lar regions NCEP/NCAR reanalysis data were used (Kalnay et al., 1996; Kistler et al., 2001). Surface salinity was re-stored with a timescale of 60 days towards the seasonal Polar Science Center Hydrographic Climatology (PHC) dataset to avoid model drift (Timmermann et al., 2005). The last year of this 200-year simulation is used as our 1-year climatology with a resolution of 5 days of the dynamics.
2.2 Particle dynamics
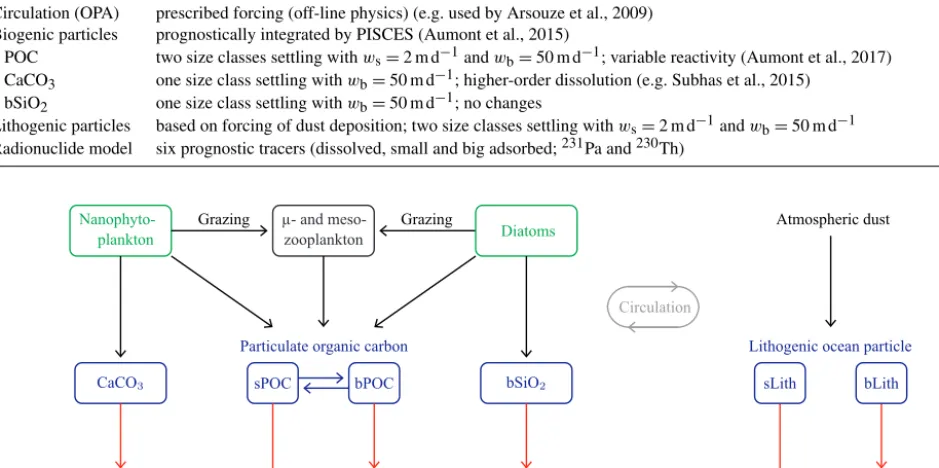
This version of PISCES includes two size classes of POC, both with differential remineralisation rates (Aumont et al., 2017), one size class of biogenic silica (bSiO2) and one class of calcium carbonate (CaCO3) (Fig. 1). In the model, parti-cles sink down with two velocities:ws=2 m d−1andwb= 50 m d−1. Aumont et al. (2015) mark the diameter boundary at 100 µm, but as we need to compare with observations, the size classes will be taken to correspond with “small” particles (∅≤51 µm) and “big” particles (∅>51 µm).
The dissolution equation for calcium carbonate is given by d[CaCO3]
dt = −R[CaCO3], (1)
where the rate variable for calcite dissolution is
R=k·(1−)n, (2)
wherekandnare two somewhat restricted, though tunable, parameters that signify a dissolution rate constant and a re-action rate order, respectively. The calcite saturation state is given by
=[Ca 2+][
CO23−] K0
sp
, (3)
whereKsp0 is the product of the saturation concentrations of calcium and carbonate. This can be approximated by
≈ [CO 2− 3 ]
[CO23−]sat (4)
because relative variations in [Ca2+] are small. For CaCO3 we changed the standard first-order dissolution kinetics pa-rameterisation to a fourth-order dissolution based on evi-dence of Keir (1980) and subsequent studies. For our sim-ulation we used a calcite dissolution rate constant of k=
2.5 mo−1 and a dissolution order ofn=3.9 (Subhas et al., 2015).
Table 1.Model components and properties essential for the radionuclide model. OPA stands for Océan PAralalisé.
Model component Improvements or relevant properties Time step
Circulation (OPA) prescribed forcing (off-line physics) (e.g. used by Arsouze et al., 2009) 6.0 h
Biogenic particles prognostically integrated by PISCES (Aumont et al., 2015) 1.5 h
– POC two size classes settling withws=2 m d−1andwb=50 m d−1; variable reactivity (Aumont et al., 2017) – CaCO3 one size class settling withwb=50 m d−1; higher-order dissolution (e.g. Subhas et al., 2015)
– bSiO2 one size class settling withwb=50 m d−1; no changes
Lithogenic particles based on forcing of dust deposition; two size classes settling withws=2 m d−1andwb=50 m d−1 1.5 h Radionuclide model six prognostic tracers (dissolved, small and big adsorbed;231Pa and230Th) 6.0 h
Nanophyto-plankton
Grazing µ- and meso-zooplankton
Grazing
Diatoms
CaCO3
Particulate organic carbon
sPOC bPOC bSiO2
Circulation
Atmospheric dust
Lithogenic ocean particles
sLith bLith
Figure 1.Conceptual model of the particle dynamics on which the numerical model is based. Nanophytoplankton and diatoms (in green) take up nutrients and CO2, which are released again from respiration and remineralisation of bSiO2, POC, dissolved organic matter and
lithogenic particles. The nutrients, CO2and dissolved organic matter are not represented in the figure because only particles impact231Pa
and230Th. Zooplankton are denoted by the black box. All sinking particles are denoted by blue boxes. Effectively, this figure comprises the internal cycling of PISCES, minus details that are not of interest here, plus the lithogenic dust model. Small and big particulate organic matter is denoted by sPOM and bPOM, both subject to the differential lability scheme (Aumont et al., 2017), and bSiO2stands for biogenic
silica. Similarly, sLith and bLith stand for small and big lithogenic particles. Sinking is denoted by the red arrows; triple arrows mean fast, and normal arrows slow.
1
1
1
1
1
1
1
1
1
1
1
1
1
1
1
1
1
1
1
1
1
1
1
1
1
1
1
1
Figure 2. Dust deposition on a logarithmic scale (g m−2yr−1). It is the integrated flux over the 12-month climatology based on Hauglustaine et al. (2004).
Small and big lithogenic particles are added to the upper layer of the ocean according to
∂PLitho
= f ·8
dust, (5)
wherePLithois the small (big) lithogenic particle concentra-tion,f is the fraction of the dust that gets partitioned into the small (big) lithogenic particles in the ocean,1z1=10 m is the thickness of the upper model layer and8dustis the dust flux.
Our model has two size classes for lithogenic particles, so this equation is applied for two different concentrations
PLithoand respective fractionsf. We set the small lithogenic dust flux fraction to 20 % and the big one to 80 %. Once partitioned in the ocean, the lithogenic particles sink down, changing their concentrations throughout the ocean accord-ing to
dPLitho
dt = −w· ∂PLitho
∂z + A∇
2 h +B
∂2 ∂z2
Dissolved
radioisotope Particle
Settling Production Decay
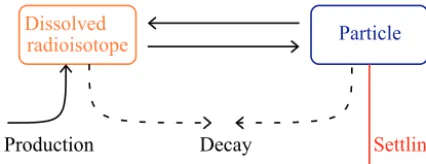
Figure 3.The conceptual reversible scavenging model for the ra-dionuclides. The radioisotopes,230Th and231Pa, are depicted in orange when in the dissolved phase. Just like with the other PISCES tracers, the dissolved and particulate radionuclides are transported by circulation and eddy diffusion.
identical to the settling of small and big POC (Aumont et al., 2015). Of course, there are also biological and chemical sources and sinks for POC. However, for lithogenic particles there are no such sources or sinks because the only source in our model is dust deposition and we assume the lithogenic particles are refractory. The lithogenic particles are removed from the model domain when arriving at the sea floor, which means that they are buried in the sediment.
2.3 Radionuclides
Thorium-230 and protactinium-231 are produced through-out the ocean from the decay of234U and235U, respectively. Because of long residence times of over 200 kyr, these ura-nium isotopes are approximately homogeneously distributed throughout the ocean and do not change much over time (Ku et al., 1977). The residence time of234U is 3.2–5.6×10⁵a, which is much longer than the full mixing time of the world ocean of about 103a (Dunk et al., 2002). The234U concen-tration can vary about 10 %, depending mostly on the salin-ity (Owens et al., 2011), but that is smaller than uncertainties arising from other assumptions in our model. Therefore, we assume that the production rates of230Th and231Pa are con-stant both in space and time.
The 230Th and 231Pa radionuclides are reversibly scav-enged by biogenic and lithogenic particles (Fig. 3). We will assume, as in previous studies (e.g. Siddall et al., 2005; Du-tay et al., 2009), that the adsorption and desorption reaction rates are sufficiently fast compared to radionuclide produc-tion, decay, advecproduc-tion, mixing, change in particle distribu-tion and settling of the adsorbed phases (see discussion in Sect. 6). Because of that, we equilibrate between the dis-solved and adsorbed phases instantly at each time step. This means, only considering adsorption and desorption processes at this point, that we must solve this set of equations for every nuclidei:
0= ∂
∂t(Ai,D+Ai,S+Ai,B) , (7a)
Ai,S=Ai,D X
j∈S
KijPj, (7b)
Ai,B=Ai,D X
j∈B
KijPj, (7c)
where Ai stands for the activity of nuclide i∈
{230Th,231Pa}1and wherePjstands for the concentration of particle j ∈ {sPOC,bPOC,CaCO3,bSiO2,sLitho,bLitho} (in gram per gram of seawater, so strictly this is a mass fraction). D is the set of non-sinking phases (here only dissolved),S of small particles that sink with 2 m d−1 and
B of big particles that sink with 50 m d−1 (in the same way as Eq. 6 for lithogenic particles). For any particle size class J∈ {S, B} and any radionuclide i, we define
Ai,J=Pj∈JAij. Finally, Kij is the equilibrium partition coefficient of nuclide i for particle j. As with small and big POC, adsorbed230Th and 231Pa should aggregate and disaggregate. However, any transference of radionuclides between two particle types or size classes, in addition to the instant equilibration, would not have any effect as there would quickly be a new equilibrium of the radionu-clides between the particles and the dissolved phase at the next instant re-equilibration (which happens each time step). Therefore, there is no equation for the radionuclides addressing aggregation.
Since we cannot solve this analytically, this will be done numerically by first assigning a new value to the dissolved nuclide activity:2
Ai,D:=
Ai,D+Ai,S+Ai,B 1+P
jKijPj
. (8)
Then, we calculate the activity of i that is adsorbed onto small and big particles by applying Eqs. (7b) and (7c). With this approach, the small and big adsorbed concentrations equilibrate instantly. Assuming that the change in adsorption strength is much smaller than the relative change in tracer activity,∀i,J:∂tPj∈JKijPj∂tAi,D/Ai,D, the total activ-ity of everyiis conserved, i.e. Eq. (7a) holds.
Proof.Let the total adsorption strength for any isotopei
beQi=PjKijPj and the total amount of the same isotope
Ti=Ai,D+Ai,S+Ai,B, and let primes denote the updated concentrations. Assume that the adsorption strength for every 1The concentration of radionuclides (amount per unit of
vol-ume) is proportional to its (radio)activity (disintegrations per unit of time). These terms are used interchangeably throughout this pa-per. Moreover, they are considered identical: the activity or concen-tration[230Th]D≡A230This expressed in mBq m−3, and thus we
report activity ratios of231Pa/230Th.
2When summation bounds are not specified, the union of all
isotopeiis constant (Q0i≡Qi).
Ti0= Ti
1+Q0i +A 0 i,DQ
0 i
= Ti
1+Qi
+ Ti
1+Qi
Qi
= Ti
1+Qi
(1+Qi)=Ti
⇒∂tTi0=∂tTi=0.
The 230Th and 231Pa that are adsorbed onto the particles follow the same law as the small and big (lithogenic) parti-cles (Eq. 6). Of course, by definition, the adsorbed radioiso-tope and the particle settle with the same speed, and thus we have implemented it.
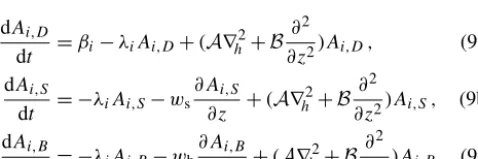
The decay terms of 230Th and 231Pa are much smaller than the other sources and sinks, but they are included in the model:
dAi,D
dt =βi−λiAi,D+(A∇ 2 h +B
∂2
∂z2)Ai,D, (9a) dAi,S
dt = −λiAi,S−ws ∂Ai,S
∂z +(A∇ 2 h +B
∂2
∂z2)Ai,S, (9b) dAi,B
dt = −λiAi,B−wb ∂Ai,B
∂z +(A∇ 2 h+B
∂2
∂z2)Ai,B, (9c) whereβi andλi are respectively the production rate and ra-dioactive decay of isotopei.
3 Simulations
For the numerical simulations, we forced the just described model, an adjusted version of PISCES with lithogenic parti-cles and radiotracers, with the off-line circulation fields. The model was spun up for 500 years, after which it was in an approximate steady state (decadal drift of−0.002 % for total 230Th and+0.058 % for total231Pa). Protactinium-231 has a larger drift than thorium-230 because230Th is more quickly removed everywhere in the ocean because of its high parti-cle reactivity. The lithogenic partiparti-cles are in a steady state, and the PISCES variables are in an approximate steady state (e.g. phosphate shows a drift of−0.005 % per decade).
The partition coefficients Kij, with i∈ {Th,Pa}, depend on the type of particlej and are given in Table 2.
These coefficients still have large uncertainties, but their values can be constrained by reported values from differ-ent experimdiffer-ental studies (e.g. Chase et al., 2002; Geibert and Usbeck, 2004; Hayes et al., 2015b). Therefore, we had quite some freedom in prescribing values. The adsorption onto calcium carbonate is a factor of 2 decreased from Chase et al. (2002). This brings theKvalue of Pa closer to that in Hayes et al. (2015b) based on field measurements, namely 0.9±0.4 Mg g−1(106g of seawater per gram of particles), but since we maintained the ratio of Kvalues, the partition
Table 2.Partition coefficients for the different modelled particles in 106g of seawater per gram of particles. In parentheses is the value for the sensitivity simulation discussed in Sect. 6.1.
Particle KPa(Mg g−1) KTh(Mg g−1) Settling speed
Small POC 2 0 5 0 2 m d−1
Big POC 0 4 1 0 50 m d−1
Biogenic silica 0 5 (0.4) 0 5 (1.0) 50 m d−1
CaCO3 0 12 5 0 50 m d−1
Small lithogen 10 0 50 0 2 m d−1
Big lithogen 1 0 5 0 50 m d−1
coefficient of Th is much smaller than found by Hayes et al. (2015b). It is consistent with the laboratory results of Geibert and Usbeck (2004), but they cleaned the biogenic silica ag-gressively, bought carbonate that should be organic-free and clay (smectite) was purchased as a commercial standard and not cleaned (Geibert and Usbeck, 2004; and Walter Geibert, personal communication, January 2018). In the real ocean, solid minerals are not clean but have organic matter around them, giving rise to increased scavenging (Chuang et al., 2014, for diatoms). Therefore, ourKvalues for at least bio-genic silica and calcium carbonate may be lower than what is typically considered realistic. The actual reason for the rela-tively lowK values is that we only have fast-sinking bio-genic silica and calcium carbonate particles in the model that also represent smaller particles that sink slower. Thus us-ing higherK values would result in too much export of Pa and Th. For small lithogenic particles,Kis set about a factor of 5 larger than in the literature (Geibert and Usbeck, 2004; Hayes et al., 2015b), whereas big lithogenic particles have a smaller value than reported in the literature. The Supplement contains a more exhaustive table of information, including an estimated literature range (Table S3). The consequences of the chosen values for the partition coefficients are discussed further in Sect. 6.
4 Observations
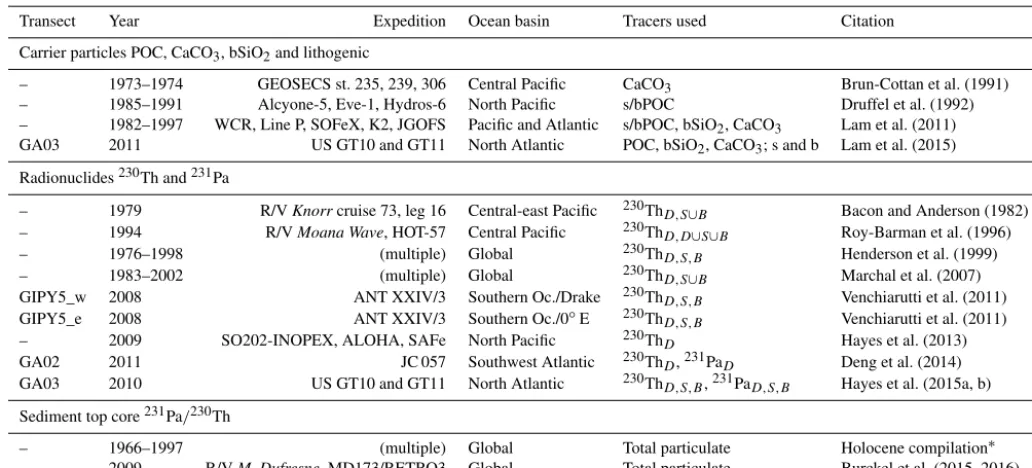
In this study, we will focus on the GEOTRACES GA03 tran-sect in the North Atlantic Ocean. Recently, a large number of measurements on both radionuclides and their carrier par-ticles have been collected on this transect. This unique com-bination makes it especially useful to evaluate a radionu-clide scavenging model. We will also compare our global ocean model with several observational datasets throughout the ocean (Table 3). Observations obtained from the TRACES programme are denoted with the respective GEO-TRACES transect number (Mawji et al., 2015; Schlitzer et al., 2018).
compi-Table 3.Observations used for comparison with the model simulations.
Transect Year Expedition Ocean basin Tracers used Citation
Carrier particles POC, CaCO3, bSiO2and lithogenic
– 1973–1974 GEOSECS st. 235, 239, 306 Central Pacific CaCO3 Brun-Cottan et al. (1991) – 1985–1991 Alcyone-5, Eve-1, Hydros-6 North Pacific s/bPOC Druffel et al. (1992) – 1982–1997 WCR, Line P, SOFeX, K2, JGOFS Pacific and Atlantic s/bPOC, bSiO2, CaCO3 Lam et al. (2011) GA03 2011 US GT10 and GT11 North Atlantic POC, bSiO2, CaCO3; s and b Lam et al. (2015)
Radionuclides230Th and231Pa
– 1979 R/VKnorrcruise 73, leg 16 Central-east Pacific 230ThD,S∪B Bacon and Anderson (1982) – 1994 R/VMoana Wave, HOT-57 Central Pacific 230ThD,D∪S∪B Roy-Barman et al. (1996)
– 1976–1998 (multiple) Global 230ThD,S,B Henderson et al. (1999)
– 1983–2002 (multiple) Global 230ThD,S∪B Marchal et al. (2007)
GIPY5_w 2008 ANT XXIV/3 Southern Oc./Drake 230ThD,S,B Venchiarutti et al. (2011) GIPY5_e 2008 ANT XXIV/3 Southern Oc./0◦E 230ThD,S,B Venchiarutti et al. (2011)
– 2009 SO202-INOPEX, ALOHA, SAFe North Pacific 230ThD Hayes et al. (2013)
GA02 2011 JC 057 Southwest Atlantic 230ThD,231PaD Deng et al. (2014)
GA03 2010 US GT10 and GT11 North Atlantic 230ThD,S,B,231PaD,S,B Hayes et al. (2015a, b)
Sediment top core231Pa/230Th
– 1966–1997 (multiple) Global Total particulate Holocene compilation∗
– 2009 R/VM. Dufresne, MD173/RETRO3 Global Total particulate Burckel et al. (2015, 2016)
∗http://climotope.earth.ox.ac.uk/data_compilations (last access: 27 August 2018).
lation of particles is taken from Lam et al. (2011). We use some older data as well (Table 3). Particle concentrations were determined by filtering seawater in situ.
Concentrations of both dissolved and particulate phases of 230Th and 231Pa were taken from Hayes et al. (2015a) (GA03) and Hayes et al. (2014) (Pacific Ocean). Other data are listed in Table 3.
To evaluate the sediment 231Pa/230Th flux of the model, we will compare with compilations of the Holocene (i.e. top core particulate concentrations) (Table 3).
5 Results 5.1 Circulation
As mentioned before, our model is part of a global general circulation model, but instead of solving the Navier–Stokes equations, our tracers are advected by the circulation fields of a previous simulation of the dynamical ocean model. Since the overturning circulation is of importance for the redistri-bution of the tracers, we present basic results here.
Figure S1 of the Supplement presents the overturning stream function (OSF) of the Atlantic Ocean. The OSF is de-fined as the zonally (through the basin) and vertically (from the surface downwards) integrated meridional component of the current velocity. We use this as a measure for the Atlantic Meridional Overturning Circulation (AMOC). The upper overturning cell transports 14 Sv (1 Sv=106m3s−1) on av-erage. Observations suggest higher values of about 19±5 Sv (Cunningham et al., 2007; Rayner et al., 2011; Sinha et al.,
2018). The lower cell has an overturning strength of about 6 Sv, which is stronger than the about 2 Sv from estimates (e.g. Talley et al., 2003). This overestimation is mostly due to the fact that the AMOC is shallow. The AMOC reaches about 2500 m of depth, whereas observational studies show the deep water sinks down to about 4000 m. At around 30◦N the AMOC has weakened notably, which is consistent with some studies (e.g. Johnson, 2008), but the Antarctic Bottom Water (AABW) does not go as far north as other studies sug-gest (e.g. 45◦N in Middag et al., 2015).
The Antarctic Circumpolar Current is also an important feature for large-scale ocean circulation. The throughflow at the Drake Passage is a good measure for that. In our model the flux through the Drake Passage is 200 Sv, which slightly overestimates recently reported values (e.g. 173±11 Sv in Donohue et al., 2016).
5.2 Particles
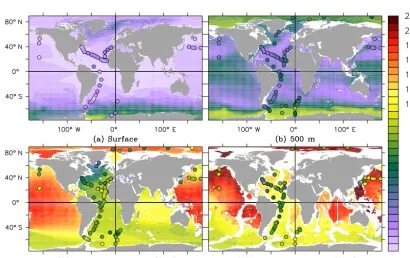
Figure 4.Particle concentrations from the PISCES model at the surface ocean. Observations are represented as coloured discs (Brun-Cottan et al., 1991; Druffel et al., 1992; Lam et al., 2011, 2015). The unit of every modelled and measured particle concentration is mg m−3.
equatorial Pacific POC concentrations are elevated in both the model and the observations compared to other regions, although the spatial extent of the oligotrophic regions ap-pears to be too small in the model. We compare our modelled CaCO3(big, fast-sinking calcium carbonate particles), with the big calcium carbonate particles from observations. As the model tries to represent CaCO3with only one size class, nei-ther comparing with only big particles nor comparing with total CaCO3is completely fair. Incidentally, we have data of big CaCO3for both the Atlantic and Pacific Ocean, whereas only for the Atlantic Ocean do we have small particle data. Even though the meridional patterns of big CaCO3particles are reproduced, the concentrations are generally overesti-mated, especially in the Gulf of Alaska (Fig. 4b). Contrarily, total observed[CaCO3], which is only provided along sec-tion GA03 where small particulate CaCO3measurements are available, is higher than the prediction of our modelled (only big) CaCO3 particle concentration. The model produces a reasonable spatial distribution of biogenic silica: there are more elevated values in the high latitudes, but concentrations are underestimated at the surface at low latitudes (Fig. 4c).
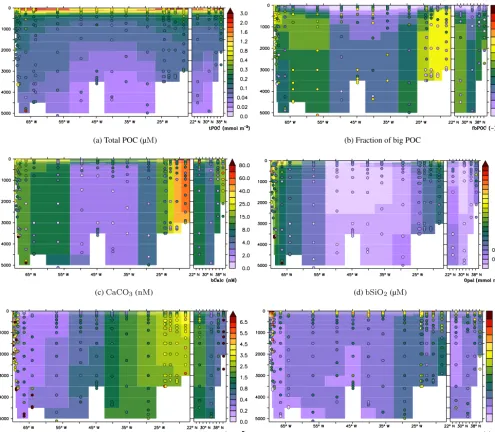
The recent large dataset obtained from the full-ocean depth GEOTRACES GA03 transect (Lam et al., 2015) provides an opportunity to analyse the performance of PISCES in more detail. PISCES generally produces the right order of magni-tude for all four biogenic particles (small and big POC, cal-cium carbonate, and biogenic silica), but there still remain some shortcomings in their distributions (Fig. 5a–d).
– The total POC concentration in Fig. 5a is up to a factor of 4 underestimated in the deep oligotrophic ocean. In the upper 200 m of the ocean the model overestimates the observations, though at some points at the surface
the POC concentration is underestimated (also Fig. 4a). In both the observations and the model the fraction of big POC varies from zero to 0.6 (Fig. 5), but the spa-tial distributions are very different. More detailed results and discussion on the simulation of POC are to be found in Aumont et al. (2017).
– The model underestimates the CaCO3 concentrations from 70 to 25◦W by a factor of 2 to 10, but east of that up to Africa the prediction lies close to or overestimates the observations. In the Canary Basin and up to Portugal (meridional transect at the right), the model reproduces the right order of magnitude, but it does not reproduce the correct profiles everywhere (Fig. 5c).
– Biogenic silica concentrations are generally reproduced but the model overestimates the higher concentrations observed along the western margin (Fig. 5d).
(a) Total POC (µM) (b) Fraction of big POC
(c)CaCO3(nM) (d)bSiO2(µM)
(e) Total lithogenic (mg m−3) (f) Fraction of big lithogenic
Figure 5.Particle fields at the GA03 North Atlantic GEOTRACES transect; observations (Lam et al., 2015) as coloured discs.
5.3 Thorium-230 and protactinium-231
[230Th]Dstands for the concentration of230Th that is in the dissolved phases. Similarly,[230Th]Sis the concentration of 230Th that is adsorbed onto small particlesS,[230Th]
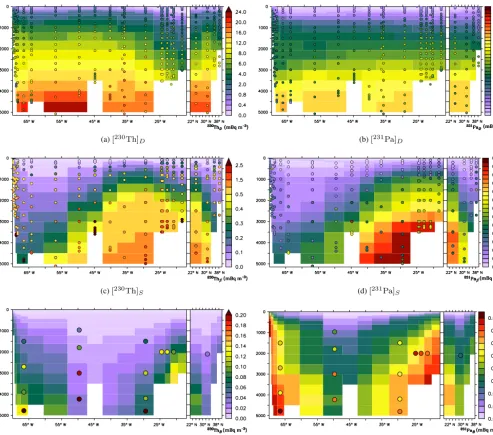
B the concentration adsorbed onto big particles B and similarly for231Pa. The modelled dissolved distributions of230Th and 231Pa are underestimated at the surface (Figs. 6 and 7). Be-low the surface, [230Th]D is much better captured by the model (also Fig. 8a for the GA03 transect). However, ob-servations show lower values near the bottom in the western part of the GA03 section and at 45◦W associated with more intense scavenging related to respective nepheloid layers and
manganese oxides from hydrothermal vents, which are not produced in the simulation (Fig. 8a and b).
In the intermediate and deep waters of all the oceans, mod-elled [231Pa]D is generally of the correct order of magni-tude but is strongly overestimated below 2500 m of depth (Fig. 8b), especially in the Pacific Ocean (Fig. 7c, d).
The concentrations of the adsorbed phases of 230Th at GA03 are presented in Fig. 8c and e. In the deep ocean, modelled [230Th]S and [230Th]B have lower values than
Figure 6.The dissolved thorium-230 activity at four depth levels (mBq m−3); observations as discs on the same colour scale.
Figure 7.The dissolved protactinium-231 activity at four depth levels (mBq m−3); observations as coloured discs.
and231Pa. However, the model still underestimates the ob-served[230Th]S and[230Th]B.
Contrarily, small 231Pa particles are overestimated in our model below 1500 m at the GA03 transect (Fig. 8d). Big 231Pa particles are simulated more realistically (Fig. 8f).
(a)[230Th]
D (b)[231Pa]D
(c)[230Th]
S (d)[231Pa]S
(e)[230Th]B (f)[231Pa]B
Figure 8.Radionuclide concentrations at the GA03 North Atlantic GEOTRACES transect. Panels(a)and(b)display dissolved concen-trations, panels(c)and(d)show the amounts on small particles, and panels(e)and(f)those on big particles. Everything is in mBq m−3. Observations (Hayes et al., 2015a) are shown as coloured discs.
[231Pa]Dmatches that of the observations for the upper 2 km, below which our model overestimates the observations by up to a factor of 4 at the bottom of the ocean.
Globally in the model, only 0.3 % of the231Pa sits in the particulate pool, and for230Th this is 1.3 %. The rest is in the dissolved phase. Observational data show that more than 10 % of230Th sits in the particulate pool, typically adsorbed onto small calcium carbonate particles. The underestimation by our model can be explained by the fact that we only have big, fast-sinking CaCO3particles in the model. Since the big particles are removed quickly, these cannot act as a realistic CaCO3-associated 230Th pool without depleting230Th, and
thus we underestimate the particulate radionuclide concen-trations.
1
1
1
1
1
1
1
1
1
1
1
1
1
1
1
1
1
1
1
1
1
1
1
1
1
1
1
1
1
1
1
1
1
1
1
1
1
1
1
1
1
1
1
1
1
1
1
1
1
1
1
1
1
1
1
1
1
1
1
1
1
1
1
1
1
1
1
1
1
1
1
1
1
1
1
1
1
1
1
1
1
1
1
1
1
1
1
1
1
1
1
1
1
1
1
1
1
1
1
1
1
1
1
1
1
1
1
1
1
1
1
1
1
1
1
1
1
1
1
1
1
1
1
1
1
1
1
1
Figure 9.Radionuclide concentrations in mBq m−3at stations in the North Pacific (around the ALOHA station, 158◦W, 23◦N) and North Atlantic Ocean (around the BATS station, 64◦W, 29◦N). The left two panels(a, b)display[230Th]D, and the right two(c, d)[231Pa]D. The line is the model, and the speckles are the observations.
Table 4.Relative global budget of231Pa and230Th in the different particulate phases (“global stock”) in percentages. Globally aver-aged fluxes in the different phases (“global particle flx”), and the same but for the North Atlantic Ocean (44–24◦W, 25–56◦N) and the Weddell Sea (44–24◦W, 76–63◦S), all in percentages associ-ated with each particle type.
% POC bSiO2 CaCO3 Litho.
231Pa
Global stock 35.5 10.5 3.1 50.8
Global particle flux 16.5 53.5 15.8 14.2 North Atlantic flux 16.5 25.7 15.6 42.1 Southern Ocean flux 5.6 93.7 0.6 0.1
230Th
Global stock 21.3 3.2 24.3 51.2
Global particle flux 5.9 9.9 75.8 8.7 North Atlantic flux 4.4 2.8 69.9 22.9 Southern Ocean flux 9.7 71.1 18.9 0.3
Pa to bSiO2mostly results in a strong export (and similarly for Th on CaCO3).
Only a small amount of230Th is adsorbed onto biogenic silica (3 %), though the amount is larger for 231Pa (11 %). However, the global settling flux of231Pa is primarily (54 %) determined by bSiO2, particularly due to the high bSiO2 fluxes in the Southern Ocean. Most of the modelled par-ticulate 231Pa and 230Th is on the lithogenic particles, but lithogenic particles account for only 14 % of the231Pa flux and 9 % of the230Th flux. If lithogenic particles from neph-eloid layers were included, this fraction would be higher. The flux contribution is also different from what is in the pools when we look at CaCO3: only 24 % of the230Th is on cal-cium carbonate, but CaCO3 is responsible for 76 % of the 230Th export. These discrepancies between the contribution of each particle type to the flux and to the stock of
radionu-clides arise from the different settling velocities for each type of particle.
The relative contributions of the different particulate phases also vary for different regions of the ocean. Most no-tably, biogenic silica is responsible for 94 % of231Pa export in the Southern Ocean.
Compared to Dutay et al. (2009), the230Th profile shape is improved, but only to a small extent due to the large im-provement in the POC representation (Aumont et al., 2017) because the POC accounts for only 6 % of the vertical trans-port of 230Th (Table 4). The improvement is mostly due to the addition of lithogenic dust particles and the adjusted CaCO3dissolution. Lithogenic particles and CaCO3hardly dissolve compared to POC and hence the downward particle flux remains constant, which is in agreement with 1-D mod-els which show linear profiles of230ThD (e.g. Roy-Barman, 2009).
5.4 Sedimentation flux ratio of231Pa/230Th
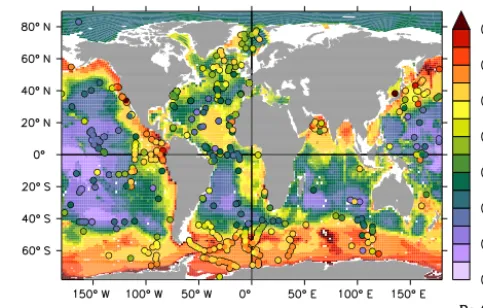
The sedimentation flux of the total adsorbed231Pa/230Th ra-tio captures the general patterns of the upper sediment core 231Pa/230Th concentration ratio (Fig. 10). Consistent with observations, the model produces more elevated231Pa/230Th ratio values in the Southern Ocean, the northern part of the Indian Ocean, the Pacific Ocean and along the coastal up-welling regions. However, at some places, like much of the Southern Ocean, our model tends to overestimate the ratio derived from the sediment core observations.
6 Discussion
radioac-Figure 10.Sedimented231Pa/230Th ratio. Top core measurements are presented as coloured discs. This is the standard simulation with
KPa,bSiO2/KTh,bSiO2=1.
tivities in the surface waters (Figs. 6a and 7a). This short-coming may be due to the instant equilibration between the dissolved and the adsorbed phases (Henderson et al., 1999). After the decay of U into 231Pa and 230Th, the tracers in-stantly adsorb onto the particles in the surface ocean and are exported from the mixed layer. The equilibrium scaveng-ing approach is commonly used in Pa/Th modelling (Siddall et al., 2005; Dutay et al., 2009; Gu and Liu, 2017). It allows the model to use partition coefficients that can be directly constrained by observations (although consensus values for these coefficients are still not available). A non-equilibrium approach to scavenging could be considered, but it would necessitate the use of adsorption and desorption coefficients (k+,k−) that are currently very poorly constrained by ob-servations. Observations shows equilibrium partition coeffi-cientKvalues varying (decreasing) with particle flux (Roy-Barman et al., 1996; Chase et al., 2002), and we apply these in our simulation (i.e. lowerKvalues for large, fast-sinking particles). This parameterisation produces effects that are similar to those of a non-equilibrium system for fast-sinking particles.
The reversible scavenging model uses partition coeffi-cientsKij for the different isotopesiand particlesj. Many studies provide constraints on these coefficients but estimates vary strongly between different studies. Small particles are the most important scavengers and largely control the shape of the vertical profile of the tracers (Dutay et al., 2009). This also shows from sedimentary isotope records (Kretschmer et al., 2011). This is explained by the specific surface of small particles, which is larger than that of big particles. Therefore, higher adsorption values are set for small particles compared to the bigger particles of the same type (namely, 5 times higher for POC and 10 times higher for lithogenic particles). Compared to Dutay et al. (2009), we succeed in simulating the tracer concentrations using reasonableKvalues. This is due to improvement in (especially small) particle
concentra-Figure 11. Sedimented 231Pa/230Th ratio when we set
KPa,bSiO2/KTh,bSiO2=0.4. Top core measurements are
pre-sented as discs.
tions, which were generated with the lability parameterisa-tion of POC (Aumont et al., 2017), the change in the CaCO3 dissolution parameterisation and the addition of lithogenic dust in our ocean model. This shows that at least two parti-cle size classes are needed to simulate dissolved and partic-ulate thorium and protactinium. Our model does not include small particles for all types (there are neither small CaCO3 nor small bSiO2particles), even though we expect that bet-ter results can be reached upon adding those particles akin to small POC and small lithogenic particles.
On the GA02 transect, the correlation coefficient r of the data–model comparison of [230Th]D is 0.80, which is close to what was reported by Rempfer et al. (2017) in their simulations without bottom-boundary scavenging. On the GA03 section,r=0.78. The correlations between the model and observations are presented as scatter plots (Supplement Fig. S2).
There are a couple of interesting features to note on the comparisons. Firstly, the hydrothermal plume over the ridge results in230Th-poor seawater that is not reproduced by the model (red triangle in Fig. S2, GA03). Secondly, in the west-ern boundary currents, very low dissolved230Th concentra-tions are observed due to strong nepheloids and/or possibly strong deep ventilation from the north. Neither of these pro-cesses is represented in the model. The lack of nepheloids has an especially large impact on the GA02 transect, which has a relatively large number of measured profiles near the western boundary. Finally, between 32 and 20◦W, the model tends to underestimate230Th. The value of the correlation in-dex is not that important because the goal of this study is not to give a perfect model–data comparison.
(a)
(b)
Figure 12. Dissolved protactinium-231(a)and thorium-230 (b)at the Drake Passage (GIPY5) and western Atlantic (GA02) transects (mBq m−3); observations as discs. The Atlantic OSF, in Sv, is superimposed as a contour.
given the significant impact of dust particles on thorium and protactinium concentrations, it would be useful to look into the effect of different dust deposition fields and using differ-ent dust particle size classes. A good model of 230Th (and other isotopes of thorium) could even constrain the sporadic and uncertain dust deposition, but all this falls outside the scope of the present study.
Our model adds 80 % of the dust deposition into the fast-sinking lithogenic particle compartment (corresponding to
∅>51 µm), and only 20 % goes into the slowly sinking
compartment (corresponding to ∅≤51 µm). This is
neces-sary to reproduce the distributions of lithogenic particles. However, airborne dust particles typically have a diameter smaller than 20 µm (Knippertz and Stuut, 2014) and thus fall clearly within the small size class of less than 50 µm. Re-cently, there have been observations of aerosols larger than 20 µm (van der Does et al., 2016), but they do not reach far enough into the atmosphere above the open ocean to explain the high concentration of big lithogenic ocean particles. The explanation for the apparently required high fraction of big lithogenic particles is that smaller aerosols aggregate in the
upper layers of the ocean. Moreover, though more hypotheti-cally, there may be strong aggregation with biogenic particles just below the surface, below which the aggregates partly dis-aggregate again to result in the∼0.2 big lithogenic fraction in the deep ocean (Fig. 5f).
the bottom box of the ocean model, no large-scale prognostic nepheloid models have been developed.
We overestimate the radionuclide activity in the deep ocean, which is partly because we underestimate parti-cle concentrations. Thorium adsorbs especially well onto lithogenic particles, which are underestimated in the west-ern Atlantic Ocean (in the subsurface, west of about 43◦W, Fig. 5e). Below 2 km of depth, POC is also underestimated (Fig. 5a), even though the lability parameterisation improved the distribution by over an order of magnitude compared to previous versions of PISCES (Aumont et al., 2017). Small POC and the small lithogenic particles are the only small particles. The overall underestimation of small particles in the deep ocean results in an overestimation of the radionu-clides in the deep ocean. In our simulation,[230Th]D is not that much overestimated (outside the Arctic Ocean). How-ever, [231Pa]D is strongly overestimated in the deep Pacific and Atlantic Ocean.
Clearly the model does not remove 231Pa efficiently enough from the deep ocean (Figs. 7c, d, 8b and 12a). Two likely reasons may be that the waters are not well ventilated in the model (older than in reality) or that there is not enough scavenging. The Atlantic OSF (Fig. S1) shows that the up-per overturning cell is too shallow compared to observational studies, so there is too little ventilation. This means that231Pa can build up in the deep water due to sluggish ventilation of the physical model (Dutay et al., 2002; Biastoch et al., 2008). Moreover, the AABW has weakened in the deep North At-lantic Ocean near the high[231Pa]Dregion (Fig. 12a), which may also contribute to the high dissolved 231Pa concentra-tions. The volume transport of the lower cell is about 6 Sv near 20◦N and still 2 Sv near 40◦N, which is in the order of magnitude of what is reported by the literature. Moreover, the relationship between sediment231Pa/230Th at any given site and the overturning circulation is very complex. In gen-eral, any increased opportunity for protactinium to scavenge would increase the sedimentary 231Pa/230Th ratio. Specifi-cally, a slower overturning would mean more Pa scavenging and a higher ratio “just downstream of the sites of deep water formation” (Luo et al., 2010). Similarly, relatively stronger scavenging of Pa means a higher sedimentary231Pa/230Th, which we can see in the Southern Ocean and some coastal ar-eas where the concentration of bSiO2is high. For these rea-sons, it is not obvious whether the weak overturning is large enough to explain the discrepancy between the modelled and the observed[231Pa]D.
In reality, there are many regions in the North Atlantic Ocean where there is sediment resuspension and where there are nepheloid layers (Gardner and Sullivan, 1981; Lam et al., 2015; Gardner et al., 2017). This is consistent with the fact that our model underestimates lithogenic particle concentra-tions in the western Atlantic Ocean (Fig. 5e). The additional lithogenic particles would scavenge more231Pa, resulting in lower [231Pa]D. Even though the enforced scavenging oc-curs near the floor and the western boundary of the ocean,
a strong flux of water passes through the latter region and is transported through the North Atlantic Gyre and through the rest of the Atlantic, diluting high tracer concentrations. The small POC and lithogenic particles are now underestimated in much of the deep ocean. They would contribute to lower radio tracer concentrations as well. Rempfer et al. (2017) confirmed that an additional bottom sink affects 231Pa and 230Th significantly. They used a homogeneous extra scav-enger in their model grid’s bottom grid cell. Therefore, it would be worth testing if a realistic distribution of nepheloids would result in the right amount of scavenging.
Other particles may include resuspended (nepheloidal) biogenic particles, but also manganese and iron hydroxides that are not included in our model, and a smaller class of cal-cium carbonate and biogenic silica particles in addition to the big particle classes that are already in the model. Manganese oxides are especially available near hydrothermal vents, but also throughout the Pacific Ocean in low concentrations but much higher than in the Atlantic Ocean. Indeed, it has been argued that hydrothermal inputs may provide additional re-moval of231Pa and230Th (Lopez et al., 2015; Rutgers van der Loeff et al., 2016; German et al., 2016), and recently this has been confirmed based on an analysis of the∼10◦S zonal GP16 transect in the Pacific Ocean (Pavia et al., 2017).
Finally, the particle concentration effect (Honeyman et al., 1988) should be taken into account in future models, particu-larly when regions of high particle concentration (e.g. ocean margins and nepheloid layers) are included.
6.1 Effect of scavenging by bSiO2on the231Pa/230Th sedimentation flux ratio
Previously, it was suggested that Pa has a stronger affinity for bSiO2 than Th, i.e. FPa/Th,bSiO2 >1 (Henderson et al.,
1999; Chase et al., 2002; Dutay et al., 2009). This “standard view” has weakened over time, so it is often accepted that
FPa/Th,bSiO2&1 (Venchiarutti et al., 2011; Rutgers van der
Loeff et al., 2016; Rempfer et al., 2017). We argue here that it is Th which has the stronger affinity to bSiO2(FPa/Th,bSiO2<
1), similarly (though not quite) to other particles.
Our standard simulation (withFPa/Th,bSiO2=1) yields a
too-high sedimentation 231Pa/230Th ratio compared to top core sediment observations below diatom-rich areas such as the Southern Ocean. In that region, bSiO2 largely controls the particle scavenging of the two tracers, especially that of 231Pa (Table 4). In order to estimate how strongly the model depends on the value of the bSiO2 partition coeffi-cient we performed a sensitivity experiment in which we setKPa,bSiO2=0.4 Mg g
−1andK
Th,bSiO2=1.0 Mg g −1such that nowFPa/Th,bSiO2=0.4 (Table 2).
This result is consistent with Geibert and Usbeck (2004) whose laboratory study shows no definitive affinity of either Th or Pa to biogenic silica. Their averageKvalues actually suggest that thorium has a higher affinity to biogenic silica.
We included lithogenic particles in the model from de-posited dust. Since lithogenic particles have a strong relative affinity with230Th (KPa,Lith/KTh,Lith=0.2) and since they are mostly prevalent in the (northern) Atlantic Ocean, much of the 230Th is scavenged in the Atlantic Ocean. Calcium carbonate KPa/KTh is even smaller (0.024) and is present throughout much of the Atlantic but not in the Southern Ocean. This leaves protactinium to be scavenged by biogenic silica in the Southern Ocean when it arrives there through the AMOC. Therefore, even with the smaller-than-conventional
K ratio of 0.4 for biogenic silica, the familiar pattern of higher values of 231Pa/230Th in the Southern Ocean com-pared to most of the rest of the ocean is still reproduced.
7 Conclusions
The purpose of this study is two-fold. Firstly, we set out a model of 231Pa and 230Th, complete with all the necessary particle improvements and additions. This includes improved underlying particle dynamics from NEMO–PISCES and the addition of lithogenic particles. We have succeeded in this, and the model has been presented and implemented such that it can be used for future studies, including for the modelling and validation of ocean circulations in the past, present and future.
Secondly, this model helps us to study the interplay be-tween the particle and water transport that controls the231Pa and 230Th profiles. We have shown that, by improving on the particles, we improved the radionuclide distributions and fluxes. We have also shown to what extent the different par-ticle phases drive the scavenging of231Pa and230Th.
Dissolved230Th and231Pa concentrations are realistic in the intermediate-depth ocean (big improvement compared to Dutay et al., 2009) but not in the upper part of the ocean. A finite equilibration time between the different radionuclide phases may help. The model can be extended to include this in future versions. It would double the number of adsorp-tion and desorpadsorp-tion parameters whose values should be de-termined through a careful literature and model sensitivity study.
In the deep ocean, the overestimation of230Th and231Pa in several regions is likely to be caused, at least partly, by missing nepheloid particles, but manganese oxides (from hy-drothermal vents) may also improve the distributions. Of course, reported adsorption and desorption parameters vary a lot between different studies, meaning that a different, yet still plausible, combination of partition coefficients could better describe the available data. Additionally, the circula-tion may be too weak, not freshening AABW fast enough,
and hence230Th and231Pa concentrations become too high near the ocean floor.
Code availability. The mathematical variable names correspond to the Fortran variables as described in Table S1 of the Supplement. We encourage the reader to use our model, NEMO–ProThorP, to build extended and improved models. We have implemented two particle size classes of adsorbed nuclides, which is the minimum that is needed to produce good results. Instead of introducing a new tracer for every particle type, we only distinguish between “adsorbed onto small particles” and “adsorbed onto big particles”, meaning that one is restricted in this set-up to include only parti-cles that sink with the two respective settling speeds for scavenging. Whereas this is somewhat restricting, it is computationally efficient, and it restricts the number of degrees of freedom (which is usually a good thing in complex models). NEMO–ProThorP can also be used to set up a non-instant equilibration model (with ak+andk−) that
may yield better concentrations in the upper ocean.
The underlying model, NEMO 3.6 (svn revision 5283), can be downloaded from http://www.nemo-ocean.eu/ (Madec and the NEMO team, 2016) after creating a login. NEMO includes the biogeochemical PISCES model (Aumont et al., 2015). For repro-ducibility purposes, version 0.1.0 of the radionuclide and lithogenic particles model code can be obtained at https://dx.doi.org/10.5281/ zenodo.1009065 (van Hulten et al., 2017a). However, we plan to make this code available as part of the NEMO model.
The NEMO model is available under the CeCILL (http:// www.cecill.info/, last access: 27 August 2018) free software li-cence, modelled after the GNU GPL. The lithogenic particles and230Th/231Pa-specific code is licenced under the same terms or under the GNU General Public License (https://www.gnu.org/ copyleft/gpl.html, last access: 27 August 2018) version 3 or higher. The authors would appreciate it if, in addition to the legal adherence to copyleft and attribution, they are informed about the use of the code.
Finally, the most important raw model output files are available at PANGAEA (https://doi.org/10.1594/PANGAEA.887261) (van Hul-ten et al., 2018). The Julia scripts used for the statistics are included in the Supplement. This may be useful to reproduce the results or further inspect the model output.
Supplement. The supplement related to this article is available online at: https://doi.org/10.5194/gmd-11-3537-2018-supplement.
Author contributions. The model and the simulations were de-signed by MvH, JCD and MRB. MvH implemented the code and performed the simulations. The paper was prepared by MvH with close collaboration and major contributions from MRB and JCD.
Acknowledgements. We would like to thank Marion Gehlen and Olivier Aumont for the discussions on the calcite parameterisation in PISCES, among other things. The first author is grateful to Jörg Lippold for both the discussion and encouragement that also helped this work.
This study was supported by a Swedish Research Council grant (349-2012-6287) in the framework of the French–Swedish cooper-ation in the common research training programme in the climate, environment and energy agreement between VR and LSCE for the project “Particle transport derived from isotope tracers and its im-pact on ocean biogeochemistry: a GEOTRACES project in the Arc-tic Ocean”. This study was partly supported by the project “Over-turning circulation and its implications for the global carbon cycle in coupled models” (ORGANIC; the Research Council of Norway, grant no. 239965).
The authors wish to acknowledge the use of Ferret (https://ferret.pmel.noaa.gov/Ferret/, last access: 27 August 2018), a product of NOAA’s Pacific Marine Environmental Laboratory (http://www.noaa.gov/, last access: 27 August 2018). Most of the plots in this paper were created by the Ferret visualisation library ComPlot (http://www.nongnu.org/complot/, last access: 27 August 2018) (van Hulten, 2017). Finally, the language Julia (https://julialang.org/, last access: 27 August 2018) was used for some of the statistics.
Edited by: Andrew Yool
Reviewed by: Peter Santschi and three anonymous referees
References
Anderson, R.: Chemical tracers of particle transport, Treatise on Geochemistry, 6, 247–273, https://doi.org/10.1016/B0-08-043751-6/06111-9, 2003.
Anderson, R., Bacon, M., and Brewer, P.: Removal of230Th and
231Pa from the open ocean, Earth Planet. Sc. Lett., 62, 7–23,
https://doi.org/10.1016/0012-821X(83)90067-5, 1983.
Arsouze, T., Dutay, J.-C., Kageyama, M., Lacan, F., Alkama, R., Marti, O., and Jeandel, C.: A modeling sensitivity study of the influence of the Atlantic meridional overturning circulation on neodymium isotopic composition at the Last Glacial Maximum, Clim. Past, 4, 191–203, https://doi.org/10.5194/cp-4-191-2008, 2008.
Arsouze, T., Dutay, J.-C., Lacan, F., and Jeandel, C.: Recon-structing the Nd oceanic cycle using a coupled dynami-cal – biogeochemidynami-cal model, Biogeosciences, 6, 2829–2846, https://doi.org/10.5194/bg-6-2829-2009, 2009.
Aumont, O., Ethé, C., Tagliabue, A., Bopp, L., and Gehlen, M.: PISCES-v2: an ocean biogeochemical model for carbon and ecosystem studies, Geosci. Model Dev., 8, 2465–2513, https://doi.org/10.5194/gmd-8-2465-2015, 2015.
Aumont, O., van Hulten, M., Roy-Barman, M., Dutay, J.-C., Éthé, C., and Gehlen, M.: Variable reactivity of particulate organic matter in a global ocean biogeochemical model, Biogeosciences, 14, 2321–2341, https://doi.org/10.5194/bg-14-2321-2017, 2017. Ayache, M., Dutay, J.-C., Arsouze, T., Révillon, S., Beuvier, J., and Jeandel, C.: High-resolution neodymium characterization along the Mediterranean margins and modelling of eNd distribution
in the Mediterranean basins, Biogeosciences, 13, 5259–5276, https://doi.org/10.5194/bg-13-5259-2016, 2016.
Bacon, M. and Anderson, R.: Distribution of Thorium Isotopes Between Dissolved and Particulate Forms in The Deep Sea, J. Geophys. Res., 87, 2045–2056, https://doi.org/10.1029/JC087iC03p02045, 1982.
Biastoch, A., Böning, C. W., Getzlaff, J., Molines, J.-M., and Madec, G.: Causes of Interannual–Decadal Variabil-ity in the Meridional Overturning Circulation of the Mid-latitude North Atlantic Ocean, J. Climate, 21, 6599–6615, https://doi.org/10.1175/2008JCLI2404.1, 2008.
Böhm, E., Lippold, J., Gutjahr, M., Frank, M., Blaser, P., Antz, B., Fohlmeister, J., Frank, N., Andersen, M. B., and Deininger, M.: Strong and deep Atlantic meridional overturning cir-culation during the last glacial cycle, Nature, 517, 73–76, https://doi.org/10.1038/nature14059, 2015.
Broecker, W. S., Andree, M., Bonani, G., Wolfli, W., Oeschger, H., Klas, M., Mix, A., and Curry, W.: Preliminary estimates for the radiocarbon age of deep water in the glacial ocean, Paleoceanog-raphy, 3, 659–669, https://doi.org/10.1029/PA003i006p00659, 1988.
Brun-Cottan, J. C., Auger, R., Lambere, C. E., and Ches-selet, R.: Sources and transport of suspended calcites in Pacific Deep Water, J. Mar. Res., 49, 543–564, https://doi.org/10.1357/002224091784995837, 1991.
Burckel, P., Waelbroeck, C., Gherardi, J. M., Pichat, S., Arz, H., Lippold, J., Dokken, T., and Thil, F.: Atlantic Ocean circula-tion changes preceded millennial tropical South America rainfall events during the last glacial, Geophys. Res. Lett., 42, 411–418, https://doi.org/10.1002/2014GL062512, 2014GL062512, 2015. Burckel, P., Waelbroeck, C., Luo, Y., Roche, D. M., Pichat, S.,
Jac-card, S. L., Gherardi, J., Govin, A., Lippold, J., and Thil, F.: Changes in the geometry and strength of the Atlantic meridional overturning circulation during the last glacial (20–50 ka), Clim. Past, 12, 2061–2075, https://doi.org/10.5194/cp-12-2061-2016, 2016.
Chase, Z., Anderson, R., Fleisher, M., and Kubik, P.: The influence of particle composition and particle flux on scavenging of Th, Pa and Be in the ocean, Earth Planet. Sc. Lett., 204, 215–229, 2002. Chuang, C.-Y., Santschi, P. H., Jiang, Y., Ho, Y.-F., Quigg, A., Guo, L., Ayranov, M., and Schumann, D.: Important role of biomolecules from diatoms in the scavenging of particle-reactive radionuclides of thorium, protactinium, lead, polo-nium, and beryllium in the ocean: A case study with Phaeo-dactylum tricornutum, Limnol. Oceanogr., 59, 1256–1266, https://doi.org/10.4319/lo.2014.59.4.1256, 2014.
Cunningham, S., Kanzow, T., Rayner, D., Baringer, M., Johns, W., Marotzke, J., Longworth, H., Grant, E., Hirschi, J.-M., Beal, L., Meinen, C. S., and Bryden, H. L.: Temporal variability of the Atlantic meridional overturning circulation at 26.5◦N, Science, 317, 935–938, https://doi.org/10.1126/science.1141304, 2007. Deng, F., Thomas, A. L., Rijkenberg, M. J., and
Hender-son, G. M.: Controls on seawater 231Pa, 230Th and 232Th concentrations along the flow paths of deep waters in the Southwest Atlantic, Earth Planet. Sc. Lett., 390, 93–102, https://doi.org/10.1016/j.epsl.2013.12.038, 2014.
trans-port measured in Drake Passage, Geophys. Res. Lett., 43, 11760– 11767, https://doi.org/10.1002/2016GL070319, 2016.
Druffel, E., Williams, P., Bauer, J., and Ertel, J.: Cy-cling of dissolved and particulate organic matter in the open ocean, J. Geophys. Res., 97, 15639–15659, https://doi.org/10.1029/92JC01511, 1992.
Dunk, R., Mills, R., and Jenkins, W.: A reevaluation of the oceanic uranium budget for the Holocene, Chem. Geol., 190, 45–67, https://doi.org/10.1016/S0009-2541(02)00110-9,
Dutay, J., Bullister, J., Doney, S., Orr, J., Najjar, R., Caldeira, K., Campin, J., Drange, H., Follows, M., Gao, Y., Gruber, N., Hecht, M. W., Ishida, A., Joos, F., Lindsay, K., Madec, G., Maier-Reimer, E., Marshall, J. C., Matear, R. J., Monfray, P., Mouchet, A., Plattner, G.-K., Sarmiento, J., Schlitzer, R., Slater, R., Totter-dell, I. J., Weirig, M.-F., Yamanaka, Y., and Yool, A.: Evaluation of ocean model ventilation with CFC-11, Ocean Model., 4, 89– 120, https://doi.org/10.1016/S1463-5003(01)00013-0, 2002. Dutay, J., Lacan, F., Roy-Barman, M., and Bopp, L.:
Influ-ence of particle size and type on 231Pa and230Th simulation with a global coupled biogeochemical-ocean general circulation model: A first approach, Geochem. Geophy. Geosy., 10, Q01011, https://doi.org/10.1029/2008GC002291, 2009.
Dutay, J., Tagliabue, A., Kriest, I., and van Hulten, M. M. P.: Mod-elling the role of marine particle on large scale231Pa,230Th, Iron and Aluminium distributions, Prog. Oceanogr., 133, 66–72, https://doi.org/10.1016/j.pocean.2015.01.010, 2015.
Gardner, W. D. and Sullivan, L. G.: Benthic storms, Science, 213, 329–331, 1981.
Gardner, W. D., Tucholke, B. E., Richardson, M. J., and Biscaye, P. E.: Benthic storms, nepheloid layers, and linkage with upper ocean dynamics in the western North Atlantic, Mar. Geol., 385, 304–327, https://doi.org/10.1016/j.margeo.2016.12.012, 2017. Gehlen, M., Gangstø, R., Schneider, B., Bopp, L., Aumont, O.,
and Ethe, C.: The fate of pelagic CaCO3 production in a
high CO2 ocean: a model study, Biogeosciences, 4, 505–519, https://doi.org/10.5194/bg-4-505-2007, 2007.
Geibert, W. and Usbeck, R.: Adsorption of thorium and protactinium onto different particle types: experimen-tal findings, Geochim. Cosmochim. Ac., 68, 1489–1501, https://doi.org/10.1016/j.gca.2003.10.011, 2004.
Gent, P. and McWilliams, J.: Isopycnal mixing in ocean circulation models, J. Phys. Oceanogr., 20, 150–155, https://doi.org/10.1175/1520-0485(1990)020<0150:IMIOCM>2.0.CO;2, 1990.
Gent, P., Willebrand, J., McDougall, T., and McWilliams, J.: Parameterizing eddy-induced tracer transports in ocean circulation models, J. Phys. Oceanogr., 25, 463–474, https://doi.org/10.1175/1520-0485(1995)025<0463:PEITTI>2.0.CO;2, 1995.
German, C. R., Casciotti, K. A., Dutay, J.-C., Heimbürger, L. E., Jenkins, W. J., Measures, C. I., Mills, R. A., Obata, H., Schlitzer, R., Tagliabue, A., Turner, D. R., and Whitby, H.: Hydrothermal impacts on trace element and isotope ocean biogeochemistry, Philos. T. R. Soc. A, 374, 2081, https://doi.org/10.1098/rsta.2016.0035, 2016.
Gu, S. and Liu, Z.: 231Pa and 230Th in the ocean model of the Community Earth System Model (CESM1.3), Geosci. Model Dev., 10, 4723–4742, https://doi.org/10.5194/gmd-10-4723-2017, 2017.
Hauglustaine, D., Hourdin, F., Jourdain, L., Filiberti, M.-A., Wal-ters, S., Lamarque, J.-F., and Holland, E.: Interactive chem-istry in the Laboratoire de Météorologie Dynamique general circulation model, J. Geophys. Res.-Atmos., 109, D04314, https://doi.org/10.1029/2003JD003957, 2004.
Hayes, C. T., Anderson, R. F., Fleisher, M. Q., Serno, S., Winckler, G., and Gersonde, R.: Quantifying lithogenic in-puts to the North Pacific Ocean using the long-lived thorium isotopes, Earth Planet. Sc. Lett., 383, 16–25, https://doi.org/10.1016/j.epsl.2013.09.025, 2013.
Hayes, C. T., Anderson, R. F., Fleisher, M. Q., Serno, S., Winckler, G., and Gersonde, R.: Biogeography in
231Pa/230Th ratios and a balanced 231Pa budget for
the Pacific Ocean, Earth Planet. Sc. Lett., 391, 307–318, https://doi.org/10.1016/j.epsl.2014.02.001, 2014.
Hayes, C. T., Anderson, R. F., Fleisher, M. Q., Huang, K.-F., Robin-son, L. F., Lu, Y., Cheng, H., Edwards, R. L., and Moran, S. B.:
230Th and231Pa on GEOTRACES GA03, the US GEOTRACES
North Atlantic transect, and implications for modern and paleo-ceanographic chemical fluxes, Deep-Sea Res. Pt. II, 116, 29–41, https://doi.org/10.1016/j.dsr2.2014.07.007, 2015a.
Hayes, C. T., Anderson, R. F., Fleisher, M. Q., Lam, P. J., Ohnemus, D. C., Huang, K.-F., Robinson, L. F., Lu, Y., Cheng, H., Edwards, R. L., and Moran, S. B.: Intensity of Th and Pa scavenging partitioned by particle chem-istry in the North Atlantic Ocean, Mar. Chem., 170, 49–60, https://doi.org/10.1016/j.marchem.2015.01.006, 2015b. Heinze, C., Gehlen, M., and Land, C.: On the potential of
230Th, 231Pa, and 10Be for marine rain ratio determinations:
A modeling study, Global Biogeochem. Cy., 20, gB2018, https://doi.org/10.1029/2005GB002595, 2006.
Heinze, C., Ilyina, T., and Gehlen, M.: The potential of
230Th for detection of ocean acidification impacts on
pelagic carbonate production, Biogeosciences, 15, 3521–3539, https://doi.org/10.5194/bg-15-3521-2018, 2018.
Henderson, G. M. and Anderson, R. F.: The U-series Toolbox for Paleoceanography, Reviews in Mineralogy and Geochemistry, 52, 493–531, https://doi.org/10.2113/0520493, 2003.
Henderson, G. M., Heinze, C., Anderson, R. F., and Winguth, A. M.: Global distribution of the 230Th flux to ocean sediments constrained by GCM modelling, Deep-Sea Res. Pt. I, 46, 1861–1893, https://doi.org/10.1016/S0967-0637(99)00030-8, 1999 (observational data available at: http://climotope.earth.ox.ac.uk/data_compilations/holocene_ 231pa230th_dataset_notes_and_references, last access: 27 Au-gust 2018).
Honeyman, B. D. and Santschi, P. H.: Metals in aquatic systems, Environ. Sci. Technol., 22, 862–871, https://doi.org/10.1021/es00173a002, 1988.
Honeyman, B. D., Balistrieri, L. S., and Murray, J. W.: Oceanic trace metal scavenging, Deep-Sea Res. Pt. A, 35, 227–246, https://doi.org/10.1016/0198-0149(88)90038-6, 1988.
Johnson, G. C.: Quantifying Antarctic Bottom Water and North Atlantic Deep Water volumes, J. Geophys. Res.-Oceans, 113, c05027, https://doi.org/10.1029/2007JC004477, 2008.