Macular thickness amplitude changes
when switching from discontinuous to
continuous therapy for diabetic
macular oedema
Sidney A Schechet,1 Olufemi E Adams, 1 David A Eichenbaum,2,3 Seenu M Hariprasad1
To cite: Schechet SA, Adams OE, Eichenbaum DA,
et al. Macular thickness amplitude changes when switching from discontinuous to continuous therapy for diabetic macular oedema.
BMJ Open Ophthalmology
2019;4:e000271. doi:10.1136/ bmjophth-2019-000271
Received 1 January 2019 Accepted 20 February 2019
1Ophthalmology and Visual Science, University of Chicago, Chicago, Illinois, USA 2Partner, Retina Vitreous Associates of Florida, St Petersburg, Florida, USA 3Ophthalmology, USF Health Morsani College of Medicine, Tampa, Florida, USA
Correspondence to
Dr Seenu M Hariprasad; Retina@ uchicago. edu © Author(s) (or their employer(s)) 2019. Re-use permitted under CC BY-NC. No commercial re-use. See rights and permissions. Published by BMJ.
Key messages
What is already known about this subject?
► The 0.2 µg/day fluocinolone acetonide (FAc) intrav-itreal implant is an efficacious therapy for persistent diabetic macular oedema (DME).
What are the new findings?
► In patients with DME, following FAc, there was a sig-nificant decrease in both the central retinal thickness (CRT) amplitude and number of treatments required.
How might these results change the focus of research or clinical practice?
► In real-world patients with persistent DME, FAc may mitigate alterations in the CRT, promoting long-term stability of vision while decreasing the treatment burden.
AbsTrACT
Objective To investigate if the mean central retinal thickness (CRT) amplitude, measured between visits, is consistently decreased when switching from discontinuous to continuous therapy for diabetic macular oedema (DME) following fluocinolone acetonide (FAc) administration. Methods and analysis In this retrospective cohort study, all patients with DME treated with FAc at a single centre were included. The primary outcome was CRT amplitude changes measured at each visit prior to and after FAc administration. Secondary outcomes included average number of DME treatments before and after FAc injection, visual acuity and intraocular pressure changes. results Nineteen eyes were included. The mean (SD) follow-up after FAc was 399 (222) days. The mean (SD) CRT amplitude before FAc was 194.6 (114.90) µm, and following FAc administration, the amplitude decreased to 70.8 (94.23) µm (95% CI −189.5 to −58.1; p≤0.001). After FAc, the number of treatments required per month significantly decreased from an average of 1 treatment every 2.7 months to every 6 months (p=0.009). Conclusion In patients with DME, the CRT amplitude values and number of treatments significantly decrease following FAc administration while maintaining vision. Further studies are needed to evaluate the significance of these interesting findings.
InTrOduCTIOn
Diabetic retinopathy (DR) is a major microvas-cular complication in patients with diabetes mellitus and is present in approximately 35% of patients with diabetes,1 with diabetic
macular oedema (DME) being the leading cause of vision loss in the USA.2 Patients with
DR and DME suffer from a profound decreased quality of life.3 The pathophysiology of DME
is mediated by inflammatory cascades caused by the upregulation of factors such as the vascular endothelial growth factor (VEGF), and by the breakdown of the blood-retina barrier, via the loss of pericytes, endothelial cell-cell junctions and increased thickness in the vascular basement membrane. These events promote leakage of fluid and lipids
into the macula.4–7 As the macula becomes
oedematous, for example, at the junction of the inner and outer segment layers and the external limiting membrane (the ellipsoid zone),8 photoreceptor misalignment and
structural changes occur, contributing to the loss of these cells.9 10 Despite the changes
in DME, some photoreceptors retain their function, and restoring the integrity of the ellipsoid zone can lead to improvement in visual acuity in DME.11
Current therapies for DME include focal/ grid laser, intraocular steroids and anti-VEGF injections, including Aflibercept (Eylea), Ranibizumab (Lucentis) and Bevacizumab (Avastin).2 12–16 However, up to 50% of
patients undergoing anti-VEGF therapy still have persistent macular thickening,17 so there
is a need for better, longer-acting therapies for DME in order to reduce the overall treat-ment burden on both patients and treating physicians.
Following the multicentre, prospective, randomised, phase III Fluocinolone Acetonide in Diabetic Macular Edema (FAME) study,
on September 12, 2020 by guest. Protected by copyright.
the 0.2 µg/day fluocinolone acetonide (FAc) intravitreal implant, IIuvien (Alimera Sciences, Alpharetta, Georgia, USA), was FDA-approved as a long-term steroid therapy for DME that lasts up to 36 months.18 FAME studied 956
patients with persistent DME who were randomised 2:2:1 to receive a sham injection (n=185), 0.2 µg FAc (n=376) or 0.5 µg FAc (n=395). The low-dose FAc implant was ultimately FDA-approved as it met the primary endpoint where 33% of patients gained 15 letters or more from their baseline best-corrected visual acuity (BCVA) at 3 years as opposed to 21% in the placebo group. Further-more, in the US Retrospective Chart Review in Patients Receiving Iluvien (USER) clinical study, treatment with FAc showed that in 160 eyes, 63% of the eyes required no additional treatment for DME.19
Modern-day retinal specialists rely heavily on the use of optical coherence tomography (OCT) to measure the central retinal thickness (CRT) when treating patients with DME.20 In DME, reduction in the CRT correlates
with visual improvement,21–23 thus these values are
quan-titatively assessed and monitored as a means to examine response to treatment. It is not uncommon to find the CRT values fluctuate up and down between each treat-ment visit in patients with DME. While the significance of varied and often increased CRT amplitude changes that occur between DME treatments has not been studied, one can surmise that long-term photoreceptor viability may be negatively impacted. The study herein seeks to describe the CRT amplitude changes that occurred in a cohort of patients with chronic DME who were treated with the FAc implant. To the author’s knowledge, this is the first study describing the macular thickness ampli-tude changes that occur during the treatment course of patients with DME, specifically following treatment with FAc.
MeTHOds study design
This is a single-centre, retrospective cohort study for all patients with DME at our institution who received the 0.2 µg/day FAc intravitreal implant (FAc, Alimera Sciences, Alpharetta, Georgia, USA) from March 2016, until the present day. This study was approved by the University of Chicago Biological Sciences Division Institutional Review Board.
study population
Electronic medical records (Epic, Verona, Wisconsin, USA) were reviewed for all patients treated with FAc and each clinical encounter was analysed from 36 months before FAc was injected until the most recent follow-up encounter. Subjects were included if they were above the age of 18, had DME that was treated by focal laser, anti-VEGF or steroid injections followed by treatment with FAc and had at least one post-FAc encounter. Further-more, FAc must have been used per FDA label (all patients must have been previously treated with a course of corticosteroids and did not have a clinically significant
rise in intraocular pressure). Exclusion criteria included patients under the age of 18, those who had no follow-up visits after FAc and those with macular ischaemia.
All patients with DME were treated by a single retina specialist with a treat-and-extend algorithm prior to and following administration of the FAc implant. Choice of therapy, if required, was at the discretion of the single treating physician (SMH) and made on a case-by-case basis.
data analysis
‘Baseline’ was designated as the date of FAc adminis-tration. Data were extracted from each retina clinic visit every 3 months before and after baseline using ±45 day visit windows. This interval was examined 36 months before FAc was injected, up until the most recent follow-up encounter. Data gathered included patient demographics, therapies received at each visit, BCVA (converted to Early Treatment Diabetic Retinopathy Study [ETDRS] letters) and CRT values obtained on a Cirrus SD-OCT machine (Carl Zeiss Meditec, Dublin, California, USA). The primary endpoint was the macular thickness amplitude change, which is defined as aver-aging the difference between maximum and minimum CRT values at successive visits during the pre-FAc time period compared with post-FAc. Other secondary outcomes evaluated were pre-FAc and post-FAc changes in the BCVA, IOP, CRT and the time interval between treatments required for DME.
statistical analysis
Statistical analyses were performed using a paired t-test, with a type 1 error rate of p<0.05 accepted as statisti-cally significant using SAS software (V.9.3; SAS Institute, Cary, North Carolina, USA) programme. Snellen VA was converted into ETDRS letter scores as described by Gregori et al to facilitate statistical calculation.24
resulTs
Nineteen eyes from 15 patients who received the 0.2 µg/day FAc intravitreal implant were included in the study. Four patients received bilateral FAc treatment. Demographic characteristics are listed in table 1. The mean (SD) age for all eyes in the study at baseline was 64.7±14.08 years, and the majority of patients were male (66.7%). Eleven of the 19 eyes were pseudophakic prior to receiving FAc, and 7 more eyes underwent cataract surgery during the study period, after FAc. The majority of patients had Type 2 Diabetes (93.3%), with an average HbA1c of 7.07%, and DME was diagnosed on average 2.90±2.45 years prior to FAc administration. The mean time of follow-up after FAc injection was 399.3±222.91 days.
The mean (SD) CRT amplitude was 194.6±114.60 µm for all eyes in the study prior to receiving FAc, and following FAc administration, there was a significant reduction in this amplitude to 70.8±94.23 microns (95% CI −189.5 to −58.1, p≤0.001), demonstrating a 123.8 µm
on September 12, 2020 by guest. Protected by copyright.
Table 1 Baseline Characteristics
Eyes treated with 0.2 µg/day FAc intravitreal implant (n=15 patients/19 eyes)
Age (years), mean±SD 64.7±14.08
Males, % 66.7
Race, %
Caucasian 26.7
Black/African American 40.0
Asian/Middle East Indian 13.3
Latino 13.3
Native Hawaiian 6.7
Type 2 diabetes, % 93.3
Diagnosis (years) before FAc, mean
DME (n=19 eyes) 2.90±2.45
HbA1C, mean (%) 7.07
Initial lens status—Phakic %/
Pseudophakic % (n=19 eyes) 42.1/57.9 Follow-up time (days)—Prior to
FAc/After FAc administration 872.7±601.8/399.3±222.91
FAc, fluocinolone acetonide.
Table 2 Changes in Central Retinal Thickness (CRT) Amplitude, Best Corrected Visual Acuity (BCVA), Intraocular Pressure (IOP) and CRT before and after FAc
Pre-FAc
administration Post-FAcadministration P value
Central Retinal Thickness Amplitude (µm) (mean, SD) 194.6
(114.60)
70.8 (94.23)
<0.001
Best Corrected Visual Acuity (ETDRS letters) (mean, SD) 64.0 (14.76) 64.4 (19.59) 0.895
Intraocular Pressure (mm Hg) (mean, SD) 15.9 (4.29) 18.6 (5.22) 0.104
Central Retinal Thickness (µm) (mean, SD) 328.0 (58.16) 293.8 (59.63) 0.077
CRT, central retinal thickness; ETDRS, Early Treatment Diabetic Retinopathy Study; FAc, fluocinolone acetonide.
reduction in the mean CRT amplitude. The overall value in the CRT was reduced following FAc administration from a mean of 328±58.16 µm prior to FAc to 293.8±59.63 µm at the latest follow-up (p=0.077) (table 2).
In our study, the BCVA was maintained at the latest follow-up, improving from 64.0 (20/50) ETDRS letters (±14.76 SD) to 64.4 (20/50) ETDRS letters (±19.59) (p=0.895). Furthermore, a non-significant increase in the IOP was seen from a mean of 15.9±4.29 to 18.6±5.22 mm Hg following FAc for all eyes (p=0.104). Of the 19 eyes, 10 (52.6%) had a decrease or no change in the IOP. Conversely, of the nine eyes (47.4%) which had an increase in the IOP, only two eyes demonstrated an increase of more than 7 mm Hg. Furthermore, six eyes (31.6%) were started on IOP-lowering eyedrops following FAc. Only one eye required a laser trabeculoplasty and no eyes needed incisional surgery.
Prior to FAc, each eye was treated with one or more DME treatments including focal/grid laser, anti-VEGF
injections and intraocular steroids, summarised in
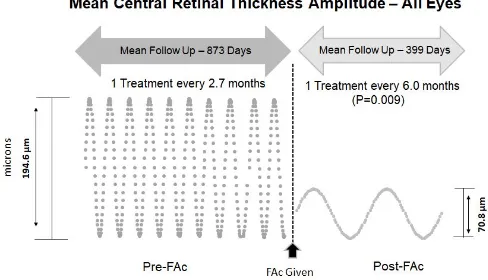
table 3. After FAc, the number of treatments required per month significantly decreased from an average of 1 treat-ment every 2.7 months to 1 treattreat-ment every 6 months (p=0.009), while the average number of visits (SD) per year remained relatively the same at 5.15±2.13 visits prior to FAc and 4.32±1.40 visits following FAc (p=0.203). Prior to FAc, the average follow-up time period was 873 days, and during this time period, there was an average of 10 treatments per eye. Following FAc, over an average follow-up time period of 399 days, there was an average of 2 treatments received per eye (figure 1).
dIsCussIOn
For patients with DME, the current treatment options include intravitreal anti-VEGF injections, intraocular steroids and focal/grid lasers in an attempt to treat and prevent vision loss.2 12–16 25 26 Focal/grid laser was
the gold-standard treatment for DME for many years, but a high rate of recurrent oedema was shown, and trials such as RESTORE and the READ-2 studies have demonstrated the superiority of intravitreal anti-VEGF over focal laser.2 26 27 Comparing a recent DRCR study
which showed that 18% of patients with DME treated with focal laser experienced a 3-line improvement in BCVA,28 DRCR Protocol T showed that after 2 years of
anti-VEGF treatments with aflibercept, bevacizumab or ranibizumab, 39%, 35% and 37% of patients with DME had a 3-line improvement in the BCVA, respectively.15
Furthermore, the RISE/RIDE studies established the efficacy of ranibizumab as monotherapy, with the RISE trial demonstrating that at 36 months, 51.2% of patients receiving 0.3 mg ranibizumab gained ≥15 ETDRS letters compared with 22.0% in the sham injection group, while in the RIDE cohort 36.8% of the group receiving 0.3 mg ranibizumab gained ≥15 ETDRS letters compared with 19.2% in the sham injection group.25 29 Based on these
promising outcomes, anti-VEGF therapy has become the new gold standard treatment for DME. Last, steroids can play a major role in the treatment of DME and provide longer-lasting treatments such as with the intravitreal 0.7 mg dexamethasone implant (Ozurdex) which provides continuous treatment for up to 3 months, and the 0.2 µg/day FAc intravitreal implant (Iluvien) which acts in a similar manner for 36 months.18 30
on September 12, 2020 by guest. Protected by copyright.
Table 3 Treatments for Diabetic Macular Oedema for All Eyes
Injection Drug
FAc Treatments (n=19 eyes)
Pre-FAc Post-FAc
Eyes
N (%) Total Treatments EyesN (%) Total Treatments
Any treatment 19 (100%) 155 9 (47.4%) 54
Anti-VEGF treatments 17 (89.5%) 92 9 (47.4%) 52
Avastin 4 (21.1%) 4 0 (0.0%) 0
Lucentis 8 (42.1%) 44 0 (0.0%) 0
Eylea 15 (78.9%) 44 9 (47.4%) 52
Steroid treatment 18 (94.7%) 37 1 (5.3%) 1
Triamcinolone 0 (0.0%) 0 0 (0.0%) 0
Dexamethasone 18 (94.7%) 37 1 (5.3%) 1
Focal/Grid laser 10 (52.6%) 26 1 (5.3%) 1
FAc, fluocinolone acetonide.
Figure 1 Mean Central Retinal Thickness Amplitude—All Eyes. Over an average pre-FAc period of 873 days, 19 eyes received an average of 10 treatments per eye, and the mean CRT amplitude was 194.6 µm. Post-FAc, at the latest follow-up visit of an average of 399 days, each eye received an average of two treatments and the mean CRT amplitude was 70.8, demonstrating a reduction of 123.8 µm (p=0.001). After FAc, the number of treatments required per month significantly decreased from an average of 1 treatment every 2.7 months to 1 treatment every 6 months (p=0.009). FAc, fluocinolone acetonide.
However, for patients with DME and for their treating physicians, the intensive regimen of frequent examina-tions and numerous intravitreal injecexamina-tions is a burden to both parties. The DME anti-VEGF treatment cycle is expensive for the healthcare system. Juxtaposed to monthly visits and treatments for DME seen in trials such as the RISE/RIDE studies,29 less intensive injection
algorithms have been proposed and studied such as PRN treatments or treat-and-extend.31–33 In a study assessing
the treat-and-extend protocol, at 2 years, there was a significant improvement in the BCVA, and reduction in the central macular thickness.31 In these protocols, OCT
with CRT measurements is a mainstay imaging modality used to monitor treatment response and to guide further
management decisions. Several studies have shown at least a modest correlation between CRT values and visual function following therapy for DME, and this correlation has been demonstrated with macular laser, bevacizumab and intravitreal dexamethasone21–23; In a DRCR study of
251 eyes, a correlation coefficient for visual acuity versus CRT on OCT was 0.52, 0.49, 0.36 and 0.38 at baseline, 3.5 months, 8 months and 12 months following laser photocoagulation, respectively.21 Another study assessing
treatment of DME with an intravitreal steroid delivery system showed a modest inverse correlation between the macular thickness and BCVA, with a significant correlation of 0.53 at 90 days from baseline with 700-µg dexamethasone.23
In this study, when treating eyes with chronic DME, the authors noted an increased variability of the measured CRT values taken at each visit prior to administration of FAc. However, when converting to continuous steroid therapy via the FAc implant, the CRT amplitudes between visits were profoundly reduced by an average of 123.8 µm compared with before FAc administration. These results are especially impressive as this patient population had DME recalcitrant to traditional management requiring a switch in therapy to the FAc implant.
To the author’s knowledge, no published studies have evaluated the change in CRT amplitudes before and after a given treatment for DME. While the clinical relevance and long-term effects on visual prognosis remain unclear and need to be studied, information gleaned from basic science analyses demonstrate the negative impact that macular oedema plays on photoreceptor viability.8–10
The presence of macular oedema leads to a diminished photoreceptor directional sensitivity due to changes in cone alignment and structure, with a possible end-result of photoreceptor cellular loss.9 In DME, a study revealed that disruption in the inner and outer segment layer of the retina with oedema was associated with a 3.28 dB decrease in the retinal point sensitivity as measured by
on September 12, 2020 by guest. Protected by copyright.
fundus microperimetry.8 Furthermore, the integrity
of this layer is an important determinant of the effect of macular thickness on the visual acuity,9 and a strong
relationship exists between the point thickness of the macula and a decreased macular sensitivity.10 One may
surmise that frequent, large changes in macular thick-ness, as measured by the amplitude can further hinder photoreceptor alignment and structure, and the recur-rent stretching and shrinking of photoreceptor cells can possibly negatively impact long-term function. Larde-noye and colleagues demonstrated that non-damaged photoreceptors that have been misaligned structurally by macular oedema can have a return to normal directional sensitivity following resolution of the macular oedema. Furthermore, improved visual acuity were correlated with these findings.9 A significant decrease in macular
thick-ness amplitude following FAc was shown in our cohort of patients with DME, and we surmise that the decreased fluctuations in macular thickness have a positive, long-term effect on photoreceptor viability, and ultimately visual function.
From a clinical practice standpoint, the decreased amplitude changes of the CRT seen following FAc correlated with a decreased treatment frequency where the number of treatments required per month signifi-cantly decreased from an average of 1 treatment every 2.7 months to 1 treatment every 6 months. After switching from discontinuous DME therapies such as anti-VEGF, focal/grid laser and/or intravitreal dexamethasone implants, the switch to continuous steroid therapy via the FAc intravitreal implant decreased the treatment burden on the patient and treating physician, and also decreased is the possibility of complications associated with frequent intravitreal injections such as endophthalmitis.
A limitation of this study is its retrospective nature without randomisation, and there were a relatively small number of eyes included in the study. Furthermore, the concept of studying change in macular thickness ampli-tudes before and after a given treatment is novel in the current literature, so we are unable to compare our find-ings. Conversely, the idea of macular amplitude changes is a potential new avenue to investigate further, with the possibility of correlating these results with macular sensitivities. Nevertheless, this is a unique real-world evaluation of FAc treatment for DME in that all DME treatments (anti-VEGF, steroids and focal laser) were compared pre-FAc and post-FAc.
In conclusion, our real-world results highlight that in eyes with DME, a significant reduction in the mean CRT amplitude occurs after treatment with FAc. Concurrently, a reduction in treatment burden while maintaining BCVA was observed. Further studies are needed to eval-uate these interesting findings and the long-term effects of decreased CRT amplitudes.
Contributors Substantial intellectual contributions to the content of this manuscript were made by the authors in the following areas. Planning the research question: SAS, OEA, SMH. Conducting the protocols described: SAS, OEA. Drafting,
critical revision and final approval: SAS, OEA, DAE, SMH. Corresponding author and overall content guarantor: SMH.
Funding The authors have not declared a specific grant for this research from any funding agency in the public, commercial or not-for-profit sectors.
Competing interests SAS and OEA report no financial disclosures. DAE is a consultant, investigator or on the speaker’s bureau for Genentech, Regeneron, Allergan, Clearside, Novartis, Alimera, Ophthotech, Notal Vision, Allegro, Eyepoint, Mylan, Chengdu, Orbit Biomedical and Adverum. DAE is also an equity/stockholder in Clearside, US Retina, Hemera Biopharmaceuticals and Boston Image Reading Center. SMH is a consultant or on the speaker’s bureau for Alcon, Allergan, Novartis, OD-OS, Clearside Biomedical, EyePoint Pharmaceuticals, Alimera Sciences, Spark and Regeneron.
Patient consent for publication Not required.
Provenance and peer review Not commissioned; externally peer reviewed.
Open access This is an open access article distributed in accordance with the Creative Commons Attribution Non Commercial (CC BY-NC 4.0) license, which permits others to distribute, remix, adapt, build upon this work non-commercially, and license their derivative works on different terms, provided the original work is properly cited, appropriate credit is given, any changes made indicated, and the use is non-commercial. See: http:// creativecommons. org/ licenses/ by- nc/ 4. 0/.
reFerenCes
1. Yau JWY, Rogers SL, Kawasaki R, et al. Global prevalence and major risk factors of diabetic retinopathy. Diabetes Care 2012;35:556–64. 2. Photocoagulation for diabetic macular edema. early treatment
diabetic retinopathy study report number 1. early treatment diabetic retinopathy study Research Group. Arch Ophthalmol
1985;103:1796–806.
3. Hariprasad SM, Mieler WF, Grassi M, et al. Vision-related quality of life in patients with diabetic macular oedema. Br J Ophthalmol
2008;92:89–92.
4. Das A, McGuire PG, Rangasamy S. Diabetic macular edema: pathophysiology and novel therapeutic targets. Ophthalmology
2015;122:1375–94.
5. Frank RN, retinopathy D. Diabetic retinopathy. N Engl J Med
2004;350:48–58.
6. Funatsu H, Noma H, Mimura T, et al. Association of vitreous inflammatory factors with diabetic macular edema. Ophthalmology
2009;116:73–9.
7. Brownlee M. The pathobiology of diabetic complications: a unifying mechanism. Diabetes 2005;54:1615–25.
8. Yohannan J, Bittencourt M, Sepah YJ, et al. Association of retinal sensitivity to integrity of photoreceptor inner/outer segment junction in patients with diabetic macular edema. Ophthalmology
2013;120:1254–61.
9. Lardenoye CW, Probst K, DeLint PJ, et al. Photoreceptor function in eyes with macular edema. Invest Ophthalmol Vis Sci
2000;41:4048–53.
10. Hatef E, Colantuoni E, Wang J, et al. The relationship between macular sensitivity and retinal thickness in eyes with diabetic macular edema. Am J Ophthalmol 2011;152:400–5.
11. Mori Y, Suzuma K, Uji A, et al. Restoration of foveal photoreceptors after intravitreal ranibizumab injections for diabetic macular edema.
Sci Rep 2016;6.
12. Jansen ME, Hariprasad SM, Singer MA. Treatments for diabetic macular edema: past, present, and future. Ophthalmic Surg Lasers
Imaging Retina 2016;47:794–800.
13. Telander D, Hunter A, Hariprasad SM. The evolving paradigm for the treatment of diabetic macular edema. Ophthalmic Surg Lasers
Imaging Retina 2013;44:324–8.
14. Wykoff CC, Hariprasad SM. DRCR Protocol-T: reconciling 1- and 2-year data for managing diabetic macular edema. Ophthalmic Surg
Lasers Imaging Retina 2016;47:308–12.
15. Wykoff CC, Hariprasad SM. Comparing aflibercept, bevacizumab, and ranibizumab for DME: analysis of DRCR protocol T. Ophthalmic
Surg Lasers Imaging Retina 2015;46:302–5.
16. Hariprasad SM. Current approaches to the management of diabetic macular edema. Am J Manag Care 2016;22(10 Suppl):s292–9. 17. Jampol LM, Bressler NM, Glassman AR. Revolution to a
new standard treatment of diabetic macular edema. JAMA
2014;311:2269–70.
18. Campochiaro PA, Brown DM, Pearson A, et al. Sustained delivery fluocinolone acetonide vitreous inserts provide benefit for at least 3 years in patients with diabetic macular edema. Ophthalmology
2012;119:2125–32.
on September 12, 2020 by guest. Protected by copyright.
19. Eaton A, Koh SS, Jimenez J, et al. The USER Study: A Chart Review of Patients Receiving a 0.2 µg/day Fluocinolone Acetonide Implant for Diabetic Macular Edema. Ophthalmol Ther 2019;8:51–62. 20. Trichonas G, Kaiser PK. Optical coherence tomography imaging of
macular oedema. Br J Ophthalmol 2014;98 Suppl 2:ii24–9. 21. Browning DJ, Glassman AR, Aiello LP, et al. Relationship between
optical coherence tomography-measured central retinal thickness and visual acuity in diabetic macular edema. Ophthalmology
2007;114:525–36.
22. Hassairi AEM, Chebil A, Abdallah MB, et al. Correlation of visual acuity and central macular thickness in diabetic macular edema.
Acta Ophthalmologica 2015;93.
23. Blumenkranz MS, Haller JA, Kuppermann BD, et al. Correlation of visual acuity and macular thickness measured by optical coherence tomography in patients with persistent macular edema. Retina
2010;30:1090–4.
24. Gregori NZ, Feuer W, Rosenfeld PJ. Novel method for analyzing Snellen visual acuity measurements. Retina 2010;30:1046–50. 25. Nguyen QD, Brown DM, Marcus DM, et al. Ranibizumab for diabetic
macular edema: results from 2 phase III randomized trials: Rise and ride. Ophthalmology 2012;119:789–801.
26. Mitchell P, Bandello F, Schmidt-Erfurth U, et al. The restore study: ranibizumab monotherapy or combined with laser versus laser monotherapy for diabetic macular edema. Ophthalmology
2011;118:615–25.
27. Nguyen QD, Shah SM, Khwaja AA, et al. Two-year outcomes of the ranibizumab for edema of the mAcula in diabetes (READ-2) study.
Ophthalmology 2010;117:2146–51.
28. Diabetic Retinopathy Clinical Research Network. A randomized trial comparing intravitreal triamcinolone acetonide and focal/grid photocoagulation for diabetic macular edema. Ophthalmology
2008;115:1447–59.
29. Thomas BJ, Shienbaum G, Boyer DS, et al. Evolving strategies in the management of diabetic macular edema: clinical trials and current management. Can J Ophthalmol 2013;48:22–30.
30. Boyer DS, Yoon YH, Belfort R, et al. Three-year, randomized, sham-controlled trial of dexamethasone intravitreal implant in patients with diabetic macular edema. Ophthalmology
2014;121:1904–14.
31. Sugimoto M, Ichio A, Nunome T, et al. Two year result of intravitreal bevacizumab for diabetic macular edema using treat and extend protocol. Medicine 2017;96:e6406.
32. Arnold JJ, Campain A, Barthelmes D, et al. Two-year outcomes of "treat and extend" intravitreal therapy for neovascular age-related macular degeneration. Ophthalmology 2015;122:1212–9. 33. Murakami T, Nishijima K, Sakamoto A, et al. Association of
pathomorphology, photoreceptor status, and retinal thickness with visual acuity in diabetic retinopathy. Am J Ophthalmol
2011;151:310–7.
on September 12, 2020 by guest. Protected by copyright.